© 2018, IRJET | Impact Factor value: 6.171 | ISO 9001:2008 Certified Journal | Page 1907
“Modeling, Analysis & Optimization of Parameters for Great Weld
Strength of the Chassis for off-Road Vehicles”
Rahul Dixit
1, Kuldeep Kaushik
2, Promise Mittal
31
Research Scholar, Department of Mechanical Engineering, Vikrant Institute of Technology and Management,
Gwalior, Madhya Pradesh, India
2,3
Assistant Professor, Department of Mechanical Engineering, Vikrant Institute of Technology and Management,
Gwalior, Madhya Pradesh, India
---***---Abstract – Welding is a basic manufacturing process for
making components or assemblies in Automobile industries. There are many welding process parameters (WPP) whose selection contributes to the welded product as they all affect the strength and quality to a larger extent. In this work, some of the welding input process parameters are considered for the study which are material selection like mild steel (1018), carbon steel (1020) and alloy steel (4130), different welding rod diameter (D) and voltage of welding current (V), which are modelled, analyzed and optimized for a great weld strength through Electric arc welding technique for the production of chassis of off-road vehicles. In further work these welds are tested for bending strength on Universal Testing Machine (UTM). After which, the Taguchi methodology is adopted to analyze the effect of each welding process parameter on the weld strength, and the optimal process parameters are obtained/ proposed to achieve great weld strength. Further the experimental results are provided to illustrate the proposed approach, which helped us in deriving a mathematical model for breaking load for bending with the help of MATLAB. Finally a comparative analysis of results from different theories has been done in which we found that all results are approximately similar. Hence these values of parameters are proposed for the selection for other vital experiment, which will help to save the time and cost to design a new chassis of any vehicle.
Key Words: Welding Process Parameter (WPP), Material
Selection, Welding Rod Diameter (D), Voltage of Welding Current (V), Taguchi Methodology, MATLAB.
1. INTRODUCTION TO WELDING
Welding is a process in which two or more parts are joined permanently at their touching surfaces by a suitable application of heat and/or pressure. Often a filler material is added to facilitate coalescence. The assembled parts that are joined by welding are called a weldment. Welding is primarily used in metal parts and their alloys.
Fig.-1: Welding [13]
1.1 CLASSIFICATION OF WELDING PROCESSES
There are many types of welding techniques used to join metals. The welding processes differ in the manner in which temperature and pressure are combined and achieved. The welding process is divided into two major categories:
a) Plastic Welding or Pressure Welding and
b) Fusion Welding or Non-Pressure Welding.
a) Plastic Welding or Pressure Welding: When the metal piece acquires plastic state on heating, external pressure is applied. In this process, externally applied forces play an important role in the bonding operation. “A group of welding processes which produces coalescence at temperatures essentially below the melting point of the base materials being joined without the addition of a filler metal” is Pressure Welding Process. Without melting the base metal, due to temperature, time and pressure coalescence is produced..
b)
Fusion Welding or Non-Pressure Welding: The material at the joint is heated to a molten state and allowed to solidify. In this process the joining operation involves melting and solidification and any external forces applied to the system do not play an active role in producing coalescence. Usually fusion welding uses a filler material to ensure that the joint is filled.c) 1.2 TYPES OF WELDING
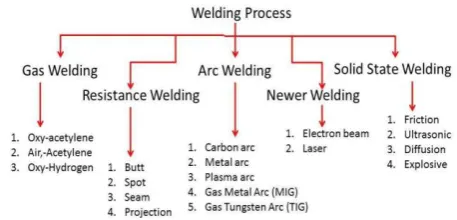
[image:1.595.325.554.652.762.2]Welding process can also be classified in the following ways as shown in the fig. 2 below:
© 2018, IRJET | Impact Factor value: 6.171 | ISO 9001:2008 Certified Journal | Page 1908 1.3 INTRODUCTION TO ELECTRIC ARC WELDING
Electrical arc welding is the procedure used to join two metal parts, taking advantage of the heat developed by the electric arc that forms between an electrode (metal filler) and the material to be welded. The welding arc may be powered by an alternating current generator machine (welder). This welding machine is basically a single-phase static transformer suitable for melting RUTILE (sliding) acid electrodes. Alkaline electrodes may also be melted by alternating current if the secondary open-circuit voltage is greater than 70 V.
Table-1: Guide table for selecting the electrode diameter
Thickness (mm) Electrode diameter(mm)
< 2 1.5
2 2
3 2.5
4 2.5/3.25
5 3.25/4
1.3.1 Factors Effecting Weld Quality
Electrode size, Welding current, Arc voltage Arc travel speed, Welding position
Gas Flow rate, Shielding Gas composition Electrode extension (length of stick out)
(a) Electrode Size: The electrode diameter influences the weld bead configuration (such as the size), the depth of penetration, bead width and has a consequent effect on the travel speed of welding. The larger electrode diameters create weld with less penetration but welder in width. The choice of the wire electrode diameter depends on the thickness of the work piece to be welded, the required weld penetration, the desired weld profile and deposition rate, the position of welding and the cost of electrode wire. Commonly used electrode sizes are (mm): 0.8, 1.0, 1.2, 1.6 and 2.4. Each size has a usable current range depending on wire composition and spray- type arc or short- circuiting arc is used.
(b) Welding Current: The value of welding current used in MIG has the greatest effect on the deposition rate, the weld bead size, shape and penetration. In MIG welding, metals are generally welded with direct current polarity electrode positive (DCEP, opposite to TIG welding), because it provides the maximum heat input to the work and therefore a relatively deep penetration can be obtained. When all the other welding parameters are held constant, increasing the current will increase the depth and the width of the weld penetration and the size of the weld bead.
(c) Welding Voltage: The arc length (arc voltage) is one of the most important variables in MIG that must be held under control. When all the variables such as the electrode composition and sizes, the type of shielding gas and the
welding technique are held constant, the arc length is directly related to the arc voltage. High and low voltages cause an unstable arc. Excessive voltage causes the formation of excessive spatter and porosity, in fillet welds it increases undercut and produces narrower beads with greater convexity, but an excessive low voltage may cause porosity and overlapping at the edges of the weld bead.
(d) Shielding Gas: The primary function of shielding gas is to protect the arc and molten weld, pool from atmosphere oxygen and nitrogen. If not properly protected it forms oxides and nitrites and result in weld deficiencies such as porosity, slag inclusion and weld embrittlement.
(e) Arc Travel Speed: The travel speed is the rate at which the arc travels along the work- piece. It is controlled by the welder in semiautomatic welding and by the machine in automatic welding. The effects of the travel speed are just about similar to the effects of the arc voltage. The penetration is maximum at a certain value and decreases as the arc speed is varied. For a constant given current, slower travel speeds proportionally provide larger bead and higher heat input to the base metal because of the longer heating time. The high input increases the weld penetration and the weld metal deposit per unit length and consequently results in a wider bead contour. If the travel speed is too slow, unusual weld build-up occurs, which causes poor fusion, lower penetration, porosity, slag inclusions and a rough uneven bead [14].
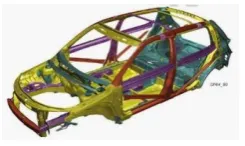
1.5 INTRODUCTION TO CHASSIS
A chassis consists of an internal vehicle frame that supports an artificial object in its construction and use, can also provide protection for some internal parts. An example of a chassis is the under part of a motor vehicle, consisting of the frame (on which the body is mounted). If the running gear such as wheels and transmission, and sometimes even the driver's seat, are included, then the assembly is described as a rolling chassis. [15] Chassis is the base of a vehicle. It consist engine, transmission system, brake system, suspension system, steering system, cooling system, wheels etc.
1.5.1 TYPES OF CHASSIS:
(1) Conventional chassis or frame-full chassis:
In this type of chassis the body is made as a separate unit and then joined with ladder frame. It supports all the systems in a vehicle such as the Engine, Transmission system, Steering system, Suspension system.
Advantage: Higher load capacity and strength
Disadvantage: The body tends to vibrate easily and the overall vehicle handling and refinement is lower.
© 2018, IRJET | Impact Factor value: 6.171 | ISO 9001:2008 Certified Journal | Page 1909 Fig.-3: Conventional Chassis
(2) Non-conventional or frameless chassis
In this type of chassis the ladder frame is absent and the body itself acts as the frame. It supports all the systems in a vehicle such as the Engine, Transmission system, Steering system, Suspension system.
Advantage: Less rattles and squeaks are developed.
Handling is better due to the higher body rigidity and weight.
Disadvantage: The load carrying capacity is lower.
It is not safe in accidental condition. Used mostly in hatchback and sedan cars. [16]
Fig.-4: Non-Conventional Chassis
2. LITERATURE REVIEW
Before starting any work, the literature review of the topic is must, because it helps us in knowing the amount of work that has been done in that topic by the different researchers. The literature of past works is arranged in chronological order, which are:
M. Aghakhani et al. (2011) [1] investigated Parametric Optimization of Gas Metal Arc Welding Process by Taguchi Method on Weld Dilution. In this work Taguchi's method of design of experiments a mathematical model was developed using parameters such as, wire feed rate (W), welding voltage (V), nozzle-to-plate distance (N), welding speed (S) and gas flow rate (G) on weld dilution. After collecting data, signal-to-noise ratios (S/N) were calculated and used in order to obtain the optimum levels for every input parameter.
B. S. Praveen Kumar et al. (2012) [2] have used Optimization of Shielded Metal Arc Welding Parameters for Welding of Pipes by using Taguchi Approach. Design Parameters for Shielded Metal Arc Welding to ensure no leak to occur during the process. On the selected parameters, trails have been conducted as per Taguchi method and fixed the levels for the parameters. Further, for each parameter 3
different levels are fixed, so that the experiment have become 4 parameters (factors) and each with 3 levels.
Ankita Singh et al. (2013) [3] have used the Taguchi’s Method coupled with fuzzy based desirability function approach for the Optimization of bead geometry of submerged arc weld. Fuzzy inference system has been adapted to avoid uncertainly, imprecision and vagueness in experimentation as well as in data analysis by traditional Taguchi based optimization approach. Detailed methodology and unique features of the proposed method has been highlighted through a case study.
Deepak Kumar et al. (2014) [4] optimized the Process Parameters of Gas Metal Arc Welding by Taguchi’s Experiment Design Method. In this work, experiments were carried out on 1018 mild steel plates using gas metal arc welding (GMAW) process. L9 orthogonal array of Taguchi`s experimental design was used for optimization of welding current, voltage and gas flow rate on welded joints. L9 Orthogonal Array was selected to study the relationships between the tensile strength and the three controllable input welding parameters such as voltage, current and gas flow rate.
Prof. S.D. Ambedkar et al. (2015) [5] have described the Parametric Optimization of Gas metal arc welding process by using Taguchi method on stainless steel AISI 410. The present study is to investigate the influence of welding parameters on the penetration. The optimization for Gas metal arc welding process parameters (GMAW) of Martensitic Stainless steel work piece AISI 410 using Taguchi method is done. Sixteen experimental runs (L16) based on an orthogonal array Taguchi method were performed. The ANOVA and signal to noise ratio (S/N ratio) is applied to identify the most significant factor and predicted optimal parameter setting. The Process parameters such as, welding current, wire diameter and welding speed are studied and optimized.
Prashanth Kumar et al. (2015) [6] have presented Parameter Optimization of Gas Metal Arc Welding Using Taguchi Method. Methodology is used to find optimum input variables in GMAW process using taguchi method. The typical process for welding parameters depends upon the ability to measure and control the process variables involved in the welding process.
[image:3.595.101.224.377.450.2]© 2018, IRJET | Impact Factor value: 6.171 | ISO 9001:2008 Certified Journal | Page 1910 L.S. Sutherland et al. (2016) [8] presented the work on
Statistical experimental design techniques to investigate the strength of adhesively bonded T-joints.
M. U. Deshpande et al. (2016) [9] have focused on Optimization of GMAW Process Parameters to Improve the Length of Penetration in EN 10025 S 235 Grade. This work gives the detail influence of welding process parameters such as welding current, welding voltage, wire speed on the penetration in EN10025 S 235 Grade mild steel material. To analyze & optimize the welding parameters & characteristics, analysis of variance, L9 orthogonal array & signal to noise ratio are used. After analysis of penetration in all 9 welded samples, optimize parameters readings verified & found probability value within 0.05. it is found that welding current & welding voltage is major parameters which affects the penetration in welded joints. Better penetration observed is 7.2334 mm at Current 160 A, Voltage 19 V, Wire Speed 12 M/min.
Hitesh Sharma et al. (2017) [10] have discussed the Effect of SAW Parameters on Chromium Element Transfer.)Orthogonal arrays are used for design of experiments after the pilot experiments. In this work the effect of various parameters on chromium element transfer are done. L16 Orthogonal array are used & three factors Current, Voltage, Welding Speed are taken.
Brijesh Sharma et al. (2017) [11] investigated Parametric Optimization of Shielded Metal Arc Welding of Mild Steel (MS) 2062 Using Taguchi Method. In this work of Gas Metal Arc Welding (GMAW) show the current effect, voltage effect, arc length, welding speed and angle of welding on penetration and weld bead width on MS2062. automatic welding are conducted using on L27 orthogonal array for optimization of welding parameters level of current, voltage, speed, angle and electrode gap.
Kumar Rahul Anand et al. (2017) [12] have Investigated Parametric Optimization of Tig Welding on Joint of Stainless Steel (316) & Mild Steel Using Taguchi Technique. In this work the mechanical properties of the joint of austenitic stainless steel (AISI 316) and mild steel welded by TIG welding. By the use of Taguchi method of optimization, various process parameter such as current, voltage and gas flow ratio (GFR) which has influence on tensile strength and hardness of the joint are optimized.
2.1 LITERATURE SUMMARY
According to the survey of the research work, it is found that in most of the cases TIG, MIG, Gas Metal Arc Welding (GMAW), Submerged Arc Welding (SAW), Friction Stir Welding (FSW) etc. are done on different materials. But from all the welding techniques, electric arc welding has greater welding strength. For further checking the parameters selected are satisfactory or not, Taguchi Methodology is adopted and analyzed through Mathematical Modeling.
3. METHODOLOGY USED
Taguchi is a methodology that gives the optimum combination of independent parameter which has a significant role to change the value of dependent parameter. The main objective of the method is to design the best quality product at least cost of manufacturer.
This technique is completely based on statistical concepts. By applying this methods many renowned firms have achieved great success. Taguchi method adopted experimentally to investigate influence of parameters such as electrode diameter, material stress and voltage on the breaking load in chassis. The Taguchi process helps to select or to determine the optimum combination for electrode diameter, material stress and voltage and effect of these parameters on breaking load on chassis during bending. Many researchers developed different mathematical models to optimize these parameters to get maximum breaking load in various processes.
3.1 PROCEDURE OF TAGUCHI PARAMETERS OUTLINE
Step-I: Selection of the Quality Attributes
There are three different quality characteristics in the methodology of Taguchi, such as smaller-the-better, larger the- better, and nominal-the-best. For example, smaller-the- better is considered when measuring consumption of fuel in automobile or roughness in surface finish.
Step–2: Choice of noise factors and control factors
In this, the controllable factors are electrode diameter (D), material (M), and voltage (V) which were selected because these are the factors that affect the breaking load. Since these factors are controllable so they are considered as the controllable factors in the study.
Step-3: Choice of Orthogonal Array
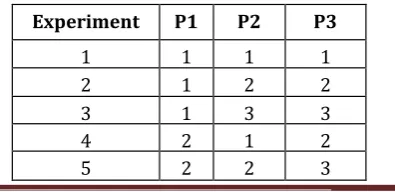
[image:4.595.359.557.683.779.2]Standard Orthogonal Arrays (OA) in the Taguchi parameter design are of 9 basic types. Selection of arrays depends on the degree of freedom of selected parameter. Degree of freedom of all three parameter is 6. An L9 Orthogonal Array was chosen from Appendix B, 2nd edition, 2005, Taguchi Techniques for Quality Engineering, Philip J Ross, Tata McGraw- Hill Publishing Company limited, for this work. Selected array for this work is L9 Orthogonal Array. The layout of this L9 OA is as mentioned in Table below:
Table 2: L9 Orthogonal Array
Experiment P1 P2 P3
1 1 1 1
2 1 2 2
3 1 3 3
4 2 1 2
© 2018, IRJET | Impact Factor value: 6.171 | ISO 9001:2008 Certified Journal | Page 1911
6 2 3 1
7 3 1 3
8 3 2 1
9 3 3 2
Step-4: Leading the experiment
Table 3 illustrates the experimental settings in the study for maximum breaking load. The parameters used in this experiment are electrode diameter (three different diameter), material (three different material) and the voltage (three different voltage).
Step–5: Anticipating the Optimum Performance
Utilizing the previously mentioned data, one could anticipate the optimum combination of electrode diameter, material and voltage for maximum breaking load during bending. With this prediction, one could conclude that which combination will creates the better result. A confirmation of the experimental design was necessary in order to validate the optimum variables combination.
Step-6: Building the design by utilizing a confirmation experiment
The confirmation experiment help to verify our prediction particularly when small fractional factorial experiments are utilized.
4. EXPERIMENTAL SETUP
4.1 Selection of Factors
As the literature suggested, the experimental setup is constructed for the various factors and their values are chosen, by which product quality is affected.
Electrode Diameter
Material selection
Voltage of Current
The factor that considerably contributes to the variation in Quality is selected.
4.1.1 Electrode Diameter
The first parameter is electrode diameter and it has three levels low, medium, high.
D1 = 4 mm
D2= 5 mm
D3 = 6 mm
4.1.2 Material Selection
Material is the main aspect of chassis design. In this experiment three different material is taken which is as follows.
M1 = AISI 1018 Mild/Low Carbon Steel (Yield stress=370 MP)
M2 = AISI 1020 Low Carbon/Low Tensile Steel (Yield stress=450 MP)
M3 = AISI 4130 Alloy Steel (Yield stress=460 MP)
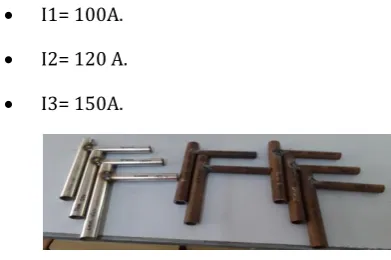
4.1.3 Current
The last parameter is voltage at which welding is done and it has also three levels low, medium, high.
For T- Joint,
I1= 100A.
I2= 120 A.
[image:5.595.91.274.78.142.2] I3= 150A.
Fig.5: Specimen for Bending Test.
4.2 Analysis Layout
On the basis of past experience and literature, process parameters and their levels have been decided. The analyses are to be done in three levels and three controllable factors. These parameters and their values are tabulated in table 3. The Analysis was performed practically. On the basis of Orthogonal array experiments are conducted and breaking load at the bending for different combinations of parameters was observed.
Table 3: Process parameters and their values
S.
No. symbol
Symbol
Particular
Process
Parameter
Levels
Low Mediu m High 1. D Electrode diameter
(mm) 4 5 6
2. M Material AISI
1018 1020 AISI 4130 AISI
[image:5.595.324.520.315.445.2]© 2018, IRJET | Impact Factor value: 6.171 | ISO 9001:2008 Certified Journal | Page 1912 4.3 Assignment of Factors and Interaction
Total Degree of freedom (D.O.F): Every three factors are studied at three levels; therefore each factor has D.O.F. of 2. Since, D.O.F. = number of levels -1.
The degree of freedom for the interaction is computed by multiplying the D.O.F. of each of interacting factors. Thus
D.O.F. for A is 2
D.O.F. for B is 2
D.O.F. for C is 2
Therefore, the total D.O.F
(D.O.F. T) = 6
4.4 Selection of Orthogonal Array
The OA (Orthogonal Array) to be chosen must fulfill the accompanying conditions: Since,
D.O.F. (O.A) chosen D.O.F. required.
Conducted experiments has 6 D.O.F. and thus O.A with 9 or more D.O.F was required, hence an O.A. with at least 9 experiments is to be chosen to estimate the effect of each factor and the desired interaction.
Here, the selected O.A. is L9 from the book of standard orthogonal Arrays. The factors & their selected levels are listed in table 4 for T-joint. The starting levels before conduction the matrix experiments for the 3 factors, identified by electrode diameter, material and voltage of welding.
4.5 Experimental Result
In this research work, the controllable factors taken are Electrode diameter (E), Material (M) and Current of welding (I).
[image:6.595.305.565.76.163.2]Further according to Taguchi parameter design, an important attribute is uncontrollable factors for the analysis. Uncontrollable factors are human error environment condition etc.
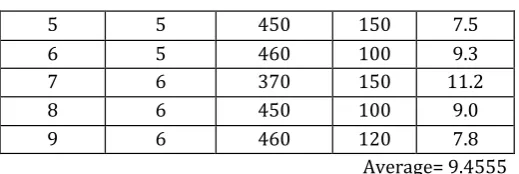
Table 4: Experimental results of T-Joint
Experiment No.
Electrode Diameter
(mm)
Yield Tensile Stress (MPa)
Current
(I)
Breaking Load
(KN)
1 4 370 100 10.0
2 4 450 120 8.4
3 4 460 150 11.4
4 5 370 120 10.5
5 5 450 150 7.5
6 5 460 100 9.3
7 6 370 150 11.2
8 6 450 100 9.0
9 6 460 120 7.8
Average= 9.4555
4.5 Analysis of Means and Response Graph for T-Joint
The analysis of every controllable factor is studied and the main effect of the same is obtained in table 5.1 for T-joint. Mean of breaking load of all experiments with the factor at individual level is equal to main effect of every factor at individual level i.e. at low, medium, high levels.
The main effect of electrode diameter on breaking load at various levels calculated as follows:
D1 = (10+8.4+11.4)/3=9.9333
D2 = (10.5+7.5+9.3)/3=9.1
D3 = (11.2+9.0+7.8)/3=9.3333
The main effect of material on breaking load at various levels are calculated as follows:
M1 = (10+10.5+11.2)/3=10.5666
M2 = (8.4+7.5+9.0)/3=8.3
M3 = (11.4+9.3+7.8)/3=9.5
The main effect of current of welding on breaking load at various levels are calculated as follows:
I1 = (10+9.3+9.0)/3=9.4333
I2 = (8.4+10.5+7.8)/3=8.9
I3 = (11.4+7.5+11.2)/3=10.0333
4.6 Modeling of Parameters
To generalize the results, the modelling of input parameters (electrode diameter, material and current) and output parameter (breaking load) is done using REGRESSION MODELLING and MATLAB Software.
The Parameters under consideration are:
1. Electrode diameter (in mm)
2. Material Yield stress (in MPa)
3. Voltage of Current (in A)
© 2018, IRJET | Impact Factor value: 6.171 | ISO 9001:2008 Certified Journal | Page 1913 of Material (X2) and voltage (X3) has been taken as input
parameter X = [X1, X2, X3]. The breaking load is the function of Electrode diameter, Yield stress of Material and Voltage.
H (Breaking Load) α Electrode diameter * Yield stress of Material * Voltage
Or
H = C0 (electrode dia.) c1 * (Yield stress) c2 * (Voltage) c3
lnH = lnC0 + C1ln (Electrode dia ) * C2 ln (Yield stress) * C3 ln (Voltage)
Where, C0, C1, C2, C3 are constants which are to be determined by Regression Modeling and using MATLAB software. The (Y) output parameter and X = [X1, X2, X3] are converted from actual absolute values to natural logarithms.
The following steps were followed and MATLAB is used.
1. Output Breaking load due to torsion and bending [Y] and inputs [X] were converted in natural log terms.
2. Xt = Transpose of [X] was determined.
3. Xt Transpose of [X] was multiplied with [X] to get the product [Xt X].
4. The inverse of product [Xt X] = [Xt X]-1 was obtained.
5. Xt Transpose of [X] was multiplied with Hardness Y to get the product = [Xt Y].
6. [Xt X] -1 was multiplied with [Xt Y] to obtain the product of [Xt X] -1 and [Xt Y].
7. The final matrices found in the form of;
Finally, after the completion of program and the values of constants found as follows:
Constant C0 = Antilog β0
C1 = β1, C2 = β2, and C3 = β3
5. RESULTS AND DISCUSSION
5.1 Comparative results of T-joint
[image:7.595.309.561.93.517.2]The final comparison of the confirmation for breaking load with values obtained from Taguchi parametric design & actual bending testing of T-joint is in the table 5 below, the comparison is also shown in graph 1 respectively.
Table 5: Mean Response values for breaking load
Symb
ol Controllable Factors
Breaking Load (KN)
L M H
D Electrode Diameter 9.9333 9.1 9.3333
M Material 10.56666 8.3 9.5
I Voltage of Current 9.4333 8.9 10.0333
Fig.6: Mean Response graph for process
parameters
Fig.7: Mean breaking load v/s Mean electrode
diameter graph
Fig.8: Mean breaking load v/s Mean yield strength
graph
[image:7.595.303.551.548.728.2]Fig.9: Mean breaking load v/s Mean voltage graph
Table 6: Comparative Results of Actual and MATLAB
Experiment No.
Electrode Diameter (mm)
Yield Tensile
Stress (MPa)
Current (I)
Breaking Load (KN)
ACTUAL
Breaking Load (KN) MATLAB
1 4 370 100 10.0 10.59
2 4 450 120 8.4 9.24
3 4 460 150 11.4 9.33
4 5 370 120 10.5 10.43
5 5 450 150 7.5 9.14
6 5 460 100 9.3 8.539
7 6 370 150 11.2 10.40
8 6 450 100 9.0 8.428
© 2018, IRJET | Impact Factor value: 6.171 | ISO 9001:2008 Certified Journal | Page 1914 Fig.10: Comparative graph of Actual and MATLAB results
The values obtained for T-joint are:
C0 = Antilog (6.8500) = 943.8809
C1 = -0.1708, C2 = -0.8164, and C3 = 0.1249
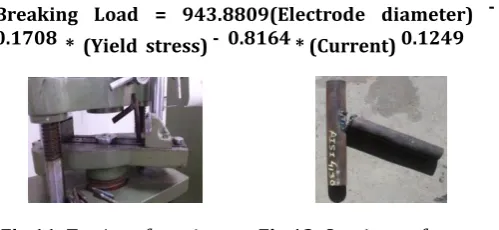
Now the equation is
Breaking Load = 943.8809(Electrode diameter) -0.1708 * (Yield stress) - 0.8164 * (Current) 0.1249
[image:8.595.46.288.68.208.2]Fig.11: Testing of specimen Fig.12: Specimen after test
6. Conclusion
This work has proposed an application of Taguchi method for optimizing the design parameters and indicated that the Taguchi design of experiment approach is an effective way of determining the optimal combination of parameter for great weld-strength for manufacturing the chassis of off road vehicles in an effective and qualitative manner.
The outcome of the calculation and formulation for the optimization by Taguchi method, are summarized below:
Table 7: Actual and MATLAB (Optimum breaking load)
Results ACTUAL Breaking Load (KN)
Breaking Load by MATLAB (Mathematical
formula)
Level D1+M1+I3 D1+M1+I3
Breaking Load
(KN) 10.7 11.1480
Fig.13: Comparative result graph between Actual and MATLAB
From response table and graph observational findings are illustrated as following.
1. Level I for Electrode Diameter = Maximum Breaking Load, indicate as the optimum situation in terms of mean value.
2. Level I for Material = Maximum Breaking Load, indicate as the optimum situation in terms of mean value.
3. Level III for Current = Maximum Breaking Load, indicate as the optimum situation in terms of mean value
The result obtained from the confirmation experiments reveals that the Taguchi method has provided the good prediction for the response value by utilization the Mathematical regression modeling. Researcher has find out the empirical formula, which gives the relation between these three factors i.e. Electrode Diameter, Material selection and Current. By the application of this formula, the value of Breaking Load at the time of bending at any given combination between given range can be found out.
REFERENCES
[1] M. Aghakhani et al., “Parametric Optimization of Gas Metal Arc Welding process by Taguchi Method on Weld Dilution”, International Journal of Modeling and Optimization, vol. 3 (2011), pp. 216-220.
[2] B. S. Praveen Kumar et al., “Optimization of Shielded Metal Arc Welding Parameters for Welding of Pipes by using Taguchi Approach”, International Journal of Engineering Science and Technology, Vol. 4 (2012), pp. 2083-2088.
[3] Ankita Singh et al., “Optimization of Bead geometry of submerged arc weld using fuzzy based desirability function approach”, journal of Intel Manufacturing, Vol. 24 (2013), pp. 35-44.
[image:8.595.39.289.331.446.2]© 2018, IRJET | Impact Factor value: 6.171 | ISO 9001:2008 Certified Journal | Page 1915 [5] Prof. S. D. Ambedkar et al., “Parametric Optimization of
Gas metal arc welding process by using Taguchi method on stainless steel AISI 410”, international journal of modern engineering and emerging technology, Vol. 3 (2015), pp.1-9.
[6] Prashanth Kumar et al., “Parameter Optimization of Gas Metal Arc Welding Using Taguchi Method”, International Journal of Research in Applied Science & Engineering Technology, Vol. 3 (2015), pp. 512-518.
[7] Vibhor Pandhare et al., “Determination of significant factors affecting the bending strength of weld joint prepared by gas metal arc welding”, International journal of Mechanical Engineering Research and Technology, Vol. 2 (2016), pp.1-10.
[8] L.S. Sutherland et al., “Statistical experimental design techniques to investigate the strength of adhesively bonded T-joints”, Composite Structure (2016), vol. 17(10), pp. 68-74.
[9] M.U. Deshpande et al., “On Optimization of GMAW Process Parameters to Improve the Length of Penetration in EN 10025 S 235 Grade”, journal of Welding and Joining, Vol. 35 (2017), pp.74-78.
[10] Hitesh Sharma et al., “Effect of SAW Parameters on Chromium Element Transfer”, International Journal of Multidisciplinary and Current Research, Vol. 5 (2017), pp.365-370.
[11] Brijesh Sharma et al., “Parametric Optimization of Shielded Metal Arc Welding of Mild Steel (MS) 2062 Using Taguchi Method”, Journal of Advanced Research of Mechanical Engineering & Technology, Vol. 3 (2017), pp. 11-18.
[12] Kumar Rahul Anand et al., “Parametric Optimization of Tig Welding On Joint of Stainless Steel (316) & Mild Steel Using Taguchi Technique”, International Research Journal of Engineering & Technology, Vol. 4 (2017), pp. 365-370.
[13] http://www.contactquest.com/services/welding-consultancy/
[14] Ador Welding Limited, “Modern Arc Welding Technology”, Oxford &IBH Publishing Co. Pvt. Ltd.
[15] https://en.wikipedia.org/wiki/Chassis.