© 2018, IRJET | Impact Factor value: 6.171 | ISO 9001:2008 Certified Journal | Page 2308
AUTOMATIC RBC AND WBC COUNTING USING WATERSHED
SEGMENTATION ALGORITHM
1
ASMA BANU,
2MD.SHOAIBUDDIN MADNI
1
PG student, Navodaya, Institute of Technology, Raichur-584101
2
Asst. Prof. Dept. of ECE, Navodaya, Institute of Technology, Raichur-584101
---***---Abstract -
Medical imaging brings up the methods and techniques which enable us to take and analyze images of different disease in human body parts for diagnosis purpose. The old conventional methods used in hospital laboratories to detect and diagnose becomes problem as they are very slow and they had greater change of error in it but medical imaging through different image processing techniques opened new, fast and cost -effective ways to detect and recognize different diseases and make it easy to examine and diagnose the actual problem. Now a day s’ researches are working on different computer vision applications for healthy industry. Such as image segmentation of kidney from ultrasound images, Cancer Detection Using pattern Reorganization Technique, segmentation of brain images, etc. Fast and cost effective blood cell counting has major importance in the medical world. The old conventional methods of blood cell counting under the microscope render unreliable and unacceptable amount of strain on the clinical laboratory technicians. Even so there are latest hardware solutions such as the HEMATOLOGY analyzer, but they are widely unavailable and expensive machines to provide such an expensive solution of blood cell counting in every hospital laboratory. As a solution regarding this problem this research based proposed a fast and cost effective software-based alternative method to count accurate blood cells.Key Words: watershed, acquisition, segmentation, magnitude calculation, filtering enhancing, Erosion of an
image, Dilation of an image,
1. INTRODUCTION
Image processing techniques are widely used in the domain of medical sciences for detecting various diseases, infections, tumors, cell abnormalities and various cancers. Detecting and curing a disease on time is very important in the field of medicine for protecting and saving human life. Mostly in case of high severity diseases were the mortality are more, the waiting time of patient for their reports such as blood test; Magnetic resonance imaging (MRI) is more. The time taken for generation of any of the test is from 1-10 days. In high risk disease like hepatitis B, it is recommended that the patient waiting time should be as less as possible and the treatment should be started immediately. The current system used by the pathologist for identification of blood parameter is costly and in the time involved in generation of the reports is also more sometime leading to loss of patience life. Also the pathological tests are expensive, which are sometime are not affordable by the patience. This project deals with an image processing technique used for detecting the classification of blood cells such as White Blood Cell (WBC) and Red Blood Cell (RBC). The proposed technique helps in segregating the blood cells in different categories based on the form factor.
1.1 Existing System
© 2018, IRJET | Impact Factor value: 6.171 | ISO 9001:2008 Certified Journal | Page 2309
[image:2.595.217.381.135.273.2]PROCEDURE VIEW OF OLD CONVENTATION BLOOD CELL COUNTING METHOD
[image:2.595.226.372.320.404.2]Fig -1.1:Taking blood from human body.
Fig-1.2: Blood pipe pet
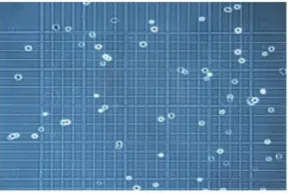
Fig-1.3: Haemocytometer grid.
[image:2.595.234.361.423.581.2] [image:2.595.226.371.618.715.2]© 2018, IRJET | Impact Factor value: 6.171 | ISO 9001:2008 Certified Journal | Page 2310
Fig-1.5: Microscopic view. 2 Proposed System
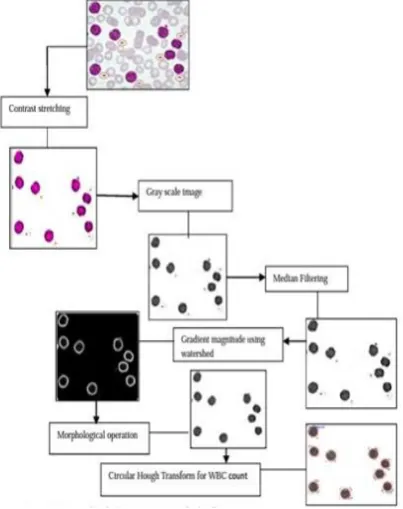
The overall methodology of image processing techniques in the proposed method is described in the figure below. First of all an input image of already prepared slide is taken from the camera attached to the microscope, then through different image processing techniques and image filters the extra unwanted information is removed from the input image. After removal of noise the area of the interest that is the area where we need to count the blood cells are cropped from the image and by labeling algorithm of connected pixels blood cell can be count to put in different equations to abstained cell count report.
Fig-2: Proposed method diagram.
Advantages
Highly efficient and user friendly design.
Easy to design.
Low power consumption.
Reduces deployment of man power.
[image:3.595.176.378.376.631.2]© 2018, IRJET | Impact Factor value: 6.171 | ISO 9001:2008 Certified Journal | Page 2311
3. DESIGN AND ALGORITHMS
3.1 Watershed segmentation algorithm
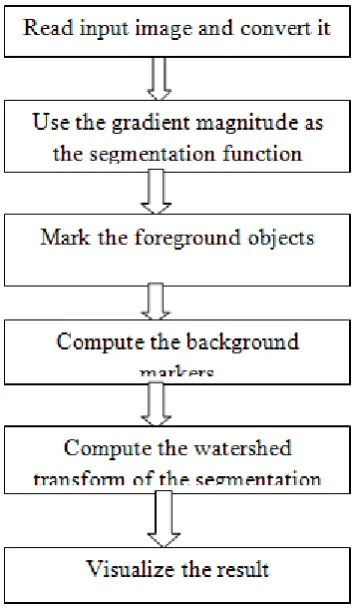
[image:4.595.197.374.208.514.2]Steps for counting RBC & WBC cell counting using watershed algorithm are as follows:-
Fig-3.2: Flow diagram for watershed algorithm
Step1:-Read the color Image and convert it to gray scale.
Step2:- Use the gradient magnitude as the segmentation function and also Sobel edge masks, imfilter () and some arithmetic to compute the gradient magnitude.
Step3:- Mark the foreground objects a variety of procedures could be applied here to find the foreground markers, which must be connected blobs of pixels inside each of the foreground objects. In this example you'll use morphological techniques called "opening-by-reconstruction" and "closing-by-reconstruction" to "clean" up the image. These operations will create flat maxima inside each object that can be located using imregionalmax ().
© 2018, IRJET | Impact Factor value: 6.171 | ISO 9001:2008 Certified Journal | Page 2312
Step5:- Compute the watershed transforms of the segmentation function the function imimposemin ( ) can be used to modify an image so that it has regional minima only in certain desired locations. Here you can use imimposemin ( ) to modify the gradient magnitude image so that its only regional minima occur at foreground and background marker pixels. Finally we are ready to compute the watershed-based segmentation.
Step6:- One visualization technique is to superimpose the foreground markers, background markers, and segmented object boundaries on the original image. You can use dilation as needed to make certain aspects, such as the object boundaries, more visible. Object boundaries are located where L = 0. This visualization illustrates how the locations of the foreground and background markers affect the result. In a couple of locations, partially occluded darker objects
3. Simulation Results
The system has implemented the segmentation part and after testing this system it is concluded that, it is more timely efficient than the existing systems. It is reliable and cost effective than automated method. The aim of this system is to provide complete automatic blood cell count, which has been achieved by using the powerful Image processing technique.This system is more efficient in reducing the valuable time than manual system. The system is user friendly so that the pathologist can observe the blood cell sample image in different views. Also pathologist can get the result of blood cell test within 20 seconds to 1 min. as tested.
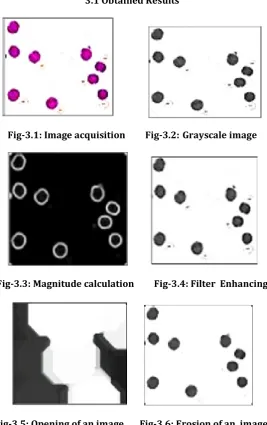
3.1 Obtained Results
Fig-3.1: Image acquisition Fig-3.2: Grayscale image
Fig-3.3: Magnitude calculation Fig-3.4: Filter Enhancing
[image:5.595.165.433.334.760.2]
© 2018, IRJET | Impact Factor value: 6.171 | ISO 9001:2008 Certified Journal | Page 2313
Fig-3.7: Closing of an image. Fig-3.8: Dilation of an image. Fig-3.9: Output Image.
4 Overall results
Below graphical representing in BLUE graph shows that manual way of blood cell counting has greater chance of error in it while RED graph of our proposed method cell counting gives accurate result.
0 2 4 6
BLUE RED
Chart-1: Graph representing manual and proposed system.
4.2 Verifying results
We had been collected some samples for experiments a finally tested these samples by all method of cell counting including our proposed method and we have found that our results are 95 plus % accurate.
Chart-2: Sample result in graph.
1) MANUAL COUNTING= 10.2K Per micro liter 2) Hematology analyzer=11.4k per micro liter
© 2018, IRJET | Impact Factor value: 6.171 | ISO 9001:2008 Certified Journal | Page 2314
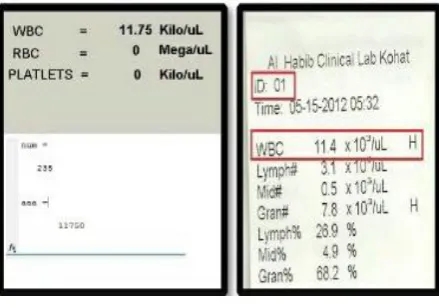
[image:7.595.188.408.133.287.2]4.3 Print of results by two methods
Fig 4.3 print of results by two methods
From these results we have seen that the proposed method is working and results very close to the counting results by hematology analyzer.
5. CONCLUSIONS
Calculate the blood cells using the manual method; the procedure takes nearly one hour to do so. Even now a days, if the automatic cell counter calculates irregular amount of cells in patience blood, the doctor counts with the manual method to analyze the count. Using the image processing method to calculate the blood cell count helps to do it faster within a fraction of few seconds. In this project we have taken images of 8 patients, each 4 images to calculate WBC and RBC of each patient. The average time required and the average accuracy of the proposed system we got is 14.43 seconds and 94.58%. This shows the proposed system calculate the results fast and even more accurate than the manual method.
REFERENCES
[1] Lehmann T.M., Wein B., Dahmen J., and Vogelsang F. &Kohnen M.: Content based imageretrieval in medical applications: a novel multistep approach. International society for optical Engineering (SPIE), 3972, pp.312-320. (2000).
[2] Dwi Anoragaingrum: self-segmentation with median filter and mathematical morphology operation, proceeding of the IEEE 10th international conference on image analysis & processing (ICIAP), pp.1043-1046 (1999).
[3] KengWuetal: Live cell image segmentation, IEEE Trans on Biomedical Engineering, 42(1), pp.1-12 (1995).
[4] Mark B. Jeacocke, Brain C. Lovell: A multi-resolution algorithm for cytological image segmentation, The second Australian & New Zealand conference on intelligent information systems, 322-326 (1994).
[5] Choi H, Baraniuk R., Multiscale: Image segmentation using wavelet-Domian hidden markov models, IEEE transaction on Image Processing, 10 (9), pp.1309-1321 (2001).
[6] H Elaine N. Marieb (2006): Essentials of Human Anatomy and physiology, 8th ed. Pearson Benjamin Cummings.
[7] abdulnasir,A.S.,Mustafa, N., MohdNasir, N.F.,”Application of thresholding technique in determining ratio of blood cells for leukemiadetection”,proceeding of the international conference on man machine systems, 11-13 0ctober 2009.