A Monthly Double-Blind Peer Reviewed Refereed Open Access International e-Journal - Included in the International Serial Directories
International Research Journal of Natural and Applied Sciences (IRJNAS)
Website: www.aarf.asia. Email: [email protected] , [email protected] Page 98
STATISTICAL TREND AND SPATIAL PATTERNS OF URBANIZATION IN NEPAL
Basanta Dhakal
Associate Professor
Tribhuvan University, Nepal Commerce Campus, Kathmandu, Nepal
ABSTRACT
Urbanization is going to be a significant in the years to come in Nepal. The rapid increase in
number of economically active population in the rural area, their improved literacy status and
aspiration for employment in the non-agricultural sector will induce urbanization. The main aim
of this paper is to study the urbanization trend in Nepal and to find out the current status of
urban population on the basis of development and ecological region. It is found that 54% of
total urban people reside in hilly region and 50.24% of them in central development region and
the urban population is increased by 7, 10,300 per census year. This study expects that the
findings of this paper may facilitate planners and decision makers for formulating policy
regarding economic, social and political decision.
Keywords: Population Density, Post Hoc Analysis, Statistical Trend.
Introduction
Urbanization is the process by which large numbers of people become permanently concentrated
in relatively small areas for searching opportunities and facilities. It began during the industrial
revolution (1760-1840) when workers moved towards manufacturing hubs in cities to obtain jobs
in factories as agricultural jobs became less common. The rural to urban migration also means
people moving from rural to urban areas. In this process, the number of people living in cities
increase compared with the number of people living in rural areas. Natural increase of
A Monthly Double-Blind Peer Reviewed Refereed Open Access International e-Journal - Included in the International Serial Directories
International Research Journal of Natural and Applied Sciences (IRJNAS)
Website: www.aarf.asia. Email: [email protected] , [email protected] Page 99
areas. This scenario, however, rarely occurs. A country is considered to be urbanized when over
50 percent of its population lives in the urban areas.
An Urban area is spatial concentration of people who are in non-agricultural activities. The
essential characteristic is that urban means non-agricultural. Urban can also be defined as a fairly
complex concept. Criteria used to define to urban can include population size, space, density, and
economic organization. Usually, urban is simply defined by some base line- size, like 20,000
people; facilities of communication, transport, health, playground etc. Anyway, this definition
varies between regions and cities. The term ‘urban’ relates to towns and cities, while
urbanization refers to the process of becoming urban. In general usage, the term urbanization
refers to the relative concentration of a territory’s population in town and cities. It is expressed as
the proportion of population living within designated urban areas of a specified territory.
Urbanization, however, is not a recent phenomenon. It dates to long time back in the past-
‘Kautilya Arthashastra’ , a fourth century BC document etc are full of dos and don’ts about the
cities. The more striking is the suggestion to create a new satellite city once the population of the
mother city exceeds around 10,000. Much of our current city problems have surfaced because of
the disregard shown to this age old principle. We entertain massive influx pouring into the cities,
and the problems arise after the infrastructure cannot cater to the rise in population (Pokharel,
2013).
There is no universal agreement on definition of urban place. Despite various cut-off points,
there is a general practice that statements of 20,000 or more people are usually considered as
urban places. It is a function of (i) population size,(ii) space (land area),(iii) ratio of population to
space, and economic and social organization (Subedi,2010:12). The analysis of urbanization and
urban growth in Nepal is confounded by definitional inconsistencies both over the time and
space. Nepal’s level of urbanization is low and the country falls among one of the least urbanized
countries of the world. In Nepal, usually, the population censuses report population living in
A Monthly Double-Blind Peer Reviewed Refereed Open Access International e-Journal - Included in the International Serial Directories
International Research Journal of Natural and Applied Sciences (IRJNAS)
Website: www.aarf.asia. Email: [email protected] , [email protected] Page 100
The latest legal instruments i.e. Local Self-Governance Act 1999 and Municipality Act 1992,
categorized the urban area on the basis of geographical structure, population size, annual revenue
and level of infrastructure facilities. According to it, more than 300,000 population and NRs 400
million annual revenue must be necessary for metropolitan city; more than 100,000 population
and NRs 100 million annual revenue must be necessary for sub-metropolitan city and more than
10 thousand population and NRs 500,000 annual revenue must be necessary for municipality in
the mountainous and hilly regions, but it must be more than 20 thousand and NRs 5 million
annual revenue for terai region. The requirements for hill and mountain are lower than that of
terai. On the basis of Local Self- Governance Act 1999, there is 1 metropolitan city-Kathmandu;
sub-metropolitan cities- Lalitpur, Biratnagar, Birgunj and Pokhara ; and others 53 municipalities
are distributed in different parts of the country. People move to the cities for better facilities but
overpopulated urban settlements have created their own problems.
Most of the people have been residing in rural areas of Nepal, but its history of urbanization is
too long. The urbanization process of Nepal started before the unification of Nepal, especially in
the Kathmandu valley. At that time, Kathmandu Valley became a transit point of Indo-china
trade. In the decade of 1960s, India expanded the transport facilities inside the country near the
border area of Nepal; it affected the settlements of Nepalese villages like Biratnagar, Birgunj,
Nepalgunj, Mahendranagar etc. Nowadays, these places are main city centers of Nepal. After the
completion of East-West Highway, people were migrated from hill regions to road-side areas of
country which played the effective role in the development process of urbanization of Nepal; it
affected the Nepalese villages like Itahari, Hetauda, Bharatpur, Butwal etc. Similarly the Maoist
Insurgency and Madesh Movement also affected the process of urbanization. Due to these facts,
the elites moved nearby cities and head quarters leading to the urbanization process to some
extent.
In this respect, it needs to study the present urbanization trend of Nepal, which may help to
planners for making policies regarding economic, social and political decision. In this context,
this paper attempts to investigate the urbanization trend of Nepal on the basis of development
A Monthly Double-Blind Peer Reviewed Refereed Open Access International e-Journal - Included in the International Serial Directories
International Research Journal of Natural and Applied Sciences (IRJNAS)
Website: www.aarf.asia. Email: [email protected] , [email protected] Page 101
Materials and Methods
All analysis and discussion have been based on published sources of secondary data such as
National Population and Housing Census 2011, Population Census 2001, Population Monograph
1995 & 2003, Statistical Pocket Book 2002, Nepal in Figure 2012, National Demographic Health
Survey 2011, and Preliminary Results of National Population Census 2011. Urban population is
the main variable of this study. Some descriptive Statistics such as mean, standard deviation,
coefficient of variation, percentage, bar diagram and pie diagram are used to analyze trend and
pattern of urbanization of Nepal. The inferential statistics like One Way Analysis of Variance
and Post Hoc Analysis are used to test whether the mean urban population differs among the five
development regions or three ecological belts. Trend analysis by least square method is used to
analyze the trend of urban population and centers.
Results and Discussions
Nepal government started to take statistics of urban population from the census year 1952/54 and
defined the urban area where as more than 5000 population are residing and the facilities like
transport, road, communication, school, college, factory, market, court, administrative office etc
provided to the people. The following table shows the urban population, percentage change of
urban population and number of urban areas from census year 1952/54 to 2011.
Table 1: Urban Population in Nepal
Census Year
Number of urban center
Urban population (000)
Percentage change
Share of urban population (%)
1952/54 10 238,275 - 2.9
1961 16 336,222 42.5 3.6
1971 16 461,938 37.4 4.0
1981 23 956,721 107.1 6.4
1991 33 1,695,719 77.2 9.2
2001 58 3,227,879 90.4 13.9
2011 58 4,523,820 40.18 17
A Monthly Double-Blind Peer Reviewed Refereed Open Access International e-Journal - Included in the International Serial Directories
International Research Journal of Natural and Applied Sciences (IRJNAS)
Website: www.aarf.asia. Email: [email protected] , [email protected] Page 102
Table 1 shows that the pattern of growth of urban places along with population since 1952/54
population census. Number of urban places has increased from 10 in 1952/54 to 58 in 2011.
Increase in urban population between censuses has been different over the years. Increase was
the highest (107%) during the period of 1971 and 1981, which decreased 77% during the period
1981 to 1991. In other words, tempo of urbanization slowed down during the period between
1981 and 1991 but this tempo again rose to 90 % during the period 1991 to 2001. The total
population living in ten urban areas was only 238,275 by then which means only 2.9 percent
population in the country were in urban areas. By 2011, the proportion living in designated urban
areas reached 17 percent. Between 1952/54 and 2011, the urban population size has increased by
19.17 times where in terms of urban population as percent of total population increased by nearly
sixth fold. Similarly, the total population size of urban population has reached 4.5 million. The
trend line equation is Yc = 1634.014+710.3X, which the line of best fit of the data for urban
population. So the urban population is increased by 710.3(000) per census year. The line of best
fit for trend of urban center is Yc= 30.57 +8.75X, so that the urban center is increased within the
[image:5.612.85.430.418.536.2]limit of 8 to 9 during a census year.
Figure 1: Trend of Urban Population
The trend of urban population has taken high tempo from the census 1971. In 1980, Nepal
government divided whole Nepal into 5 development administrative regions like eastern, central,
western, mid-western and far-western regions. The following table shows the trend of urban
population on the basis of development region from the census 1981 to 2011.
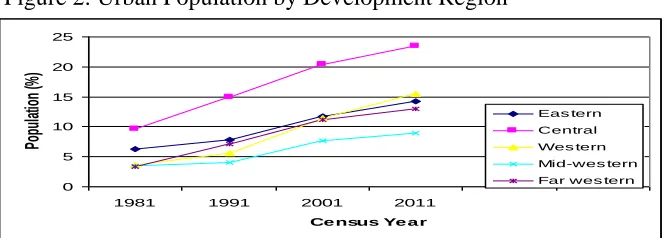
Table 2: Urban Population by Development Region (%)
Census Year Eastern Central Western Mid-western Far-western
1981 6.3 9.6 3.6 3.5 3.4
0 500 1000 1500 2000 2500 3000 3500 4000 4500 5000
1952
/54 1961 1971 1981 1991 2001 2011
Ce nsus Ye a r
Pop
ul
ati
on
A Monthly Double-Blind Peer Reviewed Refereed Open Access International e-Journal - Included in the International Serial Directories
International Research Journal of Natural and Applied Sciences (IRJNAS)
Website: www.aarf.asia. Email: [email protected] , [email protected] Page 103
1991 7.8 14.9 5.6 4.1 7.1
2001 11.7 20.4 11.4 7.7 11.2
2011 14.3 23.5 15.5 9.0 13.0
Mean 10.03 17.10 9.03 6.08 8.68
S.D. 3.65 6.14 5.44 2.70 4.30
C.V.(%) 36.4 35.90 60.28 44.45 49.57
Source: CBS (2003), CBS (2011).
Table 2 shows that central development region has the highest population growth in comparison
to that of other regions. Similarly it has greater consistency of growth of urban population while
western development region has greater variability of it, which demonstrates the regional
inequality of growth of urban centers in Nepal. There is enough evidence to infer that means of
urban population differ among the five development regions (One way ANOVA, p-value (0.043)
< α (0.05), thus rejecting H0). Post Hoc analysis clearly shows that there is significant difference of
average value of population between central development region and mid-western development
region (p=0.041).
Figure 2: Urban Population by Development Region
Figure 2 shows that the increasing trend of urban population is the highest in central development region and lowest in mid-western region.
Ecologically, Nepal is divided into three regions, running east to west. They are the Mountain,
the Hill and the Terai. The following table shows the trend of urban population on the basis of
ecological belts from the census 1981 to 2011.
Table 3: Urban population by Ecological Region (%)
Census Year Mountain Hill Terai
0 5 10 15 20 25
1981 1991 2001 2011
Ce nsus Ye a r
Po
pu
la
tio
n
(%
)
Eas tern
Central Wes tern
[image:6.612.76.410.388.507.2]A Monthly Double-Blind Peer Reviewed Refereed Open Access International e-Journal - Included in the International Serial Directories
International Research Journal of Natural and Applied Sciences (IRJNAS)
Website: www.aarf.asia. Email: [email protected] , [email protected] Page 104
1981 - 6.9 7.0
1991 - 10.3 9.6
2001 2.6 16.7 13.1
2011 2.8 21.7 15.0
Mean 2.7 13.9 11.75
S.D. 0.14 6.60 3.57
C.V. 5.19 47.48 30.38
Source:CBS (2003), CBS (2011).
Table 3 shows that hilly region has the highest population growth in comparison to other regions.
Similarly, it has greater variability of growth of urban population while mountain region has
lower variability of it. There is enough evidence to infer that means of urban population differ
among the three ecological regions (One way ANOVA, p-value (0.007) < α (0.05), thus rejecting
H0). Post Hoc analysis clearly shows that there is significant difference of average population in
[image:7.612.75.414.384.493.2]mountain and hilly region (p=0.009) and between mountain and terai region (p=0.036).
Figure 3: Urban Population by Geographical Region (%)
Figure 3 shows that the increasing trend of urban population is the highest in hilly region and the lowest in mountain region.
Current Scenario
There are 14 (24.14%) urban centers in eastern development region, 20 (34.48%) in central region, 12(20.69%) in western region and 6 (10.34 %) in each mid-western and far western region. The following table shows the current population, area and population density of urban centers on the basis of development region.
Table 4:Current Urban Population by Development Zone
Development Urban population Area of Urban center Population 0
5 10 15 20 25
1981 1991 2001 2011
Ce nsus Ye a r
Pop
ul
at
ion Mountain
Hill
A Monthly Double-Blind Peer Reviewed Refereed Open Access International e-Journal - Included in the International Serial Directories
International Research Journal of Natural and Applied Sciences (IRJNAS)
Website: www.aarf.asia. Email: [email protected] , [email protected] Page 105
Region Number Percent Square km Percent density per sq.km
Eastern 829,807 18.34 905 27.63 917
Central 2,272,826 50.24 810 24.73 2,807
Western 764,841 16.90 575 17.55 1,330
Mid western 322,474 7.13 376 11.47 857
Far western 333,872 7.38 610 18.62 547
Nepal 4,523,820 100 3,276 100 1,381
Source: Statistical Bulletin 2011/12,Vol.105,No.1
Table 4 shows that 50.24 % of total urban people live in central region; similarly the figures
followed as 18.34% in eastern region, 16.90 % in western region, 7.13 % in mid-western region
and 7.38 % in far western region. The area of urban center of eastern, central, western, mid-
western and far- western are 27.63%, 24.73%, 17.55 %, 11.47 % and 18.62 % respectively of the
total urban area of Nepal. The population density of eastern, central, western, mid-western and
far-western are 917/ sq.km, 2807/ sq.km, 1330/ sq.km, 857/ sq. km, 547/ sq.km respectively. The
area of urban center is the maximum in eastern development region and least in mid-western
region but population density is the maximum in central region and least in far-western region.
The population density of central region and western development region is greater than the
eastern region.
Figure 4:Current Urban Population by Development Zone
Figure 4 shows that amongst the five development regions, the maximum urban people reside in
central development region and minimum urban people reside in mid-western development
region.
0 500000 1000000 1500000 2000000 2500000
Eastern Central Western Mid
western Far western Development Region
Pop
ul
at
ion
[image:8.612.85.417.473.597.2]A Monthly Double-Blind Peer Reviewed Refereed Open Access International e-Journal - Included in the International Serial Directories
International Research Journal of Natural and Applied Sciences (IRJNAS)
Website: www.aarf.asia. Email: [email protected] , [email protected] Page 106
There are 3 (5.17 %) urban centers in mountain, 23 (39.66 %) in hills, 25 (43.10 %) in terai and 7
(12.07 %) in inner terai. The following table gives the current population, area and population
density of urban centers on the basis of ecological belt.
Table 5:CurrentUrban Population by Ecological Belt
Ecological Belt
Urban population Area of urban center
Population density
per sq.km Number Percent Square
km
percent
Mountain 49,995 1.10 156 4.76 320
Hill 2,468,110 54.56 1,598 48.78 1,544 Terai 2,005,715 44.34 1,522 46.46 1,318
Total 4,523,820 100 3,276 100 1,381
Source: Statistical Bulletin 2011/12,Vol.105,No.1
Table 5 shows that 54.56 % of urban people reside in hilly region; it is followed by 1.10% in
mountain region and 44.34 % in terai region. The area of urban center of mountain, hill and terai
are 4.76%, 48.78% and 46.46% respectively of total urban area of Nepal. The population density
of mountain, hill and terai are 320/sq.km, 1544/sq.km and 1318/sq.km respectively. It indicates
[image:9.612.73.365.456.554.2]that mountain region is still too far from the urban facilities in comparison to hill and terai.
Figure 5: Current Urban Population in Ecological Belt
Figure 5 shows that amongst the three ecological regions, the maximum urban people reside in
hilly region and minimum urban people reside in mountain region. The top ten populated urban
centers of Nepal are Kathamandu, Pokhara, Lalitpur,Biratnagar,Bharatpur,Birgunj, Butwal
,Dharan, Bhimdutta and Dhangadhi respectively in descending order. According to National
Population and Housing Census 2011, there are 4 urban centers which have less than 20
thousand populations, the population of 28 urban centers lies between 20 to 50 thousand,
Urban population
A Monthly Double-Blind Peer Reviewed Refereed Open Access International e-Journal - Included in the International Serial Directories
International Research Journal of Natural and Applied Sciences (IRJNAS)
Website: www.aarf.asia. Email: [email protected] , [email protected] Page 107
population of 16 urban centers lies 50 to 100 thousand and 10 urban centers having more than
100 thousand populations. Mean urban population is 75,161, median urban population is 42,826
and modal urban population is 28,422. It indicates that the population of maximum urban centers
is less than the average population of urban center. Coefficient of variation (172.04%) signifies
the maximum variability of urban population within the 58 urban centers.
There is 1 metropolitan city, 4 sub-metropolitan city 53 municipalities in Nepal. The following
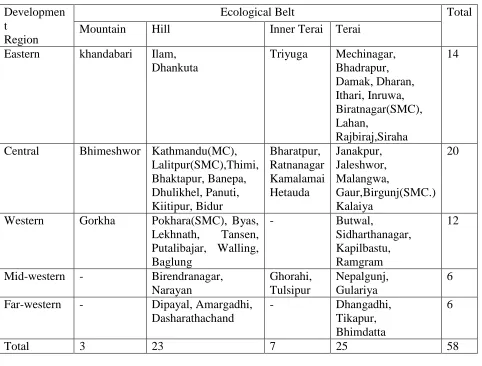
[image:10.612.68.550.304.670.2]table shows the name of urban centers according to ecological and development region.
Table 6: Name ofUrban Centers on the basis of Ecological and Development Region
Source: NPHC 2011, Vol.02. Developmen
t Region
Ecological Belt Total
Mountain Hill Inner Terai Terai
Eastern khandabari Ilam, Dhankuta
Triyuga Mechinagar, Bhadrapur, Damak, Dharan, Ithari, Inruwa, Biratnagar(SMC), Lahan, Rajbiraj,Siraha 14
Central Bhimeshwor Kathmandu(MC), Lalitpur(SMC),Thimi, Bhaktapur, Banepa, Dhulikhel, Panuti, Kiitipur, Bidur Bharatpur, Ratnanagar Kamalamai Hetauda Janakpur, Jaleshwor, Malangwa, Gaur,Birgunj(SMC.) Kalaiya 20
Western Gorkha Pokhara(SMC), Byas, Lekhnath, Tansen, Putalibajar, Walling, Baglung
- Butwal,
Sidharthanagar, Kapilbastu, Ramgram
12
Mid-western - Birendranagar, Narayan Ghorahi, Tulsipur Nepalgunj, Gulariya 6
Far-western - Dipayal, Amargadhi, Dasharathachand
- Dhangadhi,
Tikapur, Bhimdatta
6
A Monthly Double-Blind Peer Reviewed Refereed Open Access International e-Journal - Included in the International Serial Directories
International Research Journal of Natural and Applied Sciences (IRJNAS)
Website: www.aarf.asia. Email: [email protected] , [email protected] Page 108
There are three municipalities in three districts like: Jhapa (Mechinagar, Bhadrapur &
Damak);Sunsary (Dharan, Itahari & Inruwa) and Kavre (Banepa , Dhulikhel & Panauti).
Similarly there are 2 municipalities in the 9 districts like: Siraha (Lahan & Siraha),Kathmandu
(Kritipur & Ktm.M.C.), Bhaktapur (Thimi & Bhaktapur), Chitwan (Bharatpur &
Ratnanagar),Syangja( Putalibajar & Waling),Kaski ( Lekhnath, Pokhara S.M.C), Rupandehi
(Butwal & Siddharthanagar), Dang (Tulsipur & Ghorahi) and Kailali (Dhangadhi and Tikapur ) .
There are 31 districts which have one municipality like Ilam (Ilam Municipality), Morang
(Biratnagar S.M.C.), Dhankuta (Dhankuta Municipality), Sankhuwasawa (Khandbari), Udayapur
(Triyuga), Saptari (Rajbiraj), Dhanusa (Janakpur), Mahottari (Jaleshwor), Sarlahi (Malangwa),
Sindhuli (Kamalamai), Dolakha (Bhimeshwor), Laitpur (Lalitpur S.M.C.), Nuwakot (Bidur),
Makwanpur (Hetauda), Rautahat (Gaur), Bara (Kalaiya), Parsa (Birgunj S.M.C.), Gorkha
(Gorkha Municipality), Tanahu (Byas), Baglung (Baglung Municipalty), Palpa (Tansen),
Nawalparasi (Ramgram), Kapilvastu (Kapilvastu Municipalty), Banke (Nepalgunj), Bardiya
(Gularia),Surkhet (Birendranagar), Dailekh (Narayan), Doti (Dipayal), Kanchanpur (Bhimdatta),
Dadeldhura (Amargadhi), Baitadi (Dasharathchanda). Among 75 districts of the country, only 43
districts have designated urban areas i.e. there are still 32 districts which are far from the urban
facilities. Although Nepal government has given the clear-cut definition of urban center, it has
not implemented in the real ground because some urban places like Bharatpur, Butwal, Dharan,
Bhimdutta etc have sufficient criteria for sub-metropolitan city but they are still conducting
under the criteria of municipality.
Conclusion
Amongst the five development regions, the central development region has the largest share of
urban population as well as largest number of urban places. Among ecological regions, the hill
and terai are the most urbanized regions while the mountain region is the least urbanized. The
south-bound and Kathmandu valley centered urbanization demonstrates the regional inequality in
distribution and growth of urban centers. Similarly, significant proportions of its population are
living in the urban area of Morang, Sunsari, Kathmandu, Lalitpur, Bhaktapur, Parsa, Kaski,
Chitwan, Rupandehi, Kailali and Kanchanpur. Urbanization is not a problem itself; it is the
A Monthly Double-Blind Peer Reviewed Refereed Open Access International e-Journal - Included in the International Serial Directories
International Research Journal of Natural and Applied Sciences (IRJNAS)
Website: www.aarf.asia. Email: [email protected] , [email protected] Page 109
urbanization definitely creates the problem on regional imbalance of population, regional
harmony and peoples’ dissatisfaction. Nepal requires strong policies for addressing the rising
problems of urbanization. The new policies should be executed to stop the increasing migration
of rural people to the urban areas like youth from village to the district headquarters, and district
headquarters to the capital city, which is creating pressure in the cities, towns and capital. The
high consumption habit of the urban residents needs more resources, which ultimately degrade
environment. So, Nepal government needs to bring suitable solution to control negative impact
of urbanization for sustainable development of the nation.
References
Central Bureau of Statistics, 1995, Population monograph of Nepal, Government of Nepal.
Central Bureau of Statistics, 2001, Population census, National report, Central Bureau of
Statistics, Government of Nepal.
Central Bureau of Statistics, 2002, Statistical pocket book, Central Bureau of Statistics,
Government of Nepal.
Central Bureau of Statistics, 2003, Population monograph of Nepal, Central Bureau of
Statistics, Government of Nepal.
Central Bureau of Statistics, 2011, Four monthly statistical bulletins, Central Bureau of
Statistics, Government of Nepal. 105,1.
Central Bureau of Statistics, 2011, Statistical year book, Central Bureau of Statistics,
Government of Nepal.
Central Bureau of Statistics, 2011, Preliminary results of national population census. Central
Bureau of Statistics, Government of Nepal.
Central Bureau of Statistics, 2012, Nepal in figure, Central Bureau of Statistics, Government
A Monthly Double-Blind Peer Reviewed Refereed Open Access International e-Journal - Included in the International Serial Directories
International Research Journal of Natural and Applied Sciences (IRJNAS)
Website: www.aarf.asia. Email: [email protected] , [email protected] Page 110
Luintel, C.P. ,2007, Population of Nepal, Kathmandu: Pradhan Book House.
MOHP, 2011, Nepal population report 2011, Ministry of Health and Population, Government of
Nepal.
NPHC, 2011, National population and housing census 2011, Central Bureau of Statistics, Nepal
Government of Nepal.
Pokharel, J.R., 2013, Rapid Urbanization in Nepal: An asset or Liability? The Himalayan times,
28 July 2013.
Subedi, B.P., 2010, Urbanization in Nepal: Changing Definitions, Growth and Spatial Patterns,