Energy versus food: How do countries
differ?
Dias, Guilherme Leite da Silva and Guilhoto, Joaquim José
Martins
University of São Paulo
2009
Abstract
Through the use of input-output analysis and the system of national account, this paper presents new methodological insights in ways to estimate and to measure the Agribusiness GDP of a nation. Using data for the Brazilian economy it was possible to measure the GDP of Brazilian Agribusiness, which were estimated to be around 27% of the Brazilian GDP in 2000. The GDP of the Agribusiness was also estimated for two major complexes: a) Vegetal Products and b) Animal Products. Each of the Agribusiness complexes was divided into four components: a) inputs to agriculture; b) agriculture; c) agriculture based industry; and d) final distribution. From a disaggregated perspective regarding the composition of the Agribusiness, the results point out that the agriculture based industries and the final distribution components are dynamic poles in this agrarian transformation process. The contribution of the different sectors to the Agribusiness GDP confirm that the Agribusiness adds value to the agricultural raw materials, with the warehousing, processing and final distribution sectors tending to be more and more representative in the value of the output sold to the consumer.
Key Words: Agribusiness, GDP, Input -Output, Brazil.
JEL: Q13, C67.
†
The results presented here are part of a project being conducted at the Center for Advanced Studies in Applied Economics at the University of São Paulo (CEPEA -USP) under the financial support of the Brazilian National Confederation of Agriculture (CNA) and which is direct to define new methodologies to measure and to study the role of the Agribusiness in the Brazilian economy as a whole as well as in its regions. We would also like to acknowledge the partial financial support provided by CAPES, that made possible to present a previous version of this paper at the 13th International Conference on Input-Output Techniques, in Macerata – Italy, and we would also like to thank the comments received at this meeting.
*
1. I
NTRODUCTIONWith the post-war worldwide technological revolution of agriculture, the farming activities
underwent a large expansion and increasing specialization, decisively influenced by the economical
development and growing urbanization. Such process basically imposed a new agricultural order in
which the modern farmer is an expert involved with cultivation and animal breeding operations thus
transferring the functions of storing, processing and distribution of vegetal/animal products as well as
the supply of input and production factors to organizations other than the farm.
Previously focusing on self-sufficiency, agriculture was updated and introduced into the
market economy constituting new links or segments to the feeding system. Basically this process
resulted in the structuring of a modern industrial park providing capital goods and input for that area,
a sector called the rising tides of the farm. On the other hand, complex storing, transportation,
processing, industrialization and distribution networks were formed – the ebb tide sector.
To date the value of the agriculture-related activities performed outside the farms are
substantially higher than those of the total operations performed therein. As an example, LIPTON et
al (1998) points the case of the United States, according to 1996 data, the share of Farming in the
Food and Fiber System is only 7.1%, while Inputs have a share of 29.6% and Manufacturing and
Distribution a share of 63.3%. The GDP of the Food and Fiber System was estimated by the
authors to be US$ 997.7 billion, i.e., 13.1% of Unites States GDP. The System employs a total of
22,694 thousand workers, which represent 16.9% of total U.S. employment, with the rural jobs
representing only 1% of the total jobs of the country.
As a result of such phenomenon, the traditional economy concept that classifies the different
activities as “primary, secondary and tertiary” sectors as separate and not integrated led to an
analysis focusing on an interlinked system of production, processing and distribution of
farming-originated products – the Agribusiness.
The pioneering academic contribution to quantify such conceptual approach was done by
Davis & Goldberg (1957) when they created the term Agribusiness. Making use of input-output
matrix techniques developed by Wassily Leontief (Leontief, 1951), the authors studied the
transformations and restructuring of agriculture. By analyzing the problems related to the agricultural
ordinary rural activity. That explains the need of dealing with agricultural problems under a systemic
focus (Agribusiness) instead of a static one (agriculture).
Such expansion and specialization process of the agriculture is known to have occurred
homogeneously in all regions of the planet, for it depends on the economic and social stage of
development of each one of them. Namely, the participation and interaction of the agents – farmers,
input suppliers and production factors, processors and distributors – occurred in different degrees in
the various levels of the agricultural-feeding system (Pinazza & Araújo, 1993).
This worldwide transformation process also occurred in the Brazilian agriculture system with
the agriculture and the stock raising activities being redirected, updated and integrated into the
market. The transformations and restructuring of the rural sector started in the 1950s with and
effective participation of the Brazilian government.
During the post-1950s period, the modernization process of the agriculture begins a more
advanced phase, i.e., that of the industrialization, “... which represents the fundamental qualitative
change in the long process of transformation of technical grounds, thus making the modernization
process irreversible” (See Kageyama, 1990).
A great deal of these transformations were intensified by: a) the National System of Rural
Credit through the use of subsidized credit; and b) by the II National Development Plan (1974/79)
that made it ease to import agriculture machinery. (Barros, 1983)
This process helped in the consolidation of the Brazilian Agribusiness, that took place
through the intersectoral integration among the industries that produce for the agriculture, the
agriculture itself, the processing industries, and the distribution. The agricultural production then
becomes part of a chain and depends on the industry dynamics, that is, there is an increasing
integration between agriculture and industry in which the agriculture/industry cut becomes less
important.
In view of these considerations, it is clear that the integration between agriculture and
industry implies a real restructuring of the rural sector, establishing deep technological, productive,
financial and business relationships with the other economy activities.
In Brazil, surveys on Agribusiness are scarce, and the researches available constantly involve
approach still prevails, as in the economic literature the analysis of agriculture so to speak also
prevails. The Brazilian Institute of Geography and Statistics (IBGE) releases information on national
accounts, integrated with input-output tables, such that from this data it is possible to make a study
of the Brazilian agriculture in the Agribusiness scope developed this paper.
In this way, this paper presents the estimation made for the Brazilian Agribusiness GDP in
the 1994/2000 time period. From these results it is possible to make economic evaluations so as to
subsidize sectoral policy planning to the agribusiness management, as well as to detect fundamental
elements of this new agricultural pattern, in order to help redirect the rural producer as an economic
agent. The Brazilian Agribusiness GDP estimates are also decomposed into two major complexes,
Vegetal and Animal products.
The next section will present the methodology developed in this work, section 3 will present
the results for the Brazilian economy, while the final remarks are made in the last section.
2. M
ETHODOLOGY TO MEASURE THEB
RAZILIANA
GRIBUSINESSS
YSTEMBesides measuring the Agribusiness as whole for the Brazilian economy, in this paper the
Agribusiness was also measured for two major complexes: Vegetal Products and Animal Products.1
The total GDP value of the Agribusiness in each complex will also be divided into 4
aggregates: I) inputs; II) the sector itself; III) industrial processing; and IV) distribution and services.
The procedure adopted to estimate the Brazilian Agribusiness GDP is through the scope of
the Product, i.e., by estimating the value added at market prices.2
The value added at market prices is given by the sum of the value added at basic prices with
indirect net taxes less the financial dummy, resulting in:
VAMP = VABP + INT – FDu (1)
where:
1
VAMP = Value added at market prices
VABP = Value added at basic prices
INT = Indirect net taxes
FDu = Financial dummy
To estimate the GDP of Aggregate I (input for vegetal and animal production) one uses the
information available in the input-output tables regarding the input values acquired by the Vegetal
and Animal sectors. The columns with input values are multiplied by the respective coefficient of
value added (CVAi).
The Coefficients of the Value Added for each sector (CVAi) are obtained by dividing the
Value Added at Market Prices (V AMP)of a given sector by its respective output (Xi), i.e.,
i MP i
X V A
C V A= (2)
Thus, the double-counting issue presented by previous Agribusiness GDP estimates in the
Brazilian Economy when input values were considered, instead of the value added effectively
generated by it, is eliminated. In that sense the GDP of the Aggregate I is given by:
GDPI zik CVAi
i
k = =
∑
*1 43
(3)
k = 1, 2 vegetal and animal sectors
i = 1, 2, ..., 43 all the economic sectors
where:
GDPI
k= GDP of aggregate I (input) for vegetal (k=1) and animal (k=2)
zik = total input value of sector i for either vegetal or animal
CVAi= value added coefficient of sector i
For the total Aggregate I we have:
2 The methodology presented here takes into consideration the use by IBGE of the System of National Accounts
GDPI =GDPI +GDPI
1 2 (4)
where:
GDPI= GDP of aggregate I
and the other variables are as previously defined.
The estimates for the Aggregate II (the sector itself, vegetal and animal) considers the
value added generated by the respective sectors, subtracting the values used as input from the value
added of these sectors, thus the double-counting issue found in the previous Agribusiness GDP
estimates for the Brazilian economy is again eliminated. Then one has:
GDP VA z CVA
k
II MP ik
i
i
k = k −
=
=
∑
1 2*
1, 2
(5)
where:
GDPII
k= GDP of aggregate II for vegetal (k = 1) and animal (k = 2)
and the other variables are as previously defined.
For the total Aggregate II we have:
GDPII =GDPII +GDPII
1 2 (6)
where:
GDPII= GDP of aggregate II
and the other variables are as previously defined.
To define the composition of the Aggregate III (agriculture based industries) several
indicators were adopted as for instance: a) the main demanding sectors of agricultural products
obtained by input-output matrix estimation; b) the share of agricultural input in the intermediate
consumption the agroindustrial sectors; and c) the economic activities carrying out the first, second
and third transformation of agricultural raw materials. In this way, the agriculture based industries are
the following activities: i) Wood and Wood Products; ii) Pulp, Paper and Printing; iii) Processing of
Chemical Elements (Alcohol); iv) Textile; v) Clothing; vi) Footwear, Leather and Skins; vii) Coffee
Industry; viii) Vegetal Products Processing; ix) Animal Slaughtering; x) Dairy Industry; xi) Sugar
The input-output matrix data for 1995 shows that out of the total output of vegetal and
animal production for intermediary purposes, 21.8% is absorbed by the rural sector, 71.8% is sold
to the agriculture based industries and only 6.4% is designated to the remaining sectors.
In the estimation of Aggregate III (Agriculture Based Industries) one adopted the
summation of the value added generated by the agroindus trial sectors subtracted from the value
added of these sectors that have been used as input in the Aggregate II. As previously mentioned,
this subtraction is done to eliminate the double -counting found in previous Agribusiness GDP
estimates, as so, one has that:
GDP VA z CVA
k
III MP qk q
q k
k = q −
=
∑
e
*j
ε
1, 2
(7)
where:
GDPIII
k= GDP of aggregate III for vegetal products (k = 1) and animal products (k = 2)
and the other variables are as previously defined.
For the total Aggregate III we have:
GDPIII =GDPIII +GDPIII
1 2 (8)
where:
GDPIII= GDP of aggregate III
and the other variables are as previously defined.
In the case of Aggregate IV, regarding the Final Distribution, one considers the aggregated
value of the Transportation, Commerce and Service sectors. Out of the total value obtained for
these sectors only the part corresponding to the share of the agricultural and agroindustrial products
is designated to the Agribusiness in the final product demand. The approach adopted in the
estimation of the final distribution value of the industrial agribusiness can be represented by:
DFD
IP
INT
GFD
−
FD−
ED=
(9)TM
VAS
VAC
2 , 1 * = + =
∑
∈ k DFD FD FD T MGDP q k
q k
IVk (11)
where:
GFD = global final demand
INTFD= indirect net taxes paid by the final demand
IPFD= imported products by the final demand
DFD = domestic final demand
VATMP = value added of the transportation sector at market prices
VACMP = value added of the commerce sector at market prices
VASMP = value added of the service sector at market prices
TM = trading margin
FDk = final demand of vegetal (k=1) and animal (k=2)
FDq = final demand of the agroindustrial sectors
GDPIV
k = GDP of aggregate IV for vegetal (k=1) and animal (k=2) For the total Aggregate IV we have:
GDPIV =GDPIV +GDPIV
1 2 (12)
where:
GDPIV= GDP of aggregate IV
and the other variables are as previously defined.
The Agribusiness GDP for each sub-complex is given by the sum of its aggregates as:
GDPAgribu ess GDPI GDPII GDPIII GDPIV
k k k k k
sin = + + + (13)
where:
GDPAgribu ess
k
sin = GDP of the agribusiness for vegetal products (k =1) and animal products (k =2)
and the other variables are as previously defined.
The total Agribusiness GDP is given by:
GDPAgribusiness =GDPAgribusiness +GDPAgribusiness
1 2 (14)
where:
and the other variables are as previously defined.
The methodology described above is showed in Figure 1. In this way, the Agribusiness
GDP can be obtainable either by the weighed sum of the aggregates GDP or by the weighed sum of
the GDP of the Vegetal and Animal Products.
Vegetal Products
Dist. & Serv. Industry
Input
Industry
Input Animal
Products
Total Agribusiness GDP Vegetal
Agribusiness GDP Agribusiness GDPAnimal
Vegetal Products
Animal Products
Animal Dist. and Serv.
Animal Industry
Vegetal Dist. and Serv.
Vegetal Industry
Vegetal
Inputs AnimalInputs Total AgricultureInputs
Dist. & Serv.
Total Agribusiness GDP Total Agriculture
Products
Total Agriculture Industry
[image:10.612.126.480.209.637.2]Total Agriculture Dist. and Serv.
To obtain the contribution of each industrial sector to the Agribusiness GDP the following is
done: a) the agribusiness value is estimated, should there be no industrial sectors, according to the
methodology described above; and b) also according to this methodology, each industrial sector is
inserted, one by one, into the agribusiness complex, thus, by subtraction it is possible to estimate the
contribution of each processing industry to the total agribusiness.
3. T
HEB
RAZILIANA
GRIBUSINESS, 1994
TO2000
The results for the Brazilian Agribusiness point out the importance that such complex has
played in the national economy, accounting for approximately 27% of its GDP in 2000.
Table 1 presents the shares of the Agribusiness GDP in the Brazilian economy for the
1994-2000 period. The Brazilian Agribusiness GDP accounted for 30.4% of Brazil’s GDP in 1994,
having a declining trend until 1997 (27.7%).
The GDP of the Brazilian Agribusiness for 2000 was estimated to be US$ 167.7 billions.
Which represent a small growth over the value observed in 1994 (US$ 163.0 billion) and being the
[image:11.612.87.523.494.648.2]same value as the one observed for 1995.
Table 1
Agribusiness and Brazilian GDP: 1994 to 2000
Year Agribusiness GDP
US$ Billion*
Agribusiness GDP Growth Rate (%)
Brazilian GDP US$ Billion*
Agribusiness GDP Share (%)
1994 163.0 - 535.2 30.4
1995 167.7 2.92 557.8 30.1
1996 165.0 -1.62 572.6 28.8
1997 163.5 -0.89 591.3 27.7
1998 164.5 0.58 592.6 27.8
1999 167.5 1.85 597.3 28.0
2000 167.7 0.10 621.2 27.0
Source: CNA/CEPEA Research Data.
Table 2 shows the evolution of the Brazilian Agribusiness GDP, both in global terms (total)
and for the two sub-complexes, with corresponding segments for the 1994-2000 time period.
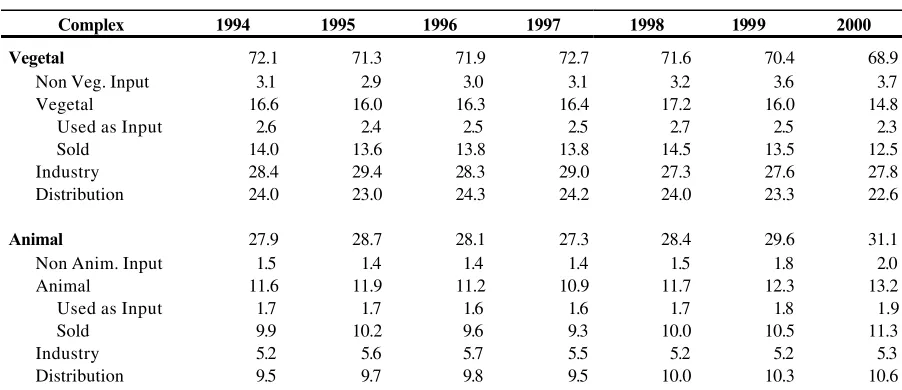
[image:12.612.84.531.228.524.2]Table 2
Brazilian Agribusiness GDP - US$ Billion of 2000*
Complex 1994 1995 1996 1997 1998 1999 2000
Agriculture 163.0 167.7 165.0 163.5 164.5 167.5 167.7
Non Ag. Input 7.6 7.2 7.4 7.3 7.7 9.0 9.5 Total Agriculture 46.0 46.8 45.3 44.7 47.5 47.4 47.0 Used as Input 7.0 6.8 6.9 6.8 7.2 7.2 7.1 Sold 39.0 40.0 38.5 37.9 40.3 40.2 39.9 Industry 54.7 58.7 56.1 56.4 53.5 54.9 55.5 Distribution 54.7 54.9 56.2 55.1 55.8 56.2 55.6
Vegetal 117.5 119.7 118.6 118.8 117.8 117.9 115.5
Non Veg. Input 5.1 4.8 5.0 5.0 5.2 6.0 6.2 Vegetal 27.0 26.8 26.9 26.8 28.2 26.8 24.9 Used as Input 4.2 4.0 4.2 4.2 4.4 4.2 3.9 Sold 22.8 22.8 22.7 22.6 23.8 22.6 21.0 Industry 46.3 49.3 46.7 47.5 44.9 46.2 46.7 Distribution 39.2 38.6 40.0 39.5 39.4 39.0 37.9
Animal 45.4 48.1 46.4 44.7 46.7 49.6 52.2
Non Anim. Input 2.5 2.4 2.3 2.3 2.4 3.0 3.4 Animal 19.0 20.0 18.5 17.9 19.3 20.7 22.1 Used as Input 2.8 2.8 2.7 2.6 2.8 3.0 3.2 Sold 16.2 17.2 15.8 15.3 16.4 17.6 18.9 Industry 8.4 9.4 9.4 9.0 8.6 8.7 8.8 Distribution 15.5 16.3 16.1 15.6 16.4 17.2 17.8 Source: CNA /CEPEA Research Data.
* The values for 2000 were converted from Brazilian Reais to U.S. dollars using the average exchange rate for this year. The results for the remaining time period were obtained by applying over the 2000 values the real growth rates, in Brazilian Reais, observed from 1994 to 1999.
The shares of the components of the Agribusiness GDP (Tables 3 and 4) show that the input
contribution has a growing trend for the total complex in the period. Although vegetal and animal
have shown declining results from 1994 through 1997, an inverse trend was recorded from 1998 to
The evolution of the Brazilian Agribusiness composition also shows the high shares of the
Agriculture Based Industries and the Distribution segment, showing values always above 30%. In
2000 the Agriculture Based Industries and Distribution segments had a share of respectively 33.1%
and 33.2% for the total Complex.
Tables 2 to 4 show the structure of the two major complexes of the Brazilian Agribusiness –
Vegetal and Animal, in 2000 the Vegetal Agribusiness GDP of US$ 115.5 billions represented
18.6% of Brazil’s GDP, while the Animal Agribusiness GDP, US$ 52.2 billions, corresponded to
8.4% of Brazil’s GDP. In the case of the agriculture, the higher GDP share is justified by the
diversity of the agricultural sector that has a higher number of processing industries than the animal
[image:13.612.85.531.393.679.2]sector.
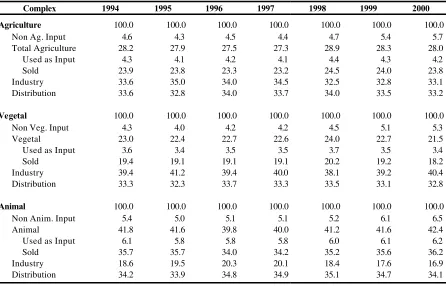
Table 3
Brazilian Agribusiness Share Inside Each Complex (%)
Complex 1994 1995 1996 1997 1998 1999 2000
Agriculture 100.0 100.0 100.0 100.0 100.0 100.0 100.0
Non Ag. Input 4.6 4.3 4.5 4.4 4.7 5.4 5.7 Total Agriculture 28.2 27.9 27.5 27.3 28.9 28.3 28.0 Used as Input 4.3 4.1 4.2 4.1 4.4 4.3 4.2 Sold 23.9 23.8 23.3 23.2 24.5 24.0 23.8 Industry 33.6 35.0 34.0 34.5 32.5 32.8 33.1 Distribution 33.6 32.8 34.0 33.7 34.0 33.5 33.2
Vegetal 100.0 100.0 100.0 100.0 100.0 100.0 100.0
Non Veg. Input 4.3 4.0 4.2 4.2 4.5 5.1 5.3 Vegetal 23.0 22.4 22.7 22.6 24.0 22.7 21.5 Used as Input 3.6 3.4 3.5 3.5 3.7 3.5 3.4 Sold 19.4 19.1 19.1 19.1 20.2 19.2 18.2 Industry 39.4 41.2 39.4 40.0 38.1 39.2 40.4 Distribution 33.3 32.3 33.7 33.3 33.5 33.1 32.8
Animal 100.0 100.0 100.0 100.0 100.0 100.0 100.0
Table 4
Share in the Brazilian Agribusiness GDP (%)
Complex 1994 1995 1996 1997 1998 1999 2000
Vegetal 72.1 71.3 71.9 72.7 71.6 70.4 68.9
Non Veg. Input 3.1 2.9 3.0 3.1 3.2 3.6 3.7 Vegetal 16.6 16.0 16.3 16.4 17.2 16.0 14.8 Used as Input 2.6 2.4 2.5 2.5 2.7 2.5 2.3 Sold 14.0 13.6 13.8 13.8 14.5 13.5 12.5 Industry 28.4 29.4 28.3 29.0 27.3 27.6 27.8 Distribution 24.0 23.0 24.3 24.2 24.0 23.3 22.6
Animal 27.9 28.7 28.1 27.3 28.4 29.6 31.1
Non Anim. Input 1.5 1.4 1.4 1.4 1.5 1.8 2.0 Animal 11.6 11.9 11.2 10.9 11.7 12.3 13.2 Used as Input 1.7 1.7 1.6 1.6 1.7 1.8 1.9 Sold 9.9 10.2 9.6 9.3 10.0 10.5 11.3 Industry 5.2 5.6 5.7 5.5 5.2 5.2 5.3 Distribution 9.5 9.7 9.8 9.5 10.0 10.3 10.6 Source: Table 2.
The aggregate value derived from agriculture and animal products are made up by its output
destiny, i.e.: a) inputs used in the agriculture; b) inputs used by the industries; c) exported; and d)
final consumption by the families and the government. Given the above, one has that the value of the
Total Agriculture GDP in 2000 was of US$ 47.0 billions. Splitting the Total Agriculture GDP by the
sub-complexes one has that in 2000 the total GDP for the Vegetal and Animal production was,
respectively, of US$ 24.9 billions and US$ 22.1 billions (Table 2).
Regarding the annual growth of the sub-complexes one verifies that the Animal complex was
the one presenting best results in 1999 and 2000, with real growth rates of 6.19% and 5.17%,
respectively, in comparison with those of 0.13% and –2.03% for the Vegetal complex (Table 5).
Considering that the Agribusiness is a segment with agents from the primary (agriculture),
secondary (industry), and tertiary (services) sectors, the changes in the GDP will be a function of the
relative variation of its components.
The results show that out of the components considered for the estimation of the Total
Agribusiness GDP in 1999, only the Total Agriculture had a negative variation of –0.11%,
observe that the Inputs, the Agriculture Based Industries, and Distribution had positive variations in
1999, with respectively, real growth rates of 8.66%, 2.71% and 0.61%. In 2000, however,
negative results were observed for the Agriculture and Distribution segment, with respectively,
[image:15.612.109.505.291.587.2]variations of –0,90 and –0,96 (Table 5).
Table 5
Brazilian Agribusiness Growth Rates (%)
Complex 1995 1996 1997 1998 1999 2000
Agriculture 2.92 -1.62 -0.89 0.58 1.85 0.10
Non Ag. Input -4.08 1.67 -1.32 5.68 16.87 6.35 Total Agriculture 1.80 -3.19 -1.42 6.23 -0.11 -0.90 Used as Input -2.02 0.46 -1.42 6.23 -0.11 -1.12 Sold 2.48 -3.81 -1.42 6.23 -0.11 -0.86 Industry 7.29 -4.39 0.57 -5.27 2.71 1.02 Distribution 0.45 2.24 -1.84 1.31 0.61 -0.96
Vegetal 1.79 -0.88 0.19 -0.88 0.13 -2.03
Non Veg. Input -5.18 3.75 -0.35 4.95 13.63 3.24 Vegetal -0.63 0.07 -0.21 5.24 -5.13 -7.14 Used as Input -4.18 3.61 -0.25 5.28 -4.96 -7.14 Sold 0.03 -0.55 -0.20 5.24 -5.16 -7.14 Industry 6.64 -5.38 1.68 -5.48 2.93 1.00 Distribution -1.36 3.61 -1.22 -0.24 -1.10 -2.93
Animal 5.84 -3.46 -3.62 4.44 6.19 5.17
Non Anim. Input -1.78 -2.49 -3.39 7.28 23.84 12.50 Animal 5.26 -7.56 -3.19 7.71 7.25 7.19 Used as Input 1.25 -4.07 -3.24 7.75 7.46 7.19 Sold 5.94 -8.14 -3.18 7.71 7.21 7.19 Industry 10.83 0.81 -4.94 -4.16 1.57 1.17 Distribution 5.02 -1.02 -3.38 5.23 4.74 3.49
Source: Table 2.
Considering the annual growth rates of the components of the Vegetal Agribusiness GDP
one notices that only the Input and Industry segments had a positive performance in 1999, with
5.16%) and Distribution (–1.10%). For 2000, only the industry kept a positive growth rate of
1.00% (Table 5).
Despite the negative context presented by the farming segment, the Animal Agribusiness
Complex showed a positive performance from 1998 to 2000. Thus, in that complex the growth
rates in 1999 were respectively 15.07%, 7.21%, 1.57% and 4.74% for the input, animal,
processing and services segments. This complex has showed a similar performance for 2000 (Table
5).
When measured by a broader concept, the sectoral GDP data from 1994-2000 allows a
more accurate technical evaluation regarding the sectoral performance of the Brazilian Agribusiness.
These results are shown in Tables 6 and 7. The activity regarding the vegetal and animal products
also includes the value of the inputs used plus the value aggregated with the distribution of the vegetal
and animal products; the value for the agriculture based industries also includes the value aggregated
with the distribution of the industries production. Using this broader concept, the value of the
agricultural sector was responsible, in 2000, for 42.2% of Brazil’s Total Agribusiness GDP.
Concerning the agriculture sector, the decrease of the GDP value in 1996 and 1997 can be
interpreted as an economic backward movement (US$65,8 billions in 1996 and US$ 64,3 billions in
1997). After this period there was a recovery in 1998, 1999 and 2000, with growth rates of
8.02%, 1.77% and 0.10%, respectively. One should point the highly positive performance of the
Animal sector in the more recent period, 1998 to 2000, with growth rates of 9.55%, 8.48% and
7.71%, respectively, which certainly reflected on the positive result of the rural sector in that triennial
(8.02%, 1.77% and 0.10%, respectively).
More recently, despite the not so significant growth of the Total Agribusiness GDP (1.85%)
in 1999 and 2000 (0.10%), some industrial sectors managed to overcome the drawbacks and
present highly satisfactory results. The Pulp, Paper and Printing industry had a GDP growth of
20.81% and 17.94% in 1999 and 2000, respectively, going from US$ 7.5 billions in 1998 to US$
9.0 billions in 1999 and US$ 10.6 in 2000 (Table 6 and 7).
In the case of the Chemical Elements (Alcohol) industry the GDP growth in 1999 was
12.97%, reaching the mark of US$ 7.1 billions. In 2000, this segment had a growth of 1.18%. The
aggregated value from US$ 10.5 billions in 1998 to US$ 11.7 billions in 1999. In 2000 the growth
was only of 0.84%. The Coffee and Textile industries had growth rates of 7.09% and 5.77%,
respectively, in 1999. In 2000, diverging from these results, the segments had results of –3.54% and
1.78%, respectively. Among the sectors, the poorest performance was that of the Clothing industry,
which has been showing negative growth rates since 1996, with a reduction of 14.76%, with its
GDP in 1999, going from US$ 8.4 billions in 1995 to US$ 5.8 billions in 2000. The Vegetal Oil
Processing Industry is also other sector that is loosing share in the agribusiness, going from a value of
US$ 4.8 billion in 1994 to a value of US$3.7 billion in 2000 (Tables 6 and 7).
The results obtained for the Brazilian Agribusiness confirm the behavior trend observed in
highly industrialized economies, in which the share of the agriculture based industries and final
distribution tends to be more and more representative in the value of the output sold by farmers. In
that process, the vegetal and animal sector becomes less important in the composition of the
Agribusiness output, with a relative sector’s income decrease as can be observed in the works of
Davis and Goldberg (1957), Lipton et al. (1998), Lauschner (1993), and Malassis (1968).
Through the data presented here, it is possible to see that the Brazilian agriculture is inserted
into the current trend of the world’s economy by adapting itself to the situation of the consumers,
concentrated on the urban regions, with sophisticated consuming structures in which a larger
participation of industrialized and diversified products is a constant demand.
In short, the Brazilian Agribusiness adds value on the agricultural raw materials in which the
warehousing, processing and final distribution sector tends to be more representative of the total
value of the output sold to the consumer, thus dominating the agriculture/industry relationships.
In that sense, it is fundamental to take into account the necessary organization of farming
producers into associations, cooperatives or other alternative means to support rural producers, as it
allows rural workers to face the challenges of this new agrarian pattern, leading to a relative
Table 6
Sectoral Distribution of the Brazilian Agribusiness GDP: 1995 to 2000 US$ Billion of 2000*
Sector 1994 1995 1996 1997 1998 1999 2000
Agriculture (1) 66.7 67.8 65.8 64.3 69.5 70.7 70.8
Vegetal (2) 39.4 39.1 39.2 38.8 41.6 40.4 38.1
Animal (3) 27.3 28.7 26.6 25.5 28.0 30.3 32.7
Wood & Wood Products(4) 8.3 8.7 8.5 8.2 7.6 7.6 7.9
Pulp, Paper & Printing(4) 7.2 9.0 8.4 8.0 7.5 9.0 10.6
Chemical Elem. (Alcohol)(4) 7.9 6.2 6.0 7.4 6.3 7.1 7.2
Textile Industry(4) 7.4 7.6 6.9 6.3 5.4 5.7 5.6
Clothing Industry(4) 8.0 8.4 8.3 7.4 7.1 6.0 5.8
Footwear Industry(4) 4.6 4.3 4.3 4.1 3.3 3.1 3.0
Coffee Industry(4) 3.7 3.1 3.2 3.1 4.1 4.4 4.3
Vegetal Products Processing(4) 12.9 12.7 13.5 14.3 13.1 12.4 11.2
Animal Slaughtering(4) 9.8 10.4 10.6 10.3 10.5 11.7 11.8
Dairy Industry(4) 3.8 4.6 4.9 4.9 5.0 4.5 4.7
Sugar Industry(4) 2.8 2.5 2.5 2.6 2.6 2.5 2.9
Vegetal Oil Processing(4) 4.8 4.5 4.5 5.1 4.8 4.6 3.7
Other Food Products(4) 15.3 17.8 17.6 17.6 17.8 18.0 18.2
Total 163.0 167.7 165.0 163.5 164.5 167.5 167.7
Source: CNA/CEPEA-USP Research Data.
(1) These values refer to the sum of the aggregated value generated by the agriculture sector, the inputs used by the sector and the distribution value of the vegetal and animal products.
(2) These values refer to the sum of the aggregated value generated by the vegetal sector, the inputs used by the sector and the distribution value of the agricultural products.
(3) These values refer to the sum of the aggregated value generated by the animal sector, the inputs used by the sector and the distribution value of the animal products.
(4) These values refer to the sum of the aggregated value generated by the industrial sector plus the distribution value of the processed products.
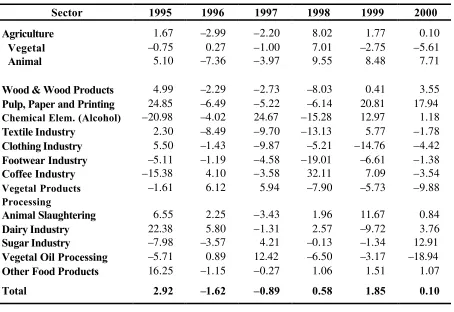
Table 7
Real Growth Rates (%) of the Sectoral Distribution of the Brazilian Agribusiness GDP: 1995 to 2000
Sector 1995 1996 1997 1998 1999 2000
Agriculture 1.67 –2.99 –2.20 8.02 1.77 0.10
Vegetal –0.75 0.27 –1.00 7.01 –2.75 –5.61
Animal 5.10 –7.36 –3.97 9.55 8.48 7.71
Wood & Wood Products 4.99 –2.29 –2.73 –8.03 0.41 3.55
Pulp, Paper and Printing 24.85 –6.49 –5.22 –6.14 20.81 17.94
Chemical Elem. (Alcohol) –20.98 –4.02 24.67 –15.28 12.97 1.18
Textile Industry 2.30 –8.49 –9.70 –13.13 5.77 –1.78
Clothing Industry 5.50 –1.43 –9.87 –5.21 –14.76 –4.42
Footwear Industry –5.11 –1.19 –4.58 –19.01 –6.61 –1.38
Coffee Industry –15.38 4.10 –3.58 32.11 7.09 –3.54
Vegetal Products Processing
–1.61 6.12 5.94 –7.90 –5.73 –9.88
Animal Slaughtering 6.55 2.25 –3.43 1.96 11.67 0.84
Dairy Industry 22.38 5.80 –1.31 2.57 –9.72 3.76
Sugar Industry –7.98 –3.57 4.21 –0.13 –1.34 12.91
Vegetal Oil Processing –5.71 0.89 12.42 –6.50 –3.17 –18.94
Other Food Products 16.25 –1.15 –0.27 1.06 1.51 1.07
Total 2.92 –1.62 –0.89 0.58 1.85 0.10
Source: Table 6
5. C
ONCLUSIONSBy analyzing the results presented in this paper, one can infer the complexity of the Brazilian
economy, which presents an advanced stage of a productive structure with a high interlinking degree
among the national productive sectors.
As to the Agribusiness results, the empirical data show the fundamental role that this segment
has performed in the Brazilian economy, responsible for approximately 27% of its GDP in 2000. In
Vegetal and Animal – one observes that the GDP of the Vegetal Agribusiness represents, around
20% of the Brazilian GDP, while the GDP of the Animal Agribusiness corresponds to approximately
8% of the Brazilian GDP. In the case of the Vegetal, the higher GDP share is explained in great part
by the diversity of the agricultural sector, which has a larger number of processing industries than the
animal sector. These results point out the importance and dependence of the other sectors of the
economy in the agriculture, the share of 7.6%, in 2000, of the Brazilian agriculture in the national
GDP is multiplied approximately 3.6 times when the Agribusiness concept is used.
Specifically with regards to the annual growth of the sub -complexes, one verifies that the
Animal Product segment was the one presenting best results in the last years of analysis.
As to the share of the components of the Agribusiness GDP, one observes that the input
contribution tended to grow for the total complex during the analyzed period, especially in the last
three years (1998 to 2000). Although the Agriculture segment has presented a decreasing trend
from 1994 to 1997 this has reversed in more recent years.
The evolution of the Brazilian Agribusiness composition also shows a high share of the
Industry and the Distribution segments, as each segment has a share of around 33% of the total
Agribusiness chain. This confirms that the processing and final distribution sectors are higher impulse
vectors on the total value of the output sold to consumers, consolidated on the strong net connecting
agriculture and industry.
One should stress that the basic methodology adopted here is integrated with the UN
System of National Accounts and at the same time prevents the double count problem presented in
usual works of Agribusiness GDP estimation. Due to the use of this new methodology one believes
that the results achieved provide an accurate picture of what has been happening to the Brazilian
Agribusiness, so as to provide the economic agents with subsidies for decision-making, besides
decisively contributing to the methodological improvement of this sort of research.
Despite the study made here, there are still some questions left out and that need to be
uncovered, like, how to measure the contribution of the a given culture to the agribusiness, how the
regions interact among themselves in generating the value of the agribusiness, how the agriculture can
take advantage of this more advanced and integrated process of production, and what should be the
R
EFERENCESBarros, J.R.M. (1983). “Transição e Descontinuidade no Crescimento Agrícola”. In Dias, G.L.S.
and J.R.M. Barros (eds.) (1983). Fundamentos de Uma Nova Política Agrícola. Brasília:
Companhia de Financiamento da Produção. Coleção Análise e Pesquisa, 26.
Davis, J. & Goldberg, R. (1957). A Concept of Agribusiness. Boston: Harvard University, 1957.
p. 133.
Furtuoso, M.C.O (1998). O Produto Interno Bruto do Complexo Agroindustrial Brasileiro.
Tese de doutorado. Piracicaba, 1998. 278 p. – Universidade de São Paulo/ESALQ/USP.
Furtuoso M.C.O., G.S.C. Barros, J.J.M. Guilhoto (1998). “The Gross National Production of the
Brazilian Agroindustrial Complex”. Brazilian Review of Agricultural Economics and Rural
Sociology. 36(3) 1998.
Guilhoto, J.J.M., M.C.O. Furtuoso, and G.S.C. Barros (2000). O Agronegócio na Economia
Brasileira, 1994-1999. CEPEA / CNA. Relatório de Pesquisa. Setembro.
Kageyama, A. et al. (1990). “O novo padrão agrícola brasileiro: do complexo rural aos complexos
agroindustriais”. In: Delgado, G. et al. (orgs.). Agricultura e Políticas Públicas. Brasília:
IPEA. Relatório, n. 127.
Lauchener, R. (1993). Agribusiness, Cooperativa e Produtor Rural. Rio Grande do Sul – São
Leopoldo: Editora da Universidade do Vale do Rio dos Sinos. 296 p.
Leontief, W. (1951). The Structure of the American Economy. 2a. ed. New York: Oxford
University Press, 1951.
Lipton, K. L., W. Edmondson, e A. Manchester (1998). “The Food and Fiber System –
Contributing to the U.S. and World Economies”. Economic Research Service/USDA,
Agricuture Information Bulletin. no 742.
Malassis, L. (1968). “Developpment Economique et Industrialisation de l’Agriculture”. Economie
Appliqueé, t. 21, n.1.
Pinazza, L.A. & Araújo, N.B. (1993). Agricultura Brasileira no Século XX: Uma Visão de