http://dx.doi.org/10.4236/ajac.2013.412090
Zn Ions Change Binding Mode of TOEPyP4 with DNA and
Cause DNA Transition from B to C and
Zn-Like Conformations
Jamlet Monaselidze1*, Maya Gorgoshidze1, David Khachidze1, Maya Kiladze1, Vasil Bregadze1, Eugene Kiziria1, Hakob Margaryan2, Nune Hakobyan2
1Department of Physics of Biological Systems, Andronikashvili Institute of Physics, Tbilisi State University, Tbilisi, Georgia 2Department of Radiophysics, Erevan State University, Erevan, Armenia
Email: *[email protected]
Received November 14, 2013; revised December 5, 2013; accepted December 10, 2013
Copyright © 2013 Jamlet Monaselidze etal. This is an open access article distributed under the Creative Commons Attribution Li-cense, which permits unrestricted use, distribution, and reproduction in any medium, provided the original work is properly cited.
ABSTRACT
It is known that at low concentrations of TMPyP4, this porphyrin predominantly intercalates between GC pairs at GC-rich sites of duplex DNA and G-quadruplexes of various constructions, and stabilizes these structures. However, there are still some arguable suggestions about the exact binding sites and modes of TMPyP4 to GC-rich regions of DNA in case of helation of divalent ions with help of the porphrin, which makes porphyrin structure asymmetric. We examined TOEPyP4—analogue of TMPyP4—and studied interaction of TOEPyP4 into the calf thymus DNA at pres-ence of nanomole concentrations of one of the most important microelements in cell vital function—Zn ion. On the ba-sis of CD and absorption spectra of the DNA-TOEPyP4 mixture, it was determined that nanomole concentrations of Zn ions changed porphyrin intercalative binding mode to some external binding modes, which initiated transition of the canonic B conformation of DNA into C-like conformation, and incubation of the (DNA-TOEP4) + Zn mixture at 37˚C caused B-Z-like transition, but no transition was observed for the DNA-TOEPyP4 mixture. In particular, at 10 mM·NaCl, TOEPyP4/DNA = 0.02, the binding mode change was observed in the concentration range from 150 to 300 nM·Zn, and the B-C-like transition occurred from 150 to 600 nM·Zn. The B-Z transition at TOEPyP4/DNA = 0.015, Zn/DNA = 0.015, NaCI 10 mM, T = 37˚C was observed within incubation time interval from 0.3 to 20 hours, and maximal percents of Z-like form was seen when incubation time interval was from 5 to 6 hours.
Keywords: CD; Porphyrin; TOEPyP4; TMPyP4; B-C Transition; B-Z Transition
1. Introduction
Exclusive binding of flat TMPyP4 cation (meso-5,10,15, 20-Tetrakis-(N-methyl-4-pyridyl)) porphine porphyrin to DNA is a subject of interest in a number of fields, in- cluding molecular biology, genomics and pharmaceutical science [1-3].
It was demonstrated that TMPyP4 porphyrin that is characterized with low toxicity caries out several binding modes with DNA by intercalation between GC pairs and external groove binding. It also intercalates between stacked G-tetrads with high affinity and stabilizes the quadruplex complex, inhibits telomerase and detains growth of transformed cells in many human tumors [4,5]. This unique properties of TMPyP4 to selectively bind to
GC-rich DNA sites capable to form G-quadruplexes may be lost if TMPyP4 binds to divalent ions, due to which porphyrin structure becomes asymmetric. It was also shown that the axial ligand ZnTOEPyP4 (meso-tetra(4- N-oxyethylpyridil)) performed an external binding mode and initiated a strong increase of DNA thermopstability [6], as well as transition from B to Z-like conformation [7]. It was also shown that high concentrations of TOEPyP4 initiated transformation of poly[d(A-T)d(A-T)] but not ply(G-C) into Z-like conformation, when TOEPyP4/ DNA = 0.23 [8,9]. It should be noted that presence of physiological concentrations of alkaline-earth metal ions initiate formation of G-quadruplex in GC-rich sites of DNA, and extremely high concentrations of the same ions cause B → C and B → Z-like transitions [10,11].
In this work, we demonstrate that the B → C and B →
Z-like transitions are initiated by the change of intercala- tion to external binding mode in case of combined influ- ence of nanogram concentrations of TOEPyP and Zn ions.
2. Experiments and Methods
CD (Circular Dichroism) spectra were recorded on spec- tropolarimeter JASCO 500 A at 20˚C. Absorption spec- tra were recorded on spectrophotometer UNICAM SP 1800 (UK). For both CS and absorption spectra we used 1.0 cm quartz cells. CD is shown in millidegree of ellip- ticity. The water-soluble meso-tetra(4-N-oxyethylpyridil) porpyrin (TOEPyP4) was synthesized in ESU according to the method described in work [18]. Calf thymus DNA was purchased from Sigma. Please see [12] for more detailed information.
3. Experimental Data
3.1. Absorption Spectra
The absorption spectra of TOEPyP4 and Zn ions mixture incubated during various times at 37˚C were recorded. It was demonstrated that a complex was formed in the mixture after 45 min incubation, the spectrum of which was similar to spectrum of Zn-TOEPyP4 complex at λ = 440 nm.
The absorption spectra were recorded for TOEPyP4, native DNA-TOEPyP4, denaturated DNA-TOEPyP4, as well as (DNA-TOEPyP4) + Zn complexes incubated at 37˚C during 2, 8, and 24 hours at 10 mM·NaCI (see Fig- ure 1). It was clearly shown that incubation of triplex complrx from 0 to 24 hours did not cause any spectrum changes at 260 nm, but caused a shift of the absorption maxima of the complex to the higher wavelength area by 18 nm, i.e. a Zn-TOEPyP4 complex formation took place. Denaturation of the (DNA-TOEPyP4) + Zn complex by incubation for 24 h caused an 38% increase of the ab- sorption peak intensity at 260 nm, but it did not change intensity and wavelength of the peak initiated by porphy- rin in the Soret region (440 nm).
3.2. CD Studies
[image:2.595.355.492.85.198.2]Figure 2 shows visual and UV CD spectra of (DNA- TOEPyP4) + Zn triple complex at presence of low con- centrations of added Zn ions at 10 mM·NaCl. As it is seen from Figure 2, increase of Zn ion concentration in a narrow concentration region from 150 nM to 300 nM that corresponds to mixing molar ratio Zn/ DNA = r from 0.005 to 0.01 causes disappearance of the negative CD band at about 440 nm, which reflects intercalation bind- ing mode, and a 30%-increase of CD band maximum intensity around 420 nm, which corresponds to a groove binding mode of porphyrin [13], and a shift of the peak
Figure 1. Absorption spectra of TOEPyP4 (1), DNA (2), DNA-TOEPyP4 (3), and (DNA-ТОЕРyP4) + Zn complex incubated at 37˚C for different times: 2 h (4), 8 h (5), 24 h (6), preliminarily denaturated sample (6) at 100˚C during 15 minutes, and then cooled to 70˚C and measured at 75˚C (7). Molar ratios ТОЕРуP4/DNAbp = 0.02, Zn/DNAbp
[image:2.595.356.491.289.405.2]= 0.015; and DNA = 30 µМ in 10 mM·NaCI.
Figure 2. CD visual and UV spectra of DNA-ТОЕРyP4 complex plus Zn ions at molar mixture ratio TOEP4/DNA = 0.02, 10 mM·NaCI. DNA = 30 µM. Zn/DNA = r:0; 0.005; 0.01; 0.02, 0.027; 0,035. Insertion: Dependences of CD spectra intensity on r at 285 nm (●), 420 nm (■), and 440 nm (▲), the arrows show increase of Zn ions concentra-tion.
to the longer wavelength region by 3 - 4 nm at increase of r. Dependence of intensities of these bands on r is pre-sented in Figure 2. Figure 2 shows that the increase of Zn ions concentration causes a decrease of the positive DNA band intensity around 280 nm and splitting of this band. Dependence of band maxima at 285 nm on Zn ion concentration has S-like curve form that indicates at a cooperative change of DNA conformation.
At high concentration of Na ions (100 mM·NaCl) and mixing ratio TOEPyP4/DNA = 0.02, when the negative charge of phosphate groups were partially screened by Na ions, the impact of Zn ions in intercalative binding mode and DNA conformation was weakened. This type of binding disappears at r = 0.025, i.e. at Zn ions concen- tration that is 5 times more than at 10 mM·NaCl. Beside this, the dependence of the changes of both positive bands on r at 285 nm and 420 nm has an exponential character and occure simultaneously (see Figure 3).
Figure 3. Dependences of CD spectra intensity on r at 285 nm (▲), 420 nm (●), and 440 nm (■), at 100 mM·NaCl,
ТОЕРуP4/DNAbp = 0.02.
centration remained constant (10 and 100 mM) and por- phyrin concentration increased. For example, when TOEPyP4/DNA = 0.05 at 10 mM·NaCl, at presence of Zn ions, the intercalation binding mode disappeared at r = 0.1 (the data are not presented).
The decrease of intensity at 285 nm as a result of split- ting of the DNA positive band around 280 nm, and in- variability of the negative band around 245 nm at addi- tion of Zn ions, point at transition of the canonic B DNA form into C-like conformation, according to the pub- lished data [10].
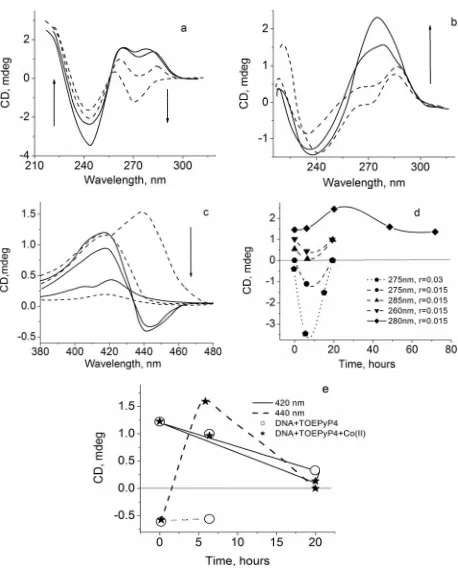
Different incubation times of the triple complex (DNA- TOEPyP4) + Zn gave us some new additional informa- tion about structures and stability of this complex. Fig- ures 4(a)-(e) present CD spectra and dependences of band intensities of DNA-TPEPyP4 and (DNA-TPEPyP4) + Zn complexes on incubation times at 37˚C and 10 mM·NaCl. The presented data show that incubation of the complexes without metals for 6 hours at 37˚C leads to some weak changes in CD spectra in visible and UV regions. Further increase of the incubation time (from 6 to 20 hours) leads to disepearence of the negative band at 440 nm and the decrease the positive band at 420 nm, as well as smoothed profile and increased intensity of the positive band around 280 nm (Figures 4(b)-(e)). The 40 h and 72 h incubations cause a good recovery of the UV CD spectra of DNA-TOEPyP4 complex, and practically full disappearance of absorption bands in the Soret re-gion. Figure 4(d) shows only the DNA-TOEPyP4 com-plex UV CD spectrum.
The other picture was observed in case of triple com- plex incubation at 37˚C. In this case, some significant changes in CD spectrum were observed in both UV and Soret regions during the first six hours. In this time in- terval, intensity of the negative band at 440 nm changed from negative sign to positive one, the positive bands of these complexes at 420 nm decreased, but splitting of the positive band of DNA at 280 nm by TOEPyP4 and metal ions at 260 nm and 285 nm was changed. In particular, the band intensity at 285 nm dropped to null, the band intensity at 260 nm weakly changed, the intensity of the
Figure 4. (a)-(c) Visual and UV CD spectra of DNA-TOEPyP4 complex (solid line) and DNA-TOEPyP4 + Zn complex (dashed line), TOEPyP4/DNAb.p = 0.015, Zn/DNAb.p = 0.015,
pH 7.02, 10 mM·NaCl; (d), (e) Dependence of the bands intensity of DNA-TOEPyP4 and DNA-TOEPyP4 + Zn com-plexes on time. DNA = 34 µM, arrows show increase of Zn ions concentration.
basic negative band at 245 nm decreased, and an indi- vidual new negative band at 275 nm appeared and its intensity reached maximum on the sixth hour of incuba- tion. Intensity of the negative band at 275 nm and the positive band at 260 nm were comparable (Figures 4(a) and (d)). This, the CD spectra of these complexes in UV region become like to spectra of Z form polynucleotide poly[d(A-T)d(A-T)] in presence of high TOEPyP4/DNA ≥ 0.23 [8,9].
4. Discussion
According to data [6-14], the cation porphyrins TOEPyP4, Me-TOEPyP4, and TMPyP4 are strong stabilizing agents of DNA, its synthetic analogues and G-quadruplexes [15]. These porphyrins bind to DNA and polynucleotides, and form two main binding modes—intercalation into GC- rich regions and external groove binding in AT-rich re-gions [8,13,16]. Both binding modes are able to transfer DNA and polynucleotides from B to Z-like conformation [8,9]. In the work [10], it was shown that transition metal ions, including Mg and Zn ions, make octahedral com- plexes Me[(H2O)6]+2 that can be high effectively absorbed
[image:3.595.104.236.83.193.2]pable to wind the double helix and cause narrowing of minor groove of the duplex, and this narrowing leads to transition of DNA from B form to C-like and T-like conformations [10].
We suggest that the observed B-C-like transition in case of the triple complex occurs due to the joint influ- ence of porphyrin and a metal ion on DNA in which TOEPyP4 is an initiator of this transition. In particular, the surface near groove and groove bindings at AT-rich sites [13] initiate formation of a C-like conformation in those local regions. Addition of nanomole concentrations of Zn ions that effectively bind to these regions due to a steric compliances of a hydrated ion with size of minor groove of the C-like DNA causes further effective wind- ing of C-like conformation helix that leads to narrowing a minor groove and decrease of the distance between flats of DNA base pairs [17]. As a result, due to the steric conditions of TOEPyP4, it cannot stay intercalated and moves into the solution, it does not bind to Zn ions for a short period of time (see above and also Figure 1) and forms a surface groove binding that causes some changes to CD spectra, namely, disappearance of the negative band at about 440 nm, increase of the positive band at 420 nm by 30% in Soret region, decrease of the positive band at 285 nm, and invariability of the negative band at 245 nm. All of these demonstrate the B → C transition of DNA (see Figure 2).
A different picture was observed when incubation of DNA-TOEP4 complex at presence of Zn ions. In this case, because of the fact that the binding constant of TOEPyP4-DNA is by two orders of magnitude than the binding constant of Me-DNA [18,19], after some minutes at 37˚C, TOEPyP4 occupies the same sites that have been occupied by the metal ions, and then this porphyrin binds to those metals forming Zn-TOEPyP4 complex form two modes of binding. These binding modes are re- flected on CD spectra as two positive bands with maxima at about 420 nm and 440 nm (Figure 4(c)). The intensi-ties of these bands are significantly higher in comparison with the some bands at 20˚C at identical TOEPyP4/DNA ratios [12]. Consequently, the influence of Zn-TOEPyP4 complex on DNA at 37˚C is more effective than at 20˚C. We suppose that this is the main factor that provokes DNA transition from B to Z-like conformation, which happens slowly—within 6 hours of incubation.
5. Summery
Analysis of the obtained CD and spectrophotometer re- sults revealed the following: 1) combined influence of nanomole concentrations of Zn ions and cation TOEPyP4 porphyrin initiates a DNA transition from its canonic B form to C-like conformation; and 2) B → Z transition of DNA in (DNA-TOEPyP4) + Zn mixture appears due to an external binding of ZnTOEPyP4 to DNA, at 37˚C.
We think that these data will be interesting for phar- macologists and medical specialists who use the above mentioned porphyrins in cancer chemotherapy, because divalent ion concentration is increased in many human cancers compared to the norm.
6. Acknowledgements
This work is supported by the IPP/ISTC A-1951 Project.
REFERENCES
[1] C. L. Grand, H. Han, R. M. Munoz, S. Weitman, D. D. Von Hoff, L. H. Hurley and D. J. Bearss, “The Cationic Porphyrin TMPyP4 Down-Regulates c-MYC and Human Telomerase Reverse Ttranscriptase Expression and Inhib- its Tumor Growth in Vivo,” Molecular Cancer Therapeu- tics, Vol. 1, No. 8, 2002, pp. 565-573.
[2] N. Nagesh and A. Ganesh Kumar, “Interaction of TMPyP4, TMPyP3, and TMPyP2 with Intramolecular G-Quadruplex Formed by Promoter Region of Bcl2 and KRAS NHPPE,” ISRN Biophysics, Vol. 2012, 2012, Ar- ticle ID: 786596.
[3] D. J. Cashman, R. Buscaglia, M. W Freyer, J. Dettler, L. H. Hurley and E. A. Lewis, “Molecular Modeling and Biophysical Analysis of the c-MYC NHE-III1 Silencer Element,” Journal of Molecular Modeling, Vol. 14, No. 2, 2008, pp. 93-101.
http://dx.doi.org/10.1007/s00894-007-0254-z
[4] E. Izbicka, R. T. Wheelhouse, E. Raymond, K. K. Davi-son, R. A. Lawrence, D. Sun, B. E. Windle, L. H. Hurley and D. D. Von Hoff, “Effects of Cationic Porphyrins as G-Quadruplex Interactive Agents in Human Tumor Cells,”
Cancer Research, Vol. 59, No. 3, 1999, pp. 639-644. [5] Z. Zhang, J. Dai, E. Veliath, R. A. Jones and D. Yang,
“Structure of a Two-G-Tetrad Intramolecular G-Quadru- plex Formed by a Variant Human Telomeric Sequence in K+ Solution: Insights into the Interconversion of Human
Telomeric G-Quadruplex Structures,” Nucleic Acids Re- search, Vol. 38, No. 3, 2008, pp. 1009-1021.
http://dx.doi.org/10.1093/nar/gkp1029
[6] J. Monaselidze, G. Majagaladze, Sh. Barbakadze, D. Khachidze, M. Gorgoshidze, Y. Kalandadze, S. Harouti- unian, Y. Dalyan and V. Vardanyan, “Microcalorimetric Investigation of DNA, Poly(Da)Poly(Dt) and Poly[D(A- C)]Poly[D(G-T)] Melting in the Presence of Water Solu- ble (Meso Tetra (4 N Oxyethylpyridyl) Porphyrin) and Its Zn Complex,” Journal of Biomolecular Structure and Dynamics, Vol. 25, No. 4, 2008, pp. 419-424.
http://dx.doi.org/10.1080/07391102.2008.10507190 [7] Y. Dalyan, S. Haroutiunian, G. Ananyan, V. Vardanyan,
V. Madakyan, R. Kazaryan, L. Saakyan, L. Messory, P. Orioli and A. Benight, “Interaction of Meso-Tetra-(4-N- oxyethylpyridyl) Porphyrin, Its 3-N Analog and Their Metallo-Complexes with Duplex DNA,” Journal of Bio- molecular Structure and Dynamics, Vol. 18, No. 5, 2001, pp. 677-687.
intercalative Binding of Large Cationic Porphyrin Ligand to Polynucleorides,” Nucleic Acids Research, Vol. 11, No. 17, 1983, pp. 6141-6153.
http://dx.doi.org/10.1093/nar/11.17.6141
[9] R. T. Fiel, “Porphyrin Nucleic Acid Interaction,” Journal of Biomolecular Structure and Dynamics, Vol. 6, No. 6, 1989, pp. 1259-1274.
http://dx.doi.org/10.1080/07391102.1989.10506549 [10] V. I. Ivanov, L. E. Minchenkova, A. K Schyolkin and A. I.
Poletoyev, “Different Conformations of Double-Stranded Nucleic Acid in Solution as Revealed by Circular Di- chroism,” Biopolymers, Vol. 12, No. 1, 1973, pp. 89-110. http://dx.doi.org/10.1002/bip.1973.360120109
[11] K. Jaroslav, I. Kejnovská, D. Renčiuk and M. Vorlíčková, “Circular Dichroism and Conformational Polymorphism of DNA,” Nucleic Acids Research, Vol. 37, No. 6, 2009, pp. 1713-1725. http://dx.doi.org/10.1093/nar/gkp026 [12] J. Monaselidze, E. Kiziria, M. Gorgoshidze, D.
Kha-chidze, M. Kiladze, E. Lomidze, H. Margaryan and N. Hakobyan, “CD and DSC Investigation of Individual and Complex Influence of Meso-Tetra(4-Oxiethylpyridil) Por- phyrin (TOEPyP4) and Its Zn-Complex on DNA,” Ame- rican Journal of Analytical Chemistry, Vol. 3, No. 10, 2012, pp. 698-703.
[13] S. Lee, Y. A. Lee, J. Y. Lee, D. H. Kim and S. K. Kim, “Rotation of Periphery Methylpyridine of Meso-Tetra- kis(n-N-Methylpyridiniumyl)Porphyrin (n = 2, 3, 4) and Its Selective Binding to Native and Synthetic DNAs,”
Biophysical Journal, Vol. 83, No. 1, 2002, pp. 371-381. http://dx.doi.org/10.1016/S0006-3495(02)75176-X
[14] J. Monaselidze, M. Kiladze, M. Gorgoshidze, D. Kha- chidze, V. Bregadze, E. Lomidze and T. Lezhava, “Mi- crocalorimetric Study of DNA-Cu(II)TOEPyP4 Porphy- rin Complex,” Journal of Thermal Analysis and Calo- rimetry, Vol. 108, No. 1, 2012, pp. 127-131.
[15] J. M. Dettler, R. Le. Buscaglia and E. A. Lewis, “DSC Deconvolution of the Structural Complexity of c-MYC P1 Promoter G-Quadruplexes,” Biophysical Journal, Vol. 100, No. 6, 2011, pp. 1517-1525.
http://dx.doi.org/10.1016/j.bpj.2011.01.068
[16] M. Benett, A. Krah, F. Wien, F. Carman, R. Mekenna, M. Sanderson and S. Neidle, “A DNA-Porphyrin Minor- Groove Complex at Atomic Resolution: The Structural Consequences of Porphyrin Ruffing,” Proceedings of the National Academy of Sciences, Vol. 97, No. 17, 2000, pp. 9476-9481. http://dx.doi.org/10.1073/pnas.160271897 [17] W. Saenger, “Principles of Nucleic Acid Structure,”
Springer, New York, 1984.
http://dx.doi.org/10.1007/978-1-4612-5190-3
[18] M. A. Sari, J. P. Battioni, D. Dupré, D. Mansuy and J. B. Le Pecq, “Interaction of Cationic porphyrins with DNA: Importance of the Number and Position of the Charges and Minimum Structural Requirements for Intercalation,”
Biochemistry, Vol. 29, No. 17, 1990, pp. 4205-4215. http://dx.doi.org/10.1021/bi00469a025
[19] T. Ohyama, H. Mita and Y. Yamamoto, “Study on the Complexation between DNA and Cationic Porphyrin De- rivatives,” Nucleic Acids Symposium Series, Vol. 48, No. 1, 2004, pp. 137-138.