by
Hamed Sadeghi Neshat
B.Sc., Sharif University of Technology, Tehran, Iran, 2009
a Thesis submitted in partial fulfillment of the requirements for the degree of
Master of Science in the School
of
Computing Science
c
Hamed Sadeghi Neshat 2011 SIMON FRASER UNIVERSITY
Summer 2011
All rights reserved. However, in accordance with theCopyright Act of Canada, this work may be reproduced, without authorization, under the conditions for Fair Dealing. Therefore, limited reproduction of this work for the purposes of private study, research, criticism, review and
news reporting is likely to be in accordance with the law, particularly if cited appropriately.
APPROVAL
Name: Hamed Sadeghi Neshat
Degree: Master of Science
Title of Thesis: Effective Online Advertising
Examining Committee: Dr. Joseph G. Peters, Professor of Computing Science Chair
Dr. Mohamed Hefeeda
Senior Supervisor
Associate Professor of Computing Science
Dr. Alexandra Fedorova
Supervisor
Assistant Professor of Computing Science
Dr. Jiangchuan Liu
Examiner
Associate Professor of Computing Science
Date Approved:
Advertising in the Internet is a wide, attractive and growing market. In this market, revenue of websites that host ads depends on the number of user clicks received on displayed ads. Thus, in order to increase the revenue, websites try to select top ads and rank them based on their quality. Ad quality depends on different factors, such as relevance of ads to the users who are surfing a web page, relevance of ads to web page contents, and previous performance of ads. In this thesis, we adreesss research problems related to improving online advertising. More specifically, we investigate the problems of choosing the most relevant ads to users. We divide this problem into two related sub-problems. The first problem is predicting the quality of new ads in search engines. The second problem is matching ads with online videos. We propose novel approaches related to each problem, and show that they outperform them against other existing approaches in the literature.
Keywords: Online Advertising, Ad quality, Click Through rate, Search Engines, Online Videos;
Acknowledgments
I would like to express my deepest gratitude to my senior supervisor, Dr. Mohamed Hefeeda, for mentoring me in the past two years with his patience and knowledge. It was his guidance and encouragement that taught me how to do research, and without his support, completion of this thesis would not have been possible for me.
I would like to express my gratitude to Dr. Alexandra Fedorova, my supervisor, and Dr. Jiangchuan Liu, my thesis examiner, for being on my committee and reviewing this thesis. I also would like to thank Dr. joseph peters for taking the time to chair my thesis defense. Last but certainly not least, I want to express my gratitude to my family for their constant support and patience. I will never forget what I owe them, and my eternal gratitude to them cannot be expressed by words. I owe my deepest gratitude to my parents and fiancee “Ila Nejati” for their love and endless support.
Approval ii
Abstract iii
Acknowledgments iv
Contents v
List of Tables viii
List of Figures x
1 Introduction 1
1.1 Introduction . . . 1
1.2 Problem Statement and Thisis Contributions . . . 3
1.2.1 Thesis Contributions . . . 4 1.3 Thesis Organization . . . 5 2 Background 6 2.1 Online Advertising . . . 6 2.2 Auction Models . . . 7 2.2.1 Vickrey-Clarke-Groves Auction . . . 8
2.2.2 The Generalized Second Price Auction . . . 9
2.3 Payment Models . . . 10
2.4 Ad Quality . . . 11
2.5 Advertising In Online Videos . . . 12
3 Predicting Quality for New Ads 14
3.1 Introduction . . . 14
3.2 Related Work . . . 15
3.3 Proposed Method . . . 16
3.3.1 Overview . . . 16
3.3.2 Finding Similar Ads . . . 18
3.3.3 Finding Average Terms CTR . . . 20
3.3.4 Prediction Quality Score . . . 20
3.4 Evaluation . . . 20
3.4.1 Data Collection . . . 21
3.4.2 Models for Quality Scores . . . 22
3.4.3 Optimization of Parameters . . . 25
3.4.4 Methodology . . . 28
3.4.5 Comparison with Other Methods . . . 28
3.4.6 Analysis of the Proposed Method . . . 29
3.5 Limitation of Proposed Approach . . . 31
3.6 Summary . . . 31
4 Matching Ads with Online Videos 33 4.1 Introduction . . . 33
4.2 Related Work . . . 35
4.3 Proposed Approach . . . 36
4.3.1 System overview . . . 36
4.3.2 Finding Interests of Target Audience . . . 38
4.3.3 Finding Target Audience of video . . . 38
4.3.4 Finding Candidate Ads and Ranking them . . . 40
4.4 Evaluation . . . 41 4.4.1 Data Collection . . . 41 4.4.2 Methodology . . . 42 4.4.3 Results . . . 45 4.5 Summary . . . 48 vi
5.2 Future Work . . . 50
Bibliography 52
List of Tables
3.1 Statistics of the dataset models. . . 25 3.2 α and β values in different data models. . . 27 3.3 w1 and w2 values in different data models. . . 27
3.4 Comparison with previous methods in the literature (First model for quality score). . . 29 3.5 Comparison with previous methods in the literature (Second model for quality
score). . . 29 3.6 Comparison with previous methods in the literature (Third model for quality
score). . . 30 3.7 Impact of different parts of our method on the performance with first data
model. . . 30 3.8 Impact of different parts of our method on the performance with second data
model. . . 30 3.9 Impact of different parts of our method on the performance with third data
model. . . 31
4.1 Audience Segments [1]. . . 38 4.2 Top 10 items teens plan to buy with their own money (data for teenagers
between 13 and 17 years old in USA). . . 39 4.3 Teen’s interests mapped to interests’ topics. . . 42 4.4 Interesting Topics to teenagers, missed topics have zero weight (Between 13
and 17 years old). . . 42 4.5 Interesting Topics to Youth, missed topics have zero weight (Between 18 and
24 years old). . . 43
4.7 Comparison between different ad matching systems. . . 46
List of Figures
2.1 Example of Vickrey Clarke Groves Auction. . . 9
3.1 Overview of the proposed method for predicting quality of new ads. . . 17
3.2 Distribution of ads in first data model (lower ranks number shows better quality). . . 23
3.3 Distribution of ads in second data model (higher rank shows better quality). . 24
3.4 Distribution of ads in third data model (higher rank shows better quality). . 24
3.5 Mean error for different cluster numbers and threshold values with NED. . . 25
3.6 Mean error for different cluster numbers and threshold values with X2. . . 26
3.7 Mean error for different threshold values. . . 27
4.1 A sample video from YouTube with an inserted ad. . . 34
4.2 High-level architecture of the proposed system. . . 37
4.3 Products categories . . . 44
4.4 Sample result for our our system. The video target audience are teenagers, and the inserted ad is related to their interests. . . 45
4.5 Sample result for YouTube. The video target audience are teenagers, but the inserted ad is not related to their interests. . . 46
4.6 Sample result for our our system. The video target audience are teenagers, and the inserted ad is related to their interests. . . 47
4.7 Sample result for YouTube. The video target audience are teenagers, but the inserted ad is not related to their interests. . . 47
Introduction
In this chapter, we briefly introduce online advertising. Then, we describe the problem addressed in this thesis and summarize our contributions. The organization of this thesis is given at the end of this chapter.
1.1
Introduction
The Internet is experiencing extraordinary growth. This growth not only accelerates the information flow, but also introduces new business opportunities. More particularly, the Word Wide Web (WWW) appears to be an ideal space for businesses attempting to promote their services [2]. The online advertising industry is growing and developing at a rapid rate. Since 1994 when online advertising originated, the industry has faced many obstacles. After the dot com crash in 2001, online advertising’s success diminished, but has since re-established itself and is a thriving multi billion dollar industry [3].
The growth of online sponsored search markets encourages businesses to evaluate the advantages and disadvantages of advertising online. Businesses are recognizing that by ad-vertising online, their message is communicated in a fast and efficient way, while not only interacting with customers, but establishing a one-to-one dialog [4]. Online advertising is creating innovative, low cost and highly targeted opportunities, while expanding into other media related to the web. One major benefit of online advertising is the immediate publish-ing of information and content that is not limited by geography or time. Another benefit is the efficiency of the advertiser’s investment. Online advertising allows for the customization of advertisements, including content and posted websites. For example, Google AdWords,
CHAPTER 1. INTRODUCTION 2
Yahoo! Search Marketing and Google AdSense enable ads to be shown on relevant web pages or alongside search results. As a result, people can see ads that are useful and relevant to them, and ads become a valuable form of information in their own right.
Nowadays, hundreds of thousands of advertisers worldwide use advertising programs to promote their products and services on the web. Thus, online advertising becomes the main source of revenue for majority of web sites such as Google, YouTube and Facebook. For example, Google’s total advertising revenues were $29 billion in 2010, which is 24% more than the previous year. This emphasizes the fact that online advertising is a multi-billion dollar industry with expected high growth rate in the coming years [5].
Roughly speaking, online ads are served to web users in two main steps [6, 7]:
1. Finding relevant ads: Advertisers associate keywords to their ads. When a web user submits a query on a search engine, all ads with keywords related to the search query are put into an auction [7].
2. Selecting top ads for inserting on the result pages: Ads are positioned in the returned result pages based on their ranks. The ad with the highest Ad Rank appears in the first position, and so on down the page. The rank of an ad is given by:
AdRank=CP C∗QualityScore, (1.1)
where CPC is the cost per click, which is provided by the advertiser. The Quality Score depends on various factors including the click through rate (CTR) of the ad. We note that the Quality Score usually considers other factors such as the history of the advertiser’s accounts. There are multiple models for payment in online advertising. Among all of them, Cost Per Click (CPC) which is also known as Pay Per Click (PPC) is the most popular one [8]. Currently, Google AdWords, Yahoo! Search Marketing and Microsoft AdCenter use CPC as the underlying payment model. In this model, advertisers pay each time a user clicks on their listing and is redirected to their website. Advertisers do not actually pay for the listing, they pay only when the listing is clicked on. Thus, in order to maximize the expected revenue in Cos Per Click model, ad host websites must find and insert ads with the highest probability that user clicks on them.
1.2
Problem Statement and Thisis Contributions
Our goal is to improve the quality. The quality in this context means the relevancy of the ads to users consuming online contents in which the ads are inserted. Online ads can be text messages, images, and short video clips. This ads can be inserted in Web pages returned by search engines in response to queries submitted by users. Ads can also be displayed next to videos returned by online video sites such as YouTube. We propose new methods to increase the relevancy of ads to users, which enhance users satisfaction and increase the revenues of the web sites hosting the ads. This Thesis studies two problems related to this goal.
Problem 1 (Predicting Quality of new Ads) Design a method to predict the quality of new ads. The method has to be computationally efficient in order to handle the large volume of new ads.
The number of eligible advertisements matching a given query usually far exceeds the number of available slots on the page. For example, In Google search result pages, there are just 8 ad spots on side of the page, and 3 ad spots on top of the page. Moreover, most users never go beyond the first page of search results. Due to the limited number of available ad spots on the pages and in order to maximize the expected revenue, search engines have to insert the most attractive ads. To that end, search engines must insert those ads with the highest quality. According to Eq. (1.1), historical information is needed to compute the quality scores and in turn the ranks of ads. Historical performance logs such as click-through rates is the most obvious measure for estimating the CTR of ads. However, for new ads entering into the system it is very difficult to estimate the CTR as there is little or no information available through the click-through logs. Since search engines continuously receive new ads that have not been displayed before, search engines need a method to estimate the quality scores of these new ads. Accurate estimation of the quality scores of new ads is critical, since it determines which ads (from the old and and new ones) are displayed to users.
Problem 2 (Matching Ads with videos) Assume we have a video sharing web site such as YouTube. Propose an approach to match ads with online videos based on the shopping interests of the target audience of videos.
Internet video sites try to attract more advertisers to increase their revenues. These sites typically offer tools to suggest keywords for ads and to match ads with videos. When users
CHAPTER 1. INTRODUCTION 4
search for and retrieve videos, ads associated with these videos are displayed to users. Most current Internet video sites, including YouTube, attach ads to videos based on matching the ads keywords with the metadata describing the contents of the videos. Some sites also try to automatically create descriptions for videos by analyzing their visual contents and/or their audio signals after converting them to texts. That is, ads and videos that have similar contents are associated with each other. For example, if a video contains information about cars, ads related to cars are likely to be attached to this video.
The current approach for matching ads with videos assumes that if a user is watching a video about a specific subject, s/he will be interested in buying goods and services related to that subject. This assumption is not always true, because the purchasing or shopping interests of a user do not necessarily match the contents of videos s/he watches online. Displaying ads relevant to the shopping interests of target audience of a video would have probably attracted more attention (clicks) from viewers, and thus would have generated more revenues for both the advertisers and online video sharing web sites (as they typically charge based on the Cost Per Click model).
1.2.1 Thesis Contributions
In this thesis, we propose solutions to increase the effectiveness of online advertising. Par-ticularly, our contributions can be summarized as follows [9]:
• We propose a new method to predict the quality scores of new ads. The proposed method finds existing ads that are semantically similar to the new ads. It then esti-mates the quality scores of the new ads based on their corresponding similar ads.
• We implement the quality score prediction schema. The implemented system is able to work with large datasets (hundreds of thousands of ads), and return results in reasonably short time. Our conducted study shows the proposed method can meet defined expectations.
• We propose a novel approach to match ads with online videos based on the shopping interests of the target audience of videos. The goal of our approach is to maximize the number of users who purchase goods and services offered by advertisers. Our approach increases the relevance of ads to the actual viewers (humans) of videos, which is unlike
the current approach that maximizes the relevance of ads to the contents of videos (objects).
• We implement the ad matching method called SmartAd. We conduct a subjective study of our system, and show that the proposed method can increase user satisfaction in comparison with the current approach used YouTube.
1.3
Thesis Organization
The rest of this thesis is organized as follows: Chapter 2 provides a brief description of online adverting and its different models. In Chapter 3, we present, analyze, and evaluate our proposed method for predicting new ads quality score. Chapter 4 presents our proposed approach to match ads with online videos based on the shopping interests of the target audience of videos. We evaluate this approach using a subjective study in the same chapter. Finally, we conclude this thesis and highlight future research directions in Chapter 5.
Chapter 2
Background
In this chapter, we present an overview of online advertising and in particular online ad-vertising in search engines. We also describe different models of online auctions, which are employed in online advertising. More details about sponsored search markets can be found in [8] and the references therein.
2.1
Online Advertising
Advertising is any paid form of non-personal communication about an organization, prod-uct, service or idea by an identified sponsor. Advertising was originally established in print media, such as newspapers and magazines, and followed onto the television and radio broadcast scene. However, due to the popularity of online services, advertising has started to shift away from the traditional print and broadcast media, towards the growing online advertising industry. Generally speaking, online advertising is a form of promotion that uses the Internet and the World Wide Web for the purpose of delivering marketing mes-sages to attract customers. Examples of online advertising include contextual ads on search engine results pages, banner ads, rich media ads, social network advertising, interstitial ads (placing a commercial messages between the current and destination page), online classified advertising, advertising networks and e-mail marketing, including e-mail spam [10].
Online advertising has multiple parts, which can be summarized as follows: Advertisers enter their ads with associated keywords and bid into the system based on a payment model. When a web user submits a query to a search engine, all ads with keywords related to the search query are put into an auction. After performing the auction, winner ads will
be selected to be inserted on the page. Ad selection depends on various factors including offered bid, account history of advertiser, and history log of ad performance. Generally, each ad has an associated score computed by E.q. (2.1):
Ad Score=Of f ered Bid×Quality Score. (2.1)
Depending on the auction model, ad selection may or may not depend on quality of ads. In Section 2.2, we describe different auction models with more details. Information about ad quality measurement is presented in Section 2.4. After selecting and displaying ads, advertisers have to pay for the purchased ad spot. To do that, there are multiple ways. The three most common ways in which online advertising is purchased are CPM (Cost Per Mille), CPC (Cost Per Click), and CPA (Cost Per Action). Section 2.3 provides more details about different payment models including three mentioned models.
2.2
Auction Models
For assigning ad spots on the page, search engines determine prices using an auction proce-dure, in which they solicit bids from the advertisers. There are multiple slots for displaying ads, and some are more valuable than others. Designing an auction for selling ad spots contains different considerations:
• If the search engine knew all the advertisers valuations for clicks, the situation could be represented directly as a matching market. There are some ad spots on the page, and advertisers will submit their bids. Then, the auction will simply assign ad spots to advertisers as follows: higher bids, better ad spots on the page.
• If the advertisers valuations are not known, then we need to think about ways of encouraging truthful bidding, or to deal with the consequences of untruthful bidding. The Vickrey-Clarke-Groves (VCG) mechanism is an auction model that offers Truth-Telling as a Dominant Strategy [11].
• The VCG mechanism provides a natural way to set prices in matching markets, includ-ing those arisinclud-ing from keyword-based advertisinclud-ing. However, for various reasons (some of them are listed in [12]), it is not the procedure that the search industry adopted. The Generalized Second-Price Auction (GSP) is another auction model which is more common in sponsored search markets [8].
CHAPTER 2. BACKGROUND 8
2.2.1 Vickrey-Clarke-Groves Auction
In the early days of the search industry, variants of the simple auction were used: advertisers were simply asked to report their revenues per click in the form of bids, and then they were assigned slots in decreasing order of these bids. But, when bidders are simply asked to report their values, they will generally under-report their true values. Bids were shaded downward, below their true values. Since the auctions were running continuously over time, advertisers constantly adjusted their bids by small increments to experiment with the outcome and to try slightly outbid competitors.
William Vickrey, Edward Clarke, and Theodore Groves proposed the VCG auction mech-anism [13–15]. Vickrey-Clarke-Groves (VCG) is an auction model which is introduced to encourage advertisers to bid their true values. The idea in VCG is that items are assigned to maximize the sum of utilities. Then each player pays the “opportunity cost” that his/her presence introduces to all the other players. For example, assume we have three ad spots on a search result page, and five advertisers who want to buy these slots. Advertisers A, B, C, D, and E are willing to pay $10, $8, $6, $4, and $2 respectively for the best spot on the result page. Since there are only 3 ad spots available on the page, they will be assigned to A, B, and C; D and E will not get anything. In VCG, winners have to pay the value that presence of them damage to the system. In order to find what prices this auction principle dictates for each advertisers, VCG works as follows (Figure 2.1 shows the following procedure):
• First, in the optimal matching without advertiser A present, advertisers B, C, and D get ad spots . This means the search engine will receive $8 + $6 + $4 = $18 from advertisers. Thus, A should pay $18 to the search engine.
• In the optimal matching without advertiser B present, advertiser A still gets the first spot. Other spots will be assigned to advertisers C and D. This means the search engine will get $6 + $4 = $10 from advertisers. Thus, B should pay $10 to the search engine.
• In the optimal matching without advertiser C present, advertisers A and B still get the first and second spot. Then other spot will be assigned to advertiser D. This means the search engine will receive $4 from advertiser. Thus, C should pay $4 to the search engine.
Figure 2.1: Example of Vickrey Clarke Groves Auction.
B, and C each get the same ad spot they would have gotten had D and E been there. D and E cause no harm to the rest of the world, and so their VCG payoff is 0.
As it is presented in the above example, VCG makes advertisers to pay different values than they bid. Thus, if ad spots are assigned and prices computed according to the VCG procedure, then truthfully announcing bids is a dominant strategy for each advertiser, and the resulting assignment maximizes the total valuation of any perfect matching of slots and advertisers. The proof is given in [8].
2.2.2 The Generalized Second Price Auction
After some initial experiments with other models, major search engines such as Google and Yahoo realized that advertisers are not wiling to pay more than their offered bid. For example, an advertiser in position i is not willing to pay more, just because of auction rules which for example exist in VCG. Moreover, understating auction rules and deal with them in VCG is not convenient for majority of advertisers [16]. Due to this fact, the main search engines such as Google have adopted a procedure for selling advertising slots called the Generalized Second Price auction (GSP) [16]. Although GSP looks similar to the Vickrey-Clarke-Groves (VCG) mechanism, its properties are different. In particular, unlike the VCG
CHAPTER 2. BACKGROUND 10
mechanism, truth-bidding in GSP is not a dominant strategy [17].
In the GSP procedure, each advertiser A announces a bid consisting of a single number
Ab, which is the price it is willing to pay. As usual, it is up to the advertiser whether or not its bid is equal to its true valuation. Then, after each advertiser submits a bid, the GSP procedure awards each slotito the ith
highest bidder, at a price equal to the (i+ 1)st highest bid. In other words, each advertiser who is shown on the result page is paying a price equal to the bid of the advertiser just below it. However, GSP in search engine has a little modification compared to its original version. In the new GSP auction, an advertiser in position i pays a price per click equal to the bid of an advertiser in position (i + 1)plus a minimum increment (typically $0.01). This second-price structure makes the market more user friendly and less susceptible to gaming. More information about GSP are available in [8].
2.3
Payment Models
In this section we will briefly describe different payment models in online auctions [6,10,18]. A payment model specifies when an advertiser pays a search engine for an ad. the value of the payment is computed from the auction model used by the search engine to determine the winning ad to be displayed to users.
• CPV (Cost Per View) is when an advertiser pays for each unique user view of an advertisement or website.
• CPC (Cost Per Click) is also known as Pay Per Click (PPC). Advertisers pay each time a user clicks on their listing and is redirected to their websites. They do not actually pay for the listing, but only when the listing is clicked on. CPC differs from CPV in that each click is paid for regardless of whether the user makes it to the target site.
• CPM (Cost Per Mille), also called Cost Per Thousand (CPT), is where advertisers pay for exposure of their message to a specific audience. Per mille means per thousand impressions, or loads of an advertisement.
• CPA (Cost Per Action) advertising is performance based and is common in the affiliate marketing sector of the business. In this payment scheme, the publisher takes all
the risk of running the ad, and the advertiser pays only for the number of users who complete a transaction, such as a purchase or sign-up. This model ignores any inefficiency in the sellers web site functionality.
• CPE (Cost Per Engagement) is a form of Cost Per Action pricing. Differing from Cost Per Click model, a CPE model means advertising impressions are free and advertisers pay only when a user engages with their specific ad unit. Engagement is defined as a user interacting with an ad in any number of ways.
2.4
Ad Quality
In online advertising users look at the thumbnail description of an ad placed in a given slot and this will affect whether they click on the ad. This scenario becomes more important when web sites use cost per click model. From the search engines point of view, the wor-risome scenario is that a low-quality advertiser bids very highly, thus obtain the first slot under GSP. Users are then not interested in clicking on this ad. As a result, it sits at the top of the list as the high bidder, but the search engine makes almost no money from it because users rarely click on the ad. Search engines such as Google address this problem as follows: They rank ads based on the scores that include or represent the quality. E.q (2.1) shows one form of using ad quality to compute ad score.
The formula for Quality Score varies for different search engines. While they continue to refine their quality score formulas, the core components remain more or less the same [19] [20] [21] [22]:
• The historical click through rate (CTR) of the keyword and the matched ad on search engines.
• The account history, which is measured by CTR of all ads and keywords in advertiser account.
• The historical CTR of the display URLs in the ad group.
• The quality of the advertiser landing page.
• The relevance of the keyword to the ads in its ad group.
CHAPTER 2. BACKGROUND 12
• The account performance in the geographical region where the ad will be shown.
description
2.5
Advertising In Online Videos
With tens of millions of videos available online today and millions being added each month, Internet users can view videos never accessible before. Users can easily go through websites to watch a variety of online videos from professionally produced television show to a 10-second clip that somebody recorded from a baby. We can categorize online videos as follows [23]:
• Premier Programming: gives users professionally produced content, generally, from Broadcast Video and Cable Networks.
• Professionally-Generated Specialty Programming: video content professionally but generally created for a specific subset of online video users. Whether it is original content for the web or content from traditional media like local news or community events, users are searching for and consuming video content relevant to their interests.
• User-Generated Video: consists of clips created and uploaded by everyday people. Generally, the majority of these clips are watched by a small group of users, but due to accessibility of them through the world, some become extremely popular and are viewed by millions.
Although online video does not yet have as much audience as traditional broadcast and cable TV have, but online video sharing continues to grow its accessibility, and increases content offerings via the world Wide Web. Previously, video advertising was more common in first category of videos, but appearance of video sharing web sites such as YouTube shifted this market to User-Generated Videos. Currently, advertising in online videos is the second largest market after search engine advertising in the World Wide Web [24].
Advertising in online videos is not too much different from advertising in search engines. They are only few differences in ad format and ad targeting. Unlike search engines which usually use text ads, advertising in online video lets advertisers to use various kinds of ads including text ads, overlay ads, and video clip ads. There is also another difference about
targeting users. More specifically, contextually targeted ads complement the video content, allows users to find the products and services more related to their needs. For example, Google’s targeting technology in YouTube and large pool of advertisers allows contextually targeted ads to appear on various categories of video content, including cooking shows, comedy sketches, product reviews, and entertainment clips [25]. Similar to advertising in search engines, online video advertising has different payment models. More specifically, all payment models which were described in Section 2.3, exist in video advertising as well, but Cost Per View (CPV) and Cost Per Click (CPC) are more common [18].
Chapter 3
Predicting Quality for New Ads
In this chapter, we present the proposed method for predicting the quality of new ads.3.1
Introduction
Internet advertising is the main source of income for search engines. For example, Google reported $6,475 billion revenue from advertisement in 2009 which is 8% more than the previous year [26]. This emphasizes the fact that online advertising is a multi-billion dollar industry with expected high growth rate in the coming years.
Roughly speaking, online advertising works in two steps [6, 7]:
1. Finding relevant ads: Advertisers associate keywords to their ads. When a web user submits a query on a search engine, all ads with keywords related to the search query are put into an auction [7].
2. Selecting top ads for inserting on the result pages: Ads are positioned on the returned result pages based on their ranks. The ad with the highest Ad Rank appears in the first position, and so on down the page. The rank of an ad is given by:
AdRank=CP C∗QualityScore, (3.1)
where CPC is the cost per click, which is provided by the advertiser and shows how much the advertiser is willing to pay for each click on the ad. The Quality Score depends on various factors including most importantly the click through rate (CTR) of the ad. If an ad
is displayedntimes and receivedmclicks, search engines associatem/nas its click through rate [6]. The click through rate is an important metric as it directly impacts the revenue of search engines. We note that the Quality Score usually considers other factors such as the history of the advertiser’s accounts.
According to Eq. (3.1), historical information is needed to compute the quality scores and in turn the ranks of ads. Since search engines continuously receive new ads that have not been displayed before, search engines need a method to estimate the quality scores of these new ads. Accurate estimation of the quality scores of new ads is critical, since it determines which ads (from the old and and new ones) are displayed to users. In this chapter, we propose a new method to predict the quality scores of new ads. The proposed method finds existing ads that are semantically similar to the new ads. It then estimates the quality scores of the new ads based on their corresponding similar ads. The proposed method is unlike previous methods in the literature, e.g., [27–29], which tend to use use general features such as number of words in ad and type of URL of other existing ads. Using a set of general features might not work for different contexts. For example, although good description in a car financial company related ad is important, it is not much important for an ad about a new perfume, where users usually look for the brand names in the title or URL [30].
We have implemented our method and compared it against the most recent methods in the literature using large-scale traces collected from a major search engine (Google). Our results show that the proposed method produces more accurate predictions than the previous methods. Moreover, unlike other methods which require offline pre-processing to create complex prediction models, our approach requires only light weight computation and can run in real time.
3.2
Related Work
Ashkan et al. [27] estimate the click through rate based on the total number of ads on the page, rank of ads, and the intent underlying the query for which the ad is displayed. Richardson et al. [31] build a prediction model for click through rate based on logistic regression using historical data and existing ads. They find 81 different features for ads and divide them into five categories which are Appearance, Attention Capture, Reputation, Landing Page Quality and Relevance. They use extracted features of new ads as the model inputs to predict click through rate of new ads. Dembczynski et al. [32] propose an approach
CHAPTER 3. PREDICTING QUALITY FOR NEW ADS 16
for predicting click through rates for new ads based on decision rules. They extract features from existing ads and create decision rules which vary the value of predicted click through rate based on existence of those features in the new ads.
Choi et al. [28] do not evaluate ads based on user clicks. Rather, they propose a technique for finding ad quality. They explore different techniques for extracting document summary to select useful regions of landing pages with and without using ad context. By this way, the quality of each ad depends on its landing page. That is the better relevancy between the ad and landing page; the higher the quality of the ads.
Regelson and Fain [29] work on estimating the click through rate for terms not for whole ads. They find the global click through rate for infrequent keywords as well as keywords having high click through rates in specific periods. They use historical data and term clusters to find relationship between historical terms in the system and new terms. They also propose using search frequency and rank to deal with rare and infrequent words.
3.3
Proposed Method
This section presents the proposed click through rate prediction method. We start with an overview, followed by more details.
3.3.1 Overview
The problem we address in this chapter is estimating the quality scores of new ads. Quality scores are used in estimating the ranks of ads according to Eq. (3.1). Ranks of ads determine which ads are displayed in web pages returned by search engines and the location of these ads within the page.
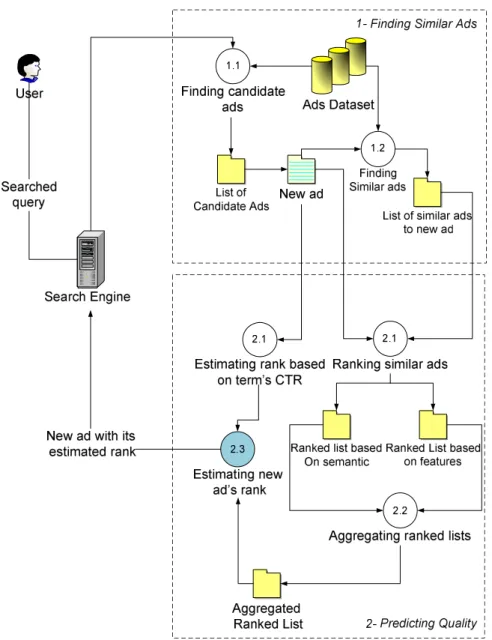
To solve the quality score estimation problem of new ads, we utilize information from existing ads in a novel way. The proposed approach, which is summarized in Figure 3.1, consists of two main parts: (i) Finding Similar Ads, and (ii) Predicting Quality Score.
As shown in Figure 3.1, users submit queries to the search engine. The search engine finds web pages that match the submitted queries. Before returning the web page to users, the search engine may insert one or more ads in this page. The search engine has a dataset of ads which it has already computed their expected click through rates based on historical data. The search engine has also a set of new ads which have not yet accumulated enough history to enable reliable computation of their click through rates. The search engine uses
CHAPTER 3. PREDICTING QUALITY FOR NEW ADS 18
our proposed method to estimate the click through rate for these new ads. In order to find similar ads for a given new ad, two ranked lists of ads are generated. The first list is based on ads’ terms semantic and the second list is based on ads’ terms features. Ads in these two lists are ranked according to their distances from the new ad. Since the number of terms in an ad is much fewer than in a web document, we cannot use existing algorithms for finding document similarity. Instead, we use our own vector based ranking (summarized in Section 3.3).
In the prediction quality step, the two lists are aggregated into one ranked list and we compute weighted average of quality from known quality of ads: QualityScorea. Meanwhile, the weighted average of new ad’s terms click through rate is computed in this step (we name itQualityScoret). Finally, we combine QualityScorea and QualityScoret to estimate new ad Quality, which could be combined withCP C to compute new ad rank.
The focus of the proposed method is on new ads. Depending on how search engines distinguish new ads from historical ones, once active ads accumulate enough historical data, these data are used to estimate the click through rates and then quality scores.
3.3.2 Finding Similar Ads
We propose a new method to find similar ads based on conceptual and general features of existing terms in ads. Our method has two parts: 1- finding all semantically related historical ads, and 2- ranking found ads based on their similarity with the new ad.
To find semantically related ads, we first retrieve all ads with the same keywords as the new ad. Then we look for those ads that have semantically related keywords in their keywords list. We use WordNet [33] to find semantically related words. WordNet finds related words based on a hierarchical cluster set. In this hierarchical cluster set, words placed in lower clusters are more semantically related together. For example, the outputs of WordNet for “soil” are dirt, land, ground, territory. Our method works with different levels and numbers of clusters in the WordNet. We analyze the impact of of clusters on the performance of the proposed method. We rank ads based on the similarity of their terms together. Ranking of similar ads is as follows:
First, we use our own dataset of a huge collection of ads (information about data col-lection is available in Section 3.4.1 ) and extract all used terms in ads. Then, we cluster all terms used in ads in our dataset. We form two sets of clusters: The first set of clusters is created based on term features (in Section 3.4.1 features have been explained), and we
use K-Means clustering to create them. The second set of clusters is created based on term meaning. We categorize all terms in clusters with hierarchical pattern, from 17 main cat-egories. These categories come form Google keyword tool; other structures can be used in our algorithm as well. We use WordNet to put terms into clusters. Given a term, WordNet is able to find semantically related terms to it. We use our main category to form 17 initial clusters with one word, and then WordNet puts each term into the most semantically related cluster.
For each ad, we form two vectors related to two cluster sets. Each vector has a number of entries equals to the number of clusters in a set; so we have two pairs of vectors and clusters. For each pair of cluster set and ad vector, if the ad has a term from n-th cluster, we increase its related vector entry by 1. Assume during the searching and selecting ad process, we find a candidate ad which is new. For predicting its quality, we look at all other similar ads.
Given a list of ads, in order to measure their similarity with newly entered ad, we examine two distance metrics: X2 and normalized Euclidean distance, which is a reduced version of the Mahalanobis distance [34]. We compare the results of both to select one of them as our final metric in Section 3.4.3. The X2 distance metric is given by [35]:
Dc(X, Y) = 1 2∗ V X n=1 (xn−yn) 2 xn+yn , (3.2)
and the normalized Euclidean distance given by:
D(X, Y) = v u u t N X n=1 (xi−yi)2 σ2 i , (3.3)
whereσi is the standard deviation of thexi over the sample set. We refer to the normalized Euclidean distance as NED.
Since we have two different vectors for each ad, we will have two ranked lists. In order to have one ordered list, we use a rank aggregation method to combine two generated ranked lists together. Several methods for aggregating ranked lists have been discussed in the literature [36]. Since our ranked lists are partial lists, we use Borda’s method [37] which is designed for partial lists. Given ranked listst1, ..., tk, for each candidate cin listti, Borda’s method first assigns a scoreBi(c) = the number of candidate ads ranked belowcinti. The total score B(c) is computed as Pk
CHAPTER 3. PREDICTING QUALITY FOR NEW ADS 20
order of the total score.
3.3.3 Finding Average Terms CTR
Since there is no guarantee to find enough (or any) historical ad similar to new ad, working with similar ads might not work for all new ads. Sometimes, specific words in ads including brand names, name of a service or good, or name of a place can attract users. Google keyword tool lets us find the click through rate of a word in a period of time. In order to use effect of specific word’s click through rate, we go through terms of ads and look at their click through rates. An ad has 3 parts: Title, Description and URL. We extract all terms from title and description and find their click through rate. But, since the range of terms click through rates is different from ranks in our models, we normalize them based on the distribution of ranks in our data models. Due to the fact that title and description have different appearance styles, they have different visual effects on user, so we assign weights to words in different parts. We use this formula:
αP
ttCT R+β P
tdCT R
α+β , (3.4)
whereα andβ are weights, the first sum goes over title terms and the second sum goes over description terms. In Section 3.4.3 we find optimal values for weights.
3.3.4 Prediction Quality Score
We estimate the quality score of a new ad as follows:
w1 QualityScorea+w2 QualityScoret
w1+w2
, (3.5)
wherew1 and w2 are weights,QualityScorea is the quality score based on aggregation and
QualityScoretis the predicted quality score from ad’s terms click through rates. Information about finding optimal values for weights are presented in Section 3.4.3.
3.4
Evaluation
In this section, we evaluate the proposed method, and compare its performance against the performance of three recent methods in the literature. We start in Section 3.4.1 by describing how we collected information about ads. Then, we describe how we choose the
parameters used in our method. Then, we present three different models for estimating quality scores for ads, which we use in the evaluation. In Section 3.4.4, we describe our experimental methodology, and we present our result in Section 3.4.5. Finally in Section 3.4.6, we analyze the impact of different parameters on the performance of our method.
3.4.1 Data Collection
Information about ads and their characteristics is not usually public for researchers outside the search engine companies. Thus, we had to construct a dataset ourselves. We started this work with finding common keywords in ads by using the Google Keyword tool. We found about 800,000 common terms and phrases for ads keywords. Then, we searched for each keyword using Google and saved the first 3 pages of search results. In Google, usually ads are displayed in the 3 first pages of search results. According to Google policies, it is impossible to do a lot of search together with one IP without any gap between searches. For solving this problem, we used 10 different machines and put 10 second gap between each search. By this way, we could retrieve all pages in one month. After retrieving all pages (about 2 million pages), we went through them to extract ads. We stored ads with their ranks on the page as well as the page number which they appeared on. We also saved the number of results for each query. Then, we extracted all terms in ads and used the Google keyword tool to find term features. We found 24 features for each term. Following are some features:
- Global Monthly Searches - Estimated Daily Impressions - Estimated Ad Position - Estimated click through rate - Estimated Daily Clicks - Estimated Daily Cost - Estimated Avg. CPC
-Term Frequency in dataset’s ads
We collected more than 4,000,000 ads of which 600,000 were unique. These ads had more than 300,000 unique terms . The overall size for our dataset is about 5 GB.
CHAPTER 3. PREDICTING QUALITY FOR NEW ADS 22
3.4.2 Models for Quality Scores
We want to predict the quality of new ads in comparison with old ones, but do not have access to information about quality for each ad. We used ads ranks in the search result page as well as other available features to compute the quality score for each ad. Please note that our proposed method is based on comparison between ads. Thus, accessing to actual values doesn’t have important impact on accuracy of results. We only need a quality factor which is consistent among all retrieved ads. Moreover, ads rank on the page is a true representative for their quality and shows how much an ad is better than other listed ads. However, in order to increase consistency between ad ranks in the data set, we produce quality models with different distribution. By that work, we consider various factors like popularity of searched query and visibility of ad on the page:
We used three different models in order to cover whole range of practical scenarios. The first model is based on page rank.
In this model, we use ads’ rank on the page, so it is a raw model without any consideration about other factors. Since Google has at most 8 ads on each page (side ads), we use the following formula for ads in different pages:
QualityScore=rank+ 8∗pn, (3.6)
wherepn is the page number.
The second model is based on query popularity. In the first model, the majority of ads are placed in the first rank. Due to the fact that in many pages, we have less than 8 ads (sometimes we have just one ad on the page), placing in the first spot of the page doesn’t always indicate high quality score. So, we should do something to smooth ads ranks. We found that queries which have more search results, attract more sponsored links. If a query can get more results, it means it is more popular and there will be more ads want to appear on the page, so the selected ads probably have more quality than those ads appear in the result page of a less popular search query. The Second formula is based on popularity of searched query by user:
QualityScore=nr∗
1
rank+ 8∗pn
, (3.7)
wherenr is the number of results for searched query, rank stands for ads’ rank within the search result page andpn shows the page number which ads appeared on. We multiply the
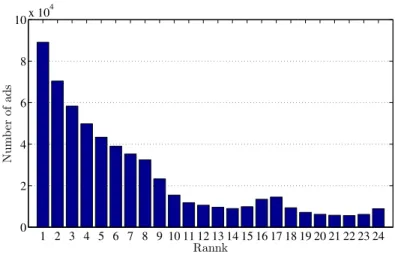
1 2 3 4 5 6 7 8 9 10 11 12 13 14 15 16 17 18 19 20 21 22 23 24 0 2 4 6 8 10x 10 4 Rannk Nu m b er of ad s
Figure 3.2: Distribution of ads in first data model (lower ranks number shows better quality).
latter one by 8, because in Google you can see at most 8 ads beside each page. We use the number of results for searched query in this formula to include the popularity of searched query in the ranking of ads beside the page.
The third model is based on Visibility. As Richardson et al. [31] said, whenever an ad is displayed on a page, it has a probability of being viewed by user. So the chance of an ad to receive a click depends on two factors: the probability that it is viewed and the probability that a user clicks on it. Thus,
p(click|ad, pos) =p(click|ad, pos, seen)×p(seen|ad, pos). (3.8)
A joint eye tracking study conducted by search marketing companies, Enquiro and Did-it, shows that the majority of eye tracking activities during a search happens in a triangle at the top of the search results page [38]. Moreover, they found even if an ad is placed in the best position of the page, it will be viewed by just 50% of users. In this research, they claimed ads which are placed in rank 1 to 8 can attract users view by these percentages respectively: 50%, 40%, 30%, 20%, 10%, 10%, 10%, 10%. They use Google as the search engine in the study. In our third data model, we include visibly of ads with popularity. We have :
QualityScore=v∗nr∗
1
rank+ 8∗pn
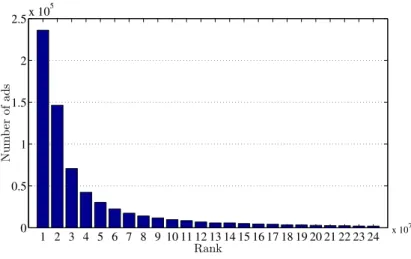
CHAPTER 3. PREDICTING QUALITY FOR NEW ADS 24 1 2 3 4 5 6 7 8 9 10 11 12 13 14 15 16 17 18 19 20 21 22 23 24 0 0.5 1 1.5 2 2.5x 10 5 Rank Nu m b er of ad s x 107
Figure 3.3: Distribution of ads in second data model (higher rank shows better quality).
1 2 3 4 5 6 7 8 9 10 11 12 13 14 15 16 17 18 19 20 21 22 23 24 0 2 4 6 8 10 12 14 16x 10 4 Rank Nu m b er of ad s x 107
1st Model 2nd Model(* 107 ) 3rd Model(* 107 ) Average 3.852760 1.78215 6.566382 Median 3.000000 0.20393 0.433936 Variance 5.498237 25.14734 6204.941721 Min 1.000000 0.000001 0.000031 Max 8.000000 27.4588838 13729.441880
Table 3.1: Statistics of the dataset models.
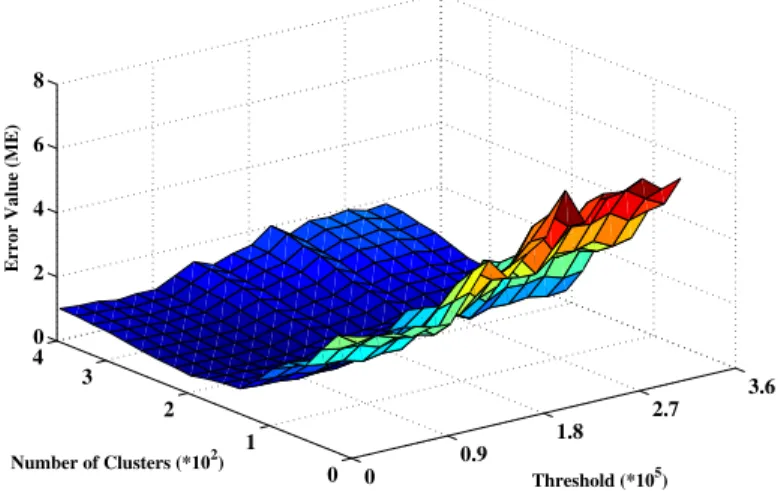
0 0.9 1.8 2.7 3.6 0 1 2 3 4 0 2 4 6 8 Threshold (*105) Number of clusters (*102)
Error Value (ME)
Figure 3.5: Mean error for different cluster numbers and threshold values with NED.
wherev is visibility factor which is equal to eye tracking numbers. Other variables are the same as last model.
Figures 3.2, 3.3, and 3.4 show distribution of quality in our different data models. Some other information about data models are given in table 3.1.
3.4.3 Optimization of Parameters
We examine our algorithm with different numbers of clusters and thresholds to find best parameters’ values for maximum accuracy. Threshold means the number of ads which will be used to find their similarity with our new ad. Figure 3.5 and Figure 3.6 show the results for different numbers of clusters and thresholds. For both distance metrics, the best results achieved when we have 220 clusters, and the threshold is set to 0.8∗105
CHAPTER 3. PREDICTING QUALITY FOR NEW ADS 26 0 0.9 1.8 2.7 3.6 0 1 2 3 4 0 2 4 6 8 Threshold (*105) Number of Clusters (*102)
Error Value (ME)
Figure 3.6: Mean error for different cluster numbers and threshold values with X2.
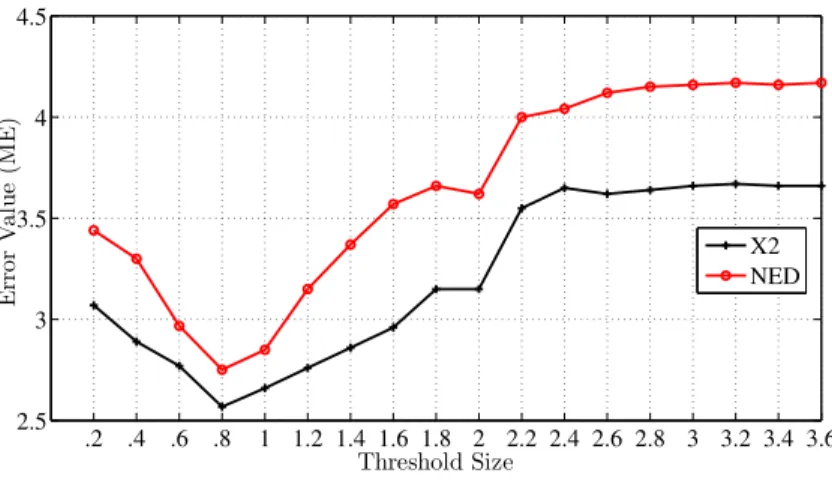
Figure 3.7 shows the results for X2 and NED with various numbers of threshold while there are 220 clusters (smaller numbers show better performance). The error value decreases as threshold increases, but when threshold goes further than 0.8∗105
, neither X2 nor NED isn’t improved. Greater threshold causes to use keywords which placed in higher clusters in hierarchical meaning cluster. Using keywords in higher clusters results in less relevant ads. Finally, Figure 3.7 shows that X2 overcomes NED and has less errors, so we use X2 as our similarity measurement metric. This information belongs to our third data model, but using other models also resulted in the same values. Due to the similarity of results for different models, we just draw graphs for our third model.
Next, we compute the weights in Equations (3.2) and (3.3) that resulted in the best performance. We run regression for different values between 0 and 1, to figure out effect of different values for the weights, and find optimal values for them in our data models. We use half of ads from our ad data set as train data, and other half to test computed weights (Since we remove repetitive ads, there is no duplicate). Tables 3.2 and 3.3 show optimal values for weights in Eq. (3.2) and (3.3) respectively.
.2 .4 .6 .8 1 1.2 1.4 1.6 1.8 2 2.2 2.4 2.6 2.8 3 3.2 3.4 3.6 2.5 3 3.5 4 4.5 Threshold Size E rr or V al u e (ME ) X2 NED
Figure 3.7: Mean error for different threshold values.
α β
First Model 0.67 0.33 Second Model 0.77 0.23 Third Model 0.71 0.29
Table 3.2: α and β values in different data models.
w1 w2
First Model 0.26 0.74 Second Model 0.21 0.79 Third Model 0.12 0.78
CHAPTER 3. PREDICTING QUALITY FOR NEW ADS 28
3.4.4 Methodology
We removed 100,000 ads whose quality and rank were known. Then we used our approach to re-estimate their quality. By comparing our estimated rank and their real rank we can find how accurate our approach is in predicting new ads’ quality.
In order to compare results, we use three metrics: MSE (Mean Square Error), KLD (Kullback-Leibler divergence), and ME (Mean Error). MSE is given by:
M SE=
Pi=n
i=1(xi−ti)2
n , (3.10)
where xi is actual value and ti is estimated value. MSE has been used by Richardson et al. [31], Ashkan et al. [27] and Debmbsczynski [32] as a performance metric.
KLD is defined as follows: Given two probability distributions P and Q, the Kullback-Leibler divergence between P and Q is
DKL(PkQ) =
X
i
P(i) logP(i)
Q(i), (3.11)
whereP is set of estimated values andQ is set of actual values. Richardson et al. [31] and Ashkan et al. [27] both use KL- divergence between their model’s predicted quality and the actual quality, which get 0 to the perfect model.
ME is given by:
E= |estimated equality−actual equality|
actual equality+ 1 . (3.12)
ME ensures that large errors on small rates are not neglected. In all mentioned metrics, smaller values show better performance.
3.4.5 Comparison with Other Methods
We compared the proposed method against the most recent approaches proposed in [27] [28] [29]. These methods are: i) a model based on query intent model proposed by Ashkan et al. [27], ii) a model based on logistic regression using statistics of existing ads (LR model) proposed by Richardson et al. [31], and iii) a model based on decision rules proposed by Debmbsczynski et al. [32]. The results from the work by Regleson and Fain [29] are not listed in the tables, because their results are based on term click through rate prediction not on ad quality prediction. We also compare against a simple method as a base line for
Prediction Model MSE KLD ME
Baseline(average) 4.94 4.23 4.87
Our Model 2.45 2.07 1.91
Query Intent Model [27] 3.89 3.56 3.27
LR Model [31] 2.84 2.40 2.21
Decision rules Model [32] 4.65 4.45 4.11
Table 3.4: Comparison with previous methods in the literature (First model for quality score).
Prediction Model MSE KLD ME
Baseline(average) 0.156 0.126 0.154
Our Model 0.143 0.115 0.083
Query Intent Model [27] 0.173 0.131 0.142
LR Model [31] 0.165 0.138 0.116
Decision rules Model [32] 0.192 0.157 0.179
Table 3.5: Comparison with previous methods in the literature (Second model for quality score).
comparison. This method is denoted by Base Line (Average) in the tables, and it is the average of all ads’ quality scores as estimated quality score for new ad. We mentioned that we did try our best in implementing the previous methods and find their performance based on the available information.
The results are shown in Tables 3.4, 3.5, and 3.6 for three different quality score models described in Section 3.4.2. The result in tables show that the proposed method produces more accurate prediction for quality than all previous methods in all considered performance metrics. For example, Table 3.4 shows that our model results in 27%, 14%, and 47% reduction in MSE compared to the Query Intent Model [27], LR Model [31], and Decision rules Model [32] respectively. Across all results, our model achieved at least 14%, 9%, and 10% improvement in MSE, KLD, and ME respectively. The minimum improvement in a metric is computed as the difference between the results of our method and the best result produced by any other method.
3.4.6 Analysis of the Proposed Method
As explained in Section 3.4.2, for better evaluation we use three models for quality scores. Here, we compare the performance of our methods with different features on all three models.
CHAPTER 3. PREDICTING QUALITY FOR NEW ADS 30
Prediction Model MSE KLD ME
Baseline(average) 5.53 5.33 4.06
Our Model 3.26 3.17 2.56
Query Intent Model [27] 4.12 3.98 3.69
LR Model [31] 3.84 3.48 2.87
Decision rules Model [32] 4.01 3.79 3.88
Table 3.6: Comparison with previous methods in the literature (Third model for quality score).
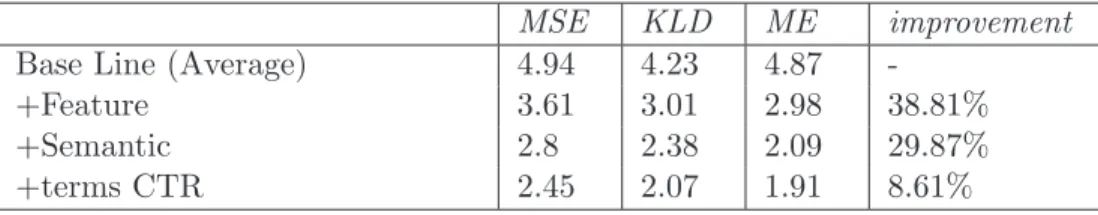
MSE KLD ME improvement
Base Line (Average) 4.94 4.23 4.87
-+Feature 3.61 3.01 2.98 38.81%
+Semantic 2.8 2.38 2.09 29.87%
+terms CTR 2.45 2.07 1.91 8.61%
Table 3.7: Impact of different parts of our method on the performance with first data model.
The results are summarized in Tables 3.7, 3.8, and 3.9.
The results in the tables show how much each part can increase the accuracy of qual-ity prediction. The improvement numbers are cumulative, which means that they show improvement when each part is added to the model.
All tables have the Base Line in the first row. In the Base Line model, we look at all other ads in the system, and compute the average of their quality scores as the estimated quality for the new ad. Feature in the tables means selecting similar ads based on similarity of the general features. In this model, instead of using all existing ads in the system, we select those ads which have similar features in their terms. More information about the ad selection procedure is discussed in Section 3.3. As it is expected, selecting some similar ads instead of using all ads in the system can improve accuracy by up to 18%. In the next step,
MSE KLD ME improvement
Base Line (Average) 0.16 0.13 0.15
-+Feature 0.15 0.12 0.12 23.18%
+Semantic 0.15 0.12 0.09 22.88%
+terms CTR 0.14 0.12 0.08 8.79%
Table 3.8: Impact of different parts of our method on the performance with second data model.
MSE KLD ME improvement
Base Line (Average) 5.53 5.33 4.06
-+Feature 4.11 3.94 3.32 18.13%
+Semantic 3.75 3.59 2.76 17.02%
+terms CTR 3.26 3.17 2.56 7.31%
Table 3.9: Impact of different parts of our method on the performance with third data model.
we include semantically similarity in ad selection. By this way, we use those existing ads which are in the same context with new ads (more details are available in Section 3.3). This feature increases accuracy of quality prediction by at least 17%. Finally, adding terms click through rate ensures that we can predict quality even for those new ads which do not have enough similar ads. Section 3.3 provides more information on using term click through rate. Using terms click through rate improves the prediction accuracy by least 7%.
3.5
Limitation of Proposed Approach
We try to estimate the quality, but we do not have access to true quality of historical ads. We tried to get access to datasets with actual values for current active ads. However, these datasets are all private within search engine companies, and they do not let other people to use them.
The only possible solution for us is using the rank of historical ads in search engines. Since our proposed approach is based on comparison, using these information can somewhat solve the problem. Once real quality numbers become available, we can replace them with current ones to have more accurate results. Section 3.4.1 provides more information about our data collection method.
3.6
Summary
In this chapter, we have proposed a novel method to address the problem of estimating the quality score for new ads. The proposed method needs only light weight computation which lets us to use more recent historical data. Moreover, our method works with the semantic of ads contents and does not look only at general ads features. These two new features increase the accuracy of the quality score predictions produced by our method compared
CHAPTER 3. PREDICTING QUALITY FOR NEW ADS 32
to previous methods. In particular, our trace-based evaluations show that the proposed method achieves at least 10% and up to 47% improvements in the accuracy compared to the most recent three methods in the literature.
Matching Ads with Online Videos
In this chapter, we propose a new approach to match ads with online videos based on the shopping interests of the target audience of videos.4.1
Introduction
Currently, a large fraction of Internet users have high-speed links, and this fraction is rapidly increasing. High-speed links enable users to easily access multimedia contents available online. There are numerous Internet sites offering multimedia content, either free or for a charge. For example, YouTube [39] serves millions of video clips to users everyday. The growing popularity of online videos makes them a good target for advertisers to reach their customers. Online advertising is a multi-billion dollar industry with expected high growth rate in the coming years.
Internet video sites try to attract more advertisers to increase their revenues. These sites typically offer tools to suggest keywords for ads and to matchads with videos. When users search for and retrieve videos, ads associated with these videos are displayed to users. Ads in online videos can take different forms, including: (i) a short video clip displayed before or during the retrieved video, (ii) a text message overlaid on the video, and (iii) an image overlaid on the video or displayed near to it. Most current Internet video sites, including YouTube, attach ads to videos based on matching the ads’ keywords with the metadata describing thecontentsof the videos. Some sites also try to automatically create descriptions for videos by analyzing their visual contents and/or their audio signals after converting them to texts. That is, ads and videos that have similar contents are associated
CHAPTER 4. MATCHING ADS WITH ONLINE VIDEOS 34
with each other. For example, if a video contains information about cars, ads related to cars are likely to be attached to this video.
The current approach for matching ads with videos assumes that if a user is watching a video about a specific subject, s/he will be interested in buying goods and services related to that subject. This assumption is not always true, because the purchasing or shopping
interests of a user do not necessarily match the contents of videos s/he watches online. We show in Figure 4.1 an example from YouTube, where an animation video about cars is displayed. Notice that there are two ads in this figure. The first is the overlaid text, which is about car rentals, and the second is the image to the right about purchasing Toyota cars. However, the statistics listed on YouTube for this video indicate that the majority of viewers for this video are teenagers between 13 and 17 years old. Therefore, although both ads are indeed related to the contents of the video, they are totally irrelevant to the actual viewers of the video who do not even have driving licenses. Teenagers are likely more interested in buying items such as music CDs, clothes, magazines, and video games. Displaying ads relevant to the shopping interests of teenagers would have probably attracted more attention (clicks) from viewers, and thus would have generated more revenues for both the advertisers and YouTube (as it typically charges per number of clicks on ads or per number of completed transactions by users from the advertisers).
Figure 4.1: A sample video from YouTube with an inserted ad.
shopping interests of the target audience of videos. The goal of our approach is to maximize the number of users who purchase goods and services offered by advertisers. Our approach increases the relevance of ads to the actual viewers (humans) of videos, which is unlike the current approach that maximizes the relevance of ads to the contents of videos (objects). Ad irrelevancy is cited as one of the most negative factors impacting viewers’ experience [40,41]. We conduct a subjective study to assess the performance of the proposed approach on many videos retrieved from YouTube. Our results show that the proposed approach yields more relevant ads to the viewers than the YouTube’s approach. We also compare against other approaches proposed in the literature and we show that the new approach outperforms them.
4.2
Related Work
Advertising in online videos has received a significant interest from the research community as well as from many companies. We summarize some of the common approaches below. YouTube uses AdSence [42], in which ads are matched with videos based on the ads’s keywords and the videos’ tags. Mei et al. presents VideoSense in [43] to find relevant video clip ads and insert them in appropriate positions in online videos. They use the vector space model over video’s tags and tags associated with the ads. They compute a relevancy score for each ad-video pair as the cosine of the angle between the ad vector and video vector. AdOn [44] is a system for contextual overlay advertising in videos. Similar to VideoSense [43], it finds the relevancy between overlay ads and videos by representing them as vectors and computing the cosine similarity over these vectors. The authors propose a method to determine the overlay ad locations using spatio-temporal analysis of the video contents. Finding the location is based on video structuring, face and text detection, as well as visual features analysis so that intrusiveness to users can be minimized.
AdImage [45] is another advertising system which associates relevant image ads to videos. The authors compute relevant ads by matching some characteristics of the image ads and objects within the videos. Finally, vADeo [46] is a system to find appropriate scene changes where ads can be inserted. This system, Like VideoSense [43], looks for shot boundaries for inserting ads. vADeo tries to insert ads in shot boundaries where the ad results in the minimum break in the flow of the video.
CHAPTER 4. MATCHING ADS WITH ONLINE VIDEOS 36
based on contents and/or tags describing contents, which is different from the proposed approach that performs that matching based on the interests of target audience. We believe that the proposed approach is more intuitive as it tries to improve the ultimate goal from advertising: get users to purchase advertised goods and services. For example, advertising over traditional TV networks follows a similar approach to ours, where ads are broadcast within a TV program based on whowill likely watch that program and not onwhat topics or visual objects are included in the program.
4.3
Proposed Approach
This section presents the proposed ad-video matching approach. We start by an overview, followed by more details.
4.3.1 System overview
The proposed system is summarized in Figure 4.2. There are three main parts in the system: Detecting video topics, Finding target audience interests, and Finding candidate ads. The goal of the proposed system is to choose multiple ranked ads for each video such that these ads are relevant to viewers of that video. Relevance in our approach means that goods and services advertised by ads are of interest to the target viewers of videos. Our proposed method classifies viewers into multiple groups based on marketing and advertising studies such as [47, 48]. We can classify viewers based on several metrics, including age, location, and gender. With each viewer group, there is a list of shopping interests. For example, Table 4.2 shows the top ten shopping interests for teenagers between 13 and 17 in the USA, based on data from [47].
Our system assumes that each ad and video is associated with one or more keywords. Ads’ keywords are typically specified by advertisers, with some guidance and suggestions from the online video site distributing the ads.
The proposed system works as follows: Videos are analyzed to identify their potential viewer groups. To that end, the system looks at their associated keywords or existing statistics about viewers. Once the potential viewer groups for a given video are identified, their shopping interests become known using tables such as Table 4.2. The interests of viewer groups of each video are considered as tags for that video. The proposed method then maps the interests of viewer groups of each video (its tags) as well as the ads’ keywords to a
common hierarchical keyword structure, such as the one available from the Google Keyword Tool (Available in Figure 4.3). Our system then nominates all ads which have at least one keyword from interesting topics to the video target audience. Then, system ranks candidate ads based on a score which depends on “interestingness of their topic to the found target audience” and also “level of matching between ad’s and video’s keywords in hierarchical keyword structure (the match in lower level, the better score for ad)”. Finally, our system chooses ads with highest similarity score for each video.