TRADEMARK ATTRIBUTIONS
AVERT, EPO, EPOLICY ORCHESTRATOR, FLASHBOX, FOUNDSTONE, GROUPSHIELD, HERCULES, INTRUSHIELD, INTRUSION INTELLIGENCE, LINUXSHIELD, MANAGED MAIL PROTECTION, MAX (MCAFEE SECURITYALLIANCE EXCHANGE), MCAFEE, MCAFEE.COM, NETSHIELD, PORTALSHIELD, PREVENTSYS, PROTECTION-IN-DEPTH STRATEGY, PROTECTIONPILOT, SECURE MESSAGING SERVICE, SECURITYALLIANCE, SITEADVISOR, THREATSCAN, TOTAL PROTECTION, VIREX, VIRUSSCAN, WEBSHIELD are registered trademarks or trademarks of McAfee, Inc. and/or its affiliates in the US and/or other countries. McAfee Red in connection with security is distinctive of McAfee brand products. All other registered and unregistered trademarks herein are the sole property of their respective owners.
LICENSE INFORMATION License Agreement
NOTICE TO ALL USERS: CAREFULLY READ THE APPROPRIATE LEGAL AGREEMENT CORRESPONDING TO THE LICENSE YOU PURCHASED, WHICH SETS FORTH THE GENERAL TERMS AND CONDITIONS FOR THE USE OF THE LICENSED SOFTWARE. IF YOU DO NOT KNOW WHICH TYPE OF LICENSE YOU HAVE ACQUIRED, PLEASE CONSULT THE SALES AND OTHER RELATED LICENSE GRANTOR PURCHASE ORDER DOCUMENTS THAT ACCOMPANIES YOUR SOFTWARE PACKAGING OR THAT YOU HAVE RECEIVED SEPARATELY AS PART OF THE PURCHASE (AS A BOOKLET, A FILE ON THE PRODUCT CD, OR A FILE AVAILABLE ON THE WEBSITE FROM WHICH YOU DOWNLOADED THE SOFTWARE PACKAGE). IF YOU DO NOT AGREE TO ALL OF THE TERMS SET FORTH IN THE AGREEMENT, DO NOT INSTALL THE SOFTWARE. IF APPLICABLE, YOU MAY RETURN THE PRODUCT TO MCAFEE OR THE PLACE OF PURCHASE FOR A FULL REFUND.
License Attributions
About this guide 5
Conventions . . . .5
Acronyms . . . .6
1 Introduction to Firewall Profiler 7 Introducing the Firewall Profiler . . . .7
Putting Firewall Profiler to use . . . .7
What Firewall Profiler provides . . . .8
2 Deploying a Firewall Profiler 9 Setup tasks . . . .9
Additional information . . . .9
Verify materials . . . 10
Record your initial configuration responses . . . 11
Setting up the hardware . . . 13
Configuring the Firewall Profiler at first boot . . . 13
Activating a Firewall Profiler . . . 14
Backing Up a Firewall Profiler . . . 16
What is backed up . . . 16
What’s next . . . 16
3 Configuring the Firewall Profiler 17 Record your configuration information . . . 17
Getting started quickly . . . 18
Reviewing system status . . . 20
Enabling identities collection . . . 21
Define the DNS server(s) and NTP server . . . 21
Collect the certificate common name and hash values . . . 22
Install and configure a McAfee Login Collector . . . .22
Define the identities address space . . . 24
Encrypt credentials for domains . . . 24
Add a domain to the Firewall Profiler . . . 25
Ranking preferred user groups . . . 27
What’s next . . . 28
4 Working with Live Data 29 Live Data page . . . 29
Live Data interface . . . 30
Selecting a data feed . . . 31
Selecting a time frame . . . 31
Viewing trend chart details . . . 31
Using the WHO, WHAT, and WHERE filters . . . 32
Comparing time frames . . . 34
Reading event trends . . . 36
Viewing the remediation summary . . . 37
Viewing the remediation details . . . 38
5 Managing the Firewall Profiler 41 Firewall Profiler web interface for managing . . . 41
System logon indicator . . . 41
Operations . . . 42
System status . . . 42
Logs . . . 43
Configuration . . . 47
General . . . 47
Domains . . . 51
Users . . . 53
Software update . . . 54
ePO . . . 55
Reporting . . . 56
Reporters . . . 56
Preferred Groups . . . 59
Preferences . . . 60
A Troubleshooting 61 Backing up and restoring a Firewall Profiler . . . 61
Re-imaging a Firewall Profiler . . . 62
Determining Firewall Profiler version . . . 62
Configuring network information . . . 62
Downloading log files . . . 63
Enabling a serial port connection . . . 63
Verifying the domain credentials . . . 64
Connecting to a DC . . . 64
Running a CPU Performance Query . . . .66
Running a Back Log Query . . . 67
Running a Forward Log Notification Query . . . 68
Creating a non-administrator account to access the security event log on a DC . . . 68
Instructions for Windows 2003 server . . . 68
Instructions for Windows 2000 server . . . 71
Useful resources . . . 72
B Installing a McAfee Login Collector 73 McAfee Login Collector installation requirements . . . 73
Installing the MLC software . . . 74
Configuring the MLC . . . 75
Configuration tab . . . 75
Remote tab . . . 77
Using Microsoft Management Console to manage MLC certificates . . . 78
Importing or removing a server or client CA certificate for MLC . . . 78
Using NTLMv2 with MLCs . . . 79
The McAfee Firewall Profiler Product Guide describes the features and capabilities of the McAfee Firewall Profiler software.
This guide is intended for network and security administrators, and especially McAfee Firewall Enterprise (Sidewinder®
) administrators. It assumes familiarity with Linux, a basic understanding of system administration, a working knowledge of the Internet and its associated terms and applications, and an understanding of networks and network terminology, including TCP/IP protocols. You should also be familiar with the McAfee Firewall Enterprise (Sidewinder®) and have access to its documentation. You can find additional information at the following locations:
• Help – Help is built into Firewall Profiler in the form of a PDF version of this Product Guide. Click the Help Help link in the Firewall Profiler web interface.
• Support – Visit mysupport.mcafee.com to find product documentation, announcements, and support. • Product updates – Visit mysupport.mcafee.com to find product updates and patches. To navigate to the
download area, click Download Software Updates under Self Service, then click Product
Downloads, then click My Products under the applicable category. Finally, type your Grant Number and click Submit.
Conventions
Refer to Table 1 for a list of the text conventions used.
Note: The IP addresses, screen captures, and graphics used within this document are for illustration purposes only. They are not intended to represent a complete or appropriate configuration for your specific needs. Features may be enabled in screen captures to make them clear; however, not all features are appropriate or desirable for your setup.
Table 1 Conventions
Convention Description
Courier bold Identifies commands and key words you type at a system prompt
Note: A backslash (\) signals a command that does not fit on the same line. Type the command as shown, ignoring the backslash.
Courier italic <Courier italic> nnn.nnn.nnn.nnn
Indicates a placeholder for text you type
When enclosed in angle brackets (< >), identifies optional text Indicates a placeholder for an IP address you type
Courier plain Used to show text that appears on a computer screen
Plain text italics Identifies the names of files and directories
Used for emphasis (for example, when introducing a new term) Plain text bold Identifies buttons, field names, and tabs that require user interaction
[ ] Signals conditional or optional text and instructions (for example, instructions that pertain only to a specific configuration)
Caution Signals be careful—in this situation, you might do something that could result in the loss of data or an unpredictable outcome.
Note Used for a helpful suggestion or a reference to material not covered elsewhere in the guide Security Alert Identifies information that is critical for maintaining product integrity or security
Acronyms
Refer to Table 2 for a list of acronyms used throughout this document.
Table 2 Acronyms
Acronym Description
URL Uniform Resource Locator
SNMP Simple Network Management Protocol SMTP Simple Mail Transport Protocol NTP Network Time Protocol
DNS Domain Name System
MLC McAfee Login Collector
NTLM NT LAN Manager
LM (hash) LAN Manager Hash
MTU Maximum Transmission Unit ePO McAfee ePolicy Orchestrator
1
Contents
Introducing the Firewall Profiler Putting Firewall Profiler to use What Firewall Profiler provides
Introducing the Firewall Profiler
McAfee Profiler addresses the most time-consuming tasks in current Firewall Administration: Resolving user access problems due to changes in the network or due to introduction of new applications. McAfee Profiler turns days of troubleshooting into a couple of clicks
McAfee Firewall Profiler is a network appliance that takes feeds from McAfee Firewall Enterprise and flow data from across the network and instantly analyzes this information to provide true visibility into Firewall rules impact on the network. Profiler complements McAfee Firewall Enterprise Control Center for
management and dramatically reduces troubleshooting efforts related to Firewalls.
Changing firewall policy can be an inefficient endeavor, where you may not know the full extent of the effects of your changes until well after you have made them and users are contacting you with issues. With Firewall Profiler, you gain visibility into your firewall, enabling you to detect changes in access patterns in real time.
Putting Firewall Profiler to use
Following are some of the ways you can put Firewall Profiler to use for you: • Quick root cause detection of application outages
Meaningful Firewall management systems have notoriously provided vast amounts of data to the firewall administrator. Typically, however, the data collected by the firewall is neither sufficient nor presented in a meaningful enough manner to enable the firewall administrator to quickly understand the root cause of a firewall problem like application outages.
Network infrastructure can easily fall out of synchronization with a firewall’s rule set. For example, application servers are sometimes moved or re-purposed, or user groups come online that require immediate access to an application.
With Firewall Profiler, you can quickly and easily determine whether a particular user group has the access it requires, or whether an application server is trending to denying traffic.
• Situational Awareness
Firewall Administrators can at a glance visualize what access is being granted and denied by the firewall in a single view.
• Application roll-out support
Firewall Profiler enables Firewall Administrators to visualize the effect of their firewall rule set changes. FA can in real time assess the accuracy and validity of their firewall changes and quickly identify if there is a gap between the specifications of the applications and the actual application requirements.
What Firewall Profiler provides
Following is a sampling of the features and functionality Firewall Profiler provides: • Real-time detection of changes in access patterns
Firewall Profiler enables you to see whether firewall policy changes have resulted in significant trends in allowing or denying traffic, or fluctuations in the volume of traffic. Such changes to access or volume can be an indication that the firewall administrator should review those policy changes immediately.
• Quick identification of whether access was prevented at the firewall
Consistently, firewall administrators are the first to be blamed when access to applications breaks in the network. Firewall Profiler enables you to quickly identify whether the problem at hand is a firewall problem or not and can reduce the time you spend investigating log files.
• Quick understanding of the scope of both a problem and a potential fix
Firewall Profiler enables you to quickly answer the question of whether a particular problem is a one-off access issue (such as a user accessing from a forbidden location), or an indication of a more wide-spread problem involving multiple users (such as a user group was moved from one location to another). Being able to quickly diagnose the problem can help reduce the number of support calls that may come in, especially for problems involving many users.
As a firewall administrator, you are required to understand what you need to do to change a firewall rule set to address a particular problem. Firewall Profiler enables you to discover which rule set must be modified, or how the rule should be implemented in the firewall to enable access that is being denied.
2
Contents Setup tasks Verify materials
Record your initial configuration responses Setting up the hardware
Configuring the Firewall Profiler at first boot Activating a Firewall Profiler
Backing Up a Firewall Profiler What’s next
Setup tasks
To set up your Firewall Profiler, use this chapter to perform the following tasks:
1 Plan your setup.
• Verify necessary hardware and media • Prepare configuration responses
2 Set up the hardware.
3 Start the Firewall Profiler and perform the initial configuration. • Configure network information and required user accounts • Activate the license
• Perform a post-setup backup
Additional information
See the table below for a list of related resources.
Table 3 Summary of documentation Document Description
McAfee Firewall
Enterprise Setup Guide Leads you through your initial McAfee Firewall Enterprise configuration and describes fundamental concepts of firewall administration.
McAfee Firewall Enterprise
Administration Guide
Provides complete administration information on all McAfee Firewall Enterprise features and functionality. You should read this guide if you are responsible for configuring and managing a McAfee Firewall Enterprise.
Release notes Software updates include release notes, which describe any new features as well as fixes and enhancements to the software.
Release notes are located at mysupport.mcafee.com.
Knowledge Base Supplemental information for Firewall Profiler. Articles include troubleshooting tips and commands. All manuals and application notes are also posted here.
Verify materials
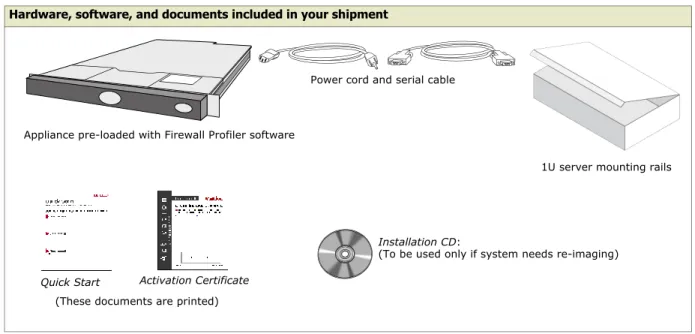
Make sure that you have all the necessary hardware, software, and documents needed to set up your Firewall Profiler.
Table 4 Materials provided by McAfee
Hardware, software, and documents included in your shipment
Table 5 Materials provided by you
Hardware Component Requirements
Firewall Profiler initial
configuration Monitor 1024 x 768 or higher, plugged directly into the Firewall Profiler appliance Keyboard USB, plugged directly into the Firewall
Profiler appliance
OS MS Windows 2000 Workstation, 2000 Server, XP Pro, or Vista
CPU Intel (1 GHz minimum)
Memory 2 GB minimum
Drives • 300 MB of available disk space • CD-ROM drive
Monitor 1024 x 768 or higher
Network interface card Access to network hosting your firewall Browser • Internet Explorer 7
Use of Internet Explorer 6 requires an AJAX plug-in
• Mozilla Firefox 3.0 or later
Network cables At least two network cables for the Firewall Profiler; one network cable for management system
Appliance pre-loaded with Firewall Profiler software
Power cord and serial cable
1U server mounting rails
Quick Start Activation Certificate
Installation CD:
(To be used only if system needs re-imaging)
(These documents are printed)
Management system for web interface (desktop or laptop)
Record your initial configuration responses
Complete this form so that you have responses available when you initially configure your Firewall Profiler upon booting for the first time.
McAfee uses this information to send customer announcements, such as patches or end-of-life notifications. The serial number is on your Activation Certificate and it is also attached to the top of the appliance. Your 16-digit, alphanumeric serial number is in this format:
SWXX-XXXX-XXXX-XXXX.
Serial Number ________________________________________________________________ Enter the contact and company information for this Firewall Profiler’s administrator. McAfee uses this information to send customer announcements, such as patches or end-of-life notifications.
Contact Information:
First Name ___________________________________________________________________
Last Name ___________________________________________________________________
Phone Number ________________________________________________________________
Email _______________________________________________________________________
Purchased From _______________________________________________________________
Company Information:
Name _______________________________________________________________________
Street _______________________________________________________________________
City _________________________________________________________________________
State/Province ________________________________________________________________
Postal (ZIP) Code _____________________________________________________________
Country______________________________________________________________________
Type the machine name that the Firewall Profiler will be known by on the external burb (internet).
Determine a naming scheme for your Firewall Profiler or select a name that fits into your existing scheme. For example, if you have more than one Firewall Profiler, your naming scheme could be
profiler_a.example.com, profiler_b.example.com, and so on.
Machine name ________________________________________________________________
MTU Size_____________________________________________________________________ The default MTU size is appropriate for most situations. Type the value appropriate for your environment. If you are using a PPPoE connection, for example, change the value to 1492.
SSH enabled (yes or no)
Determine whether you are going to allow SSH access to the Firewall Profiler.
License Information
Assign an IP address to your network interface. You can assign either an IPv4 or IPv6 address to the network interface during initial configuration. Firewall Profiler also supports configuring IPv6 via Stateless Auto Address Configuration (STAAC), which automatically configures IPv6 settings by negotiating with the router. Check with your site network administrator before enabling this option due to security concerns.
IP address ___________________________________________________________________
Netmask ____________________________________________________________________
Gateway ____________________________________________________________________
You need to create a user account that can access the Firewall Profiler web interface, and then specify passwords for other built-in user accounts.
Web interface administrator
Create a user name and password that you will use to connect to the Firewall Profiler web interface.
• A user name can consist of 6-16 characters, upper and lowercase letters, numbers, spaces, and the dash (-) or underscore (_) characters.
• The password must meet these strong password guidelines: • Use a minimum of eight characters.
• Use at least one uppercase letter, one lowercase letter, one number and one special character.
Administrator username: ________________________________________________________
Password: ___________________________________________________________________
Root password
Create a password for root on the Firewall Profiler appliance. You cannot SSH into the Firewall Profiler as
the root user. Instead, you must use the svs user.
Root password: _______________________________________________________________
svs account password
Create a password for the svs account on the Firewall Profiler appliance. You use the svs account, which is root-equivalent, to SSH into the Firewall Profiler for administrative tasks that cannot be performed through
the web interface.
svs password: ________________________________________________________________
swcfg account password
Create a password for the swcfg account on the Firewall Profiler appliance. The McAfee Firewall Enterprise
uses the swcfg account to access the Firewall Profiler.
swcfg password: ______________________________________________________________ For more information on the swcfg account used by the McAfee Firewall Enterprise, see SCP username and passwordon page 19 and SCP username and passwordon page 45.
Network Information
Setting up the hardware
Before you boot the Firewall Profiler appliance and begin the initial configuration, make sure your hardware is set up and your information is available.
1 Use a diagram of your network to determine the proper placement of your Firewall Profiler. The Firewall Profiler must be able to reach the appropriate McAfee Firewall Enterprises and servers (such as mail servers and name servers).
2 Attach the power cord to the Firewall Profiler and plug it into an electrical outlet (but do not power on the appliance yet).
3 Connect a display, keyboard, and optionally a mouse to the Firewall Profiler.
You are now ready to power on the Firewall Profiler and perform the initial configuration. Proceed to
Configuring the Firewall Profiler at first boot.
Configuring the Firewall Profiler at first boot
These instructions assume you are booting your Firewall Profiler for the first time after you have set up the hardware (see Setting up the hardware). For information about re-installing the McAfee Firewall Profiler software, see Re-imaging a Firewall Profileron page 62. You should have available the information you previously gathered (see Record your initial configuration responses).
1 Power on the appliance.
2 Press Enter to read the license agreement when prompted.
To navigate the agreement, press the space bar to move to the next page, press b to move back to the previous page, press h for more help, or press q to quit reading and move to the next step.
3 After pressing q (to quit reading), type yes, and then press Enter to agree to the terms. 4 Configure the network information as prompted.
• Use the mouse, tab key, or arrow keys to move from one field to another. • Type over the displayed value, such as the IP address, to change it. • Press the space bar to toggle on and off a property with a check box.
Note: You can change the IP address for the Firewall Profiler at any time by running editSVnetwork.pl directly as root from the console or remotely using an SSH connection to the appliance. You need to have /opt/svs/system/bin in your path, or change to that directory to run the command.
5 Press the space bar to toggle on or off the serial port login to the Firewall Profiler. See Enabling a serial port connection for information on performing this step outside of the installation process.
When serial port login is enabled, you can connect a tty to the serial port of the Firewall Profiler to connect to the command line interface. Only the svs account can log on by way of the serial tty. When serial port login is off, this feature is disabled. The recommended setting is disabled, the default.
6 Configure user accounts as prompted.
7 Review the summarized information and save a copy, then press Enter to reboot the Firewall Profiler. With your Firewall Profiler configured, you are ready to proceed to Activating a Firewall Profiler.
Activating a Firewall Profiler
The Firewall Profiler must be activated to establish your technical support license and communicate with McAfee Firewall Enterprises.
Note: If at any time you change the terms of your support contract or perform a major version upgrade, you are required to re-license your system.
To activate a Firewall Profiler:
1 Locate the serial number for your Firewall Profiler on your Activation Certificate.
2 Log on (or SSH in) to the Firewall Profiler console as the svs account, and then at the command prompt,
type the following to be logged in as root:
#sudo -s
3 Type the following command at the system prompt:
#getSystemID
The result should look similar to the following:
#99aaaaa9a9a9
Write down this number as you will need it for the Server ID field on the activation web page in the next step.
4 Open a browser and go to the Firewall Profiler activation web page:
https://www.securecomputing.com/activation.cfm?product=Profiler
Following are the fields for which you will need to provide values:
5 Complete the form on the activation web page and then click Submit at the bottom of the page.
6 Save the resulting web page. You must save the complete web page so that pertinent meta information is saved.
• For Internet Explorer, select Webpage, complete (*.htm;*.html) for Save as type
• For Firefox, select Web Page, complete for Save as type
The file name should be similar to activation.cfm.htm . You can use any file name.
Caution: Take appropriate measures to protect this file as it contains critical information related to the functioning of your Firewall Profiler.
7 Log on (or SSH in) to the Firewall Profiler console again as described in step 2 if you are not still logged on to the console as root.
8 Copy the activation form web page file you saved in step 6 (for example, activation.cfm.htm )to /opt/svs/config on the Firewall Profiler. For example, use scp.
9 Type the following command at the system prompt:
For this field... Provide...
Serial Number The serial number from your printed Activation Certificate. Server ID The output of the getSystemID command in step 3. Version The appropriate version number from the drop-down list.
End User Information The appropriate information such as name, phone number, Email address, address, and other values as prompted on the form.
10Verify the activation by typing the following command at the system prompt:
#verifyActivation
What you see depends on whether you have the correct license.
11With your Firewall Profiler activated, you should proceed to Backing Up a Firewall Profiler so that your configuration can be preserved.
For this license... You see output similar to this...
Correct SystemID: xxxxxxxxxxxx; Serial Number: XXXX-XXXX-XXXX-XXXX System time : Fri Mar 6 15:53:38 2009 SecureOS License expires on: never
Support License expires on: Wed Jan 1 06:00:00 2020 Expired SystemID: xxxxxxxxxxxx; Serial Number: XXXX-XXXX-XXXX-XXXX
System time : Fri Mar 6 15:53:38 2009 SecureOS License expires on: never
Support License expired on: Sun Jan 24 06:00:00 2020 Incorrect or no
license present SystemID: xxxxxxxxxxxx
Serial Number: XXXX-XXXX-XXXX-XXXX
Backing Up a Firewall Profiler
To establish a base point post-configuration with license and activation information, you should create a backup file and store it away from the Firewall Profiler.
Note: For information about restoring a Firewall Profiler from a backup file, see Backing up and restoring a Firewall Profiler in Appendix A, Troubleshooting.
1 Log on to Firewall Profiler console.
2 Run the following command at the prompt:
# backup.pl
Following is a sample of the output from this command:
# backup.pl
Creating a backup for McAfee Firewall Profiler 1.5 Backup was successful, copy the following file off box: /var/log/Profiler_dhcp-10-6-20-219_2009_03_15_08:23:24.backup.tgz
3 Copy the resulting backup file from the Firewall Profiler to a safe location.
What is backed up
The following items are backed up: • Certificates
• User account information, including credentials • Flow exporters list
• Configuration information, including network settings and values specified in the web interface • SSH keys
What’s next
At this point, you have configured network and user information, activated the Firewall Profiler, and backed up the initial configuration to a safe location.
You are now ready to attach the Firewall Profiler to your network with the included 1U server mounting rails and network cable (that you provide).
Once the Firewall Profiler is attached to the network, you can:
• Proceed to Appendix B, Installing a McAfee Login Collector if you intend to enable identities collection (highly recommended)
• Proceed to Configuring the Firewall Profileron page 17 to use the web interface to continue with configuring the Firewall Profiler
3
Contents
Record your configuration information Getting started quickly
Reviewing system status Enabling identities collection
Record your configuration information
Complete this form so that you have information available when you configure the Firewall Profiler using the web interface.
Note the fully qualified domain names of any McAfee Firewall Enterprises you want to act as data feeds.
Fully qualified domain names ____________________________________________________ Note the IP addresses of any Flow exporters you want to act as data feeds to the Firewall Profiler.
Flow IP addresses _____________________________________________________________
Note the network information and credentials required for access to an ePO server.
ePO server IP address and port number ___________________________________________
User Name and password _______________________________________________________
Note the IP addresses of the following servers you may require to interact with the Firewall Profiler.
DNS server IP addresses ________________________________________________________
NTP server IP address __________________________________________________________
SNMP server IP address_________________________________________________________
SMTP server IP address _________________________________________________________
If you plan to deploy identities collection, you will need the information requested in this section. Note the credentials required to access Domain Controllers (DCs) on your network.
DC administrator credentials ____________________________________________________ Note the network information for any MLCs on your network For information on installing MLCs, see
Installing a McAfee Login Collectoron page 73.
MLC IP addresses and port numbers _____________________________________________
Data feeds
McAfee ePO Integration
External servers
Getting started quickly
Once you have completed the actions described in Deploying a Firewall Profiler on page 9, you can get started quickly by simply adding data feeds. With McAfee Firewall Enterprises feeding you data, you can get to work with the live data (as described in Working with Live Dataon page 29).
1 Log on to the web interface as a user with the Administrator role.
If you are starting immediately after deploying the Firewall Profiler as described in Deploying a Firewall Profileron page 9, the only user account is an Administrator so log on as that user.
2 Click Configuration and then copy the value for Certificate Common Name.
Figure 1 Basic section of General tab for Configuration
The Certificate Common Name will identify the Firewall Profiler to the McAfee Firewall Enterprise.
3 Define a McAfee Firewall Enterprise as a data feed to a Firewall Profiler
With the Firewall Profiler known to the McAfee Firewall Enterprise, you must next define the McAfee Firewall Enterprise as a data feed so that audit and configuration data can travel to the Firewall Profiler.
a Log on to the Firewall Profiler web interface, click Operations, and then click the Data Feeds tab.
Figure 2 Data Feeds tab for Operations
b Click Add and then type the fully qualified domain name of a McAfee Firewall Enterprise.
c Click Save.
4 Identify the Firewall Profiler to the McAfee Firewall Enterprise.
a Open the McAfee Firewall Enterprise Admin Console, open Maintenance and then select Profiler.
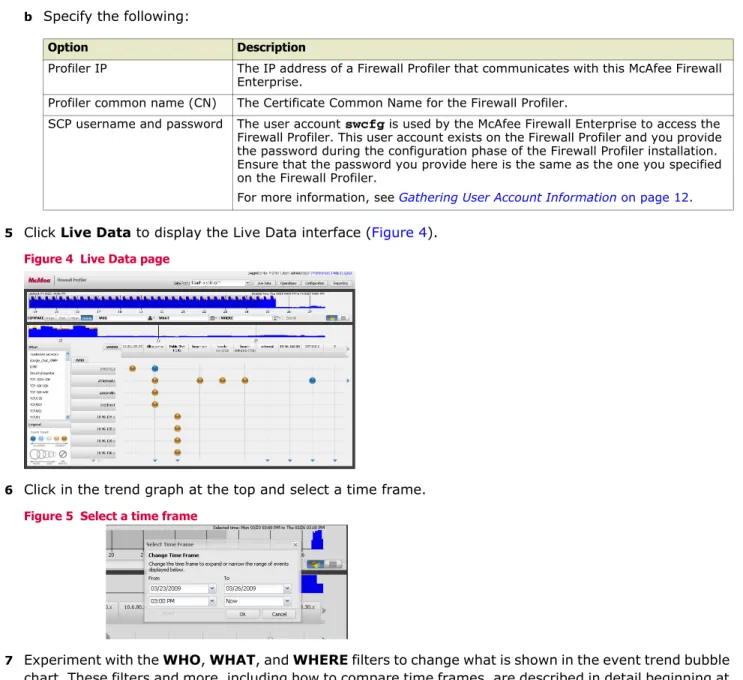
b Specify the following:
5 Click Live Data to display the Live Data interface (Figure 4).
Figure 4 Live Data page
6 Click in the trend graph at the top and select a time frame.
Figure 5 Select a time frame
7 Experiment with the WHO, WHAT, and WHERE filters to change what is shown in the event trend bubble chart. These filters and more, including how to compare time frames, are described in detail beginning at
Working with Live Dataon page 29.
8 Proceed to Reviewing system statuson page 20 to verify your Firewall Profiler is behaving as expected.
Option Description
Profiler IP The IP address of a Firewall Profiler that communicates with this McAfee Firewall Enterprise.
Profiler common name (CN) The Certificate Common Name for the Firewall Profiler.
SCP username and password The user account swcfg is used by the McAfee Firewall Enterprise to access the Firewall Profiler. This user account exists on the Firewall Profiler and you provide the password during the configuration phase of the Firewall Profiler installation. Ensure that the password you provide here is the same as the one you specified on the Firewall Profiler.
Reviewing system status
You can use the System Status tab (available when you click Operations) to verify the appropriate components are running as expected. Look for components that may have a status of DOWN (the System Status title bar shows DOWN if any component has a status of DOWN). You can click on the Status column to sort by status.
Figure 6 System status
Note: Configuration changes restart system components so you should wait a few minutes after making changes before you look for status changes on the System Status tab.
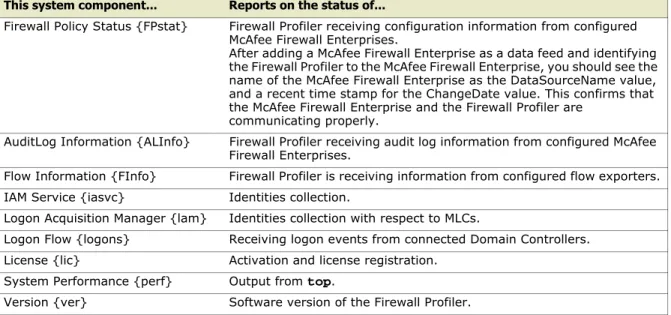
Following is a table of components that you may want to review:
For choices on where to proceed from here, see What’s nexton page 28.
Table 6 System components
This system component... Reports on the status of...
Firewall Policy Status {FPstat} Firewall Profiler receiving configuration information from configured McAfee Firewall Enterprises.
After adding a McAfee Firewall Enterprise as a data feed and identifying the Firewall Profiler to the McAfee Firewall Enterprise, you should see the name of the McAfee Firewall Enterprise as the DataSourceName value, and a recent time stamp for the ChangeDate value. This confirms that the McAfee Firewall Enterprise and the Firewall Profiler are
communicating properly.
AuditLog Information {ALInfo} Firewall Profiler receiving audit log information from configured McAfee Firewall Enterprises.
Flow Information {FInfo} Firewall Profiler is receiving information from configured flow exporters. IAM Service {iasvc} Identities collection.
Logon Acquisition Manager {lam} Identities collection with respect to MLCs.
Logon Flow {logons} Receiving logon events from connected Domain Controllers. License {lic} Activation and license registration.
System Performance {perf} Output from top.
Enabling identities collection
To enable identity collection for a Domain, follow these steps (which are described in further detail in subsequent parts of this section):
1 Define the DNS server(s) and NTP server
2 Collect the certificate common name and hash values 3 Install and configure a McAfee Login Collector
4 Define the identities address space 5 Encrypt credentials for domains 6 Add a domain to the Firewall Profiler
Note: It is assumed you are starting from the point of at least already configuring and activating the Firewall Profiler (as described in Deploying a Firewall Profileron page 9) and that you have already completed the tasks described in Getting started quicklyon page 18. Therefore, as shown in Figure 7, you have a McAfee Firewall Enterprise configured as a data feed and able to communicate with the Firewall Profiler, and you have Domain Controllers and at least one DNS waiting to be connected.
Figure 7 Installed and activated Firewall Profiler
Define the DNS server(s) and NTP server
1 Log on to the Firewall Profiler web interface.2 Click Configuration.
3 Type the IP addresses of the DNS and NTP servers you want to use. You can specify multiple DNS servers by separating their IP addresses with a comma. The DNS servers you specify must be authoritative for the Domains you define.
Figure 8 Servers section of General tab for Configuration
4 Review Enabling identity collection progress with DNSon page 22 and then proceed to Collect the certificate common name and hash valueson page 22.
Enabling identity collection progress with DNS
You have now defined the IP address for the DNS server on the installed and activated Firewall Profiler.
Figure 9 Installed Firewall Profiler with DNS server defined
Collect the certificate common name and hash values
1 Log on to the Firewall Profiler web interface.2 Click Configuration and then copy the values for Certificate Common Name and Certificate Hash.
Figure 10 Basic section of General tab for Configuration
You use the Certificate Common Name and Certificate Hash to identify the Firewall Profiler to a McAfee Login Collector (see McAfee Login Collector configuration—remote tab on page 23).
3 Proceed to Install and configure a McAfee Login Collector.
Install and configure a McAfee Login Collector
For complete information on installing and activating the Firewall Profiler, see Appendix B, Installing a McAfee Login Collector.
When you install a McAfee Login Collector, you have the option to configure it at that time. You can also configure it at any time. For more information, see Configuring the MLCon page 75. The Remote tab is duplicated here for convenience.
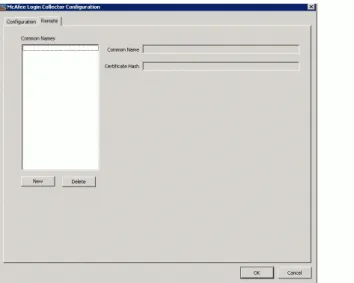
McAfee Login Collector configuration—remote tab
Use the Remote tab of the McAfee Login Collector Configuration window to identify Firewall Profilers.
Figure 11 Remote tab of McAfee Login Collector Configuration
1 Ensure Certificate Hash is selected for Certificate Checking in the Client Connection section of the Configuration tab.
2 Type the Certificate Common Name into the Common Name field and type the Certificate Hash into the Certificate Hash field on the Remote tab.
3 Click OK to commit the information, or click Cancel to quit without saving. Changes are also committed if you click the Configuration tab.
4 Review Enabling identities collection progress with MLC and then proceed to Define the identities address space.
Enabling identities collection progress with MLC
You now have a McAfee Login Collector integrated as part of the system.
Define the identities address space
The Identities Address Space feature enables you to constrain the set of IP addresses within which the Firewall Profiler will collect and establish identities. You can specify only those areas of your network that are critical for reporting with identities. By constraining the realm of identity collection, you can also avoid stressing your system from trying to establish identities for non-network IP addresses, such as those from the Internet.
By default, there are no constraints on identity collection. For more information, see Identities Collectionon page 48.
To define the Identities Address space:
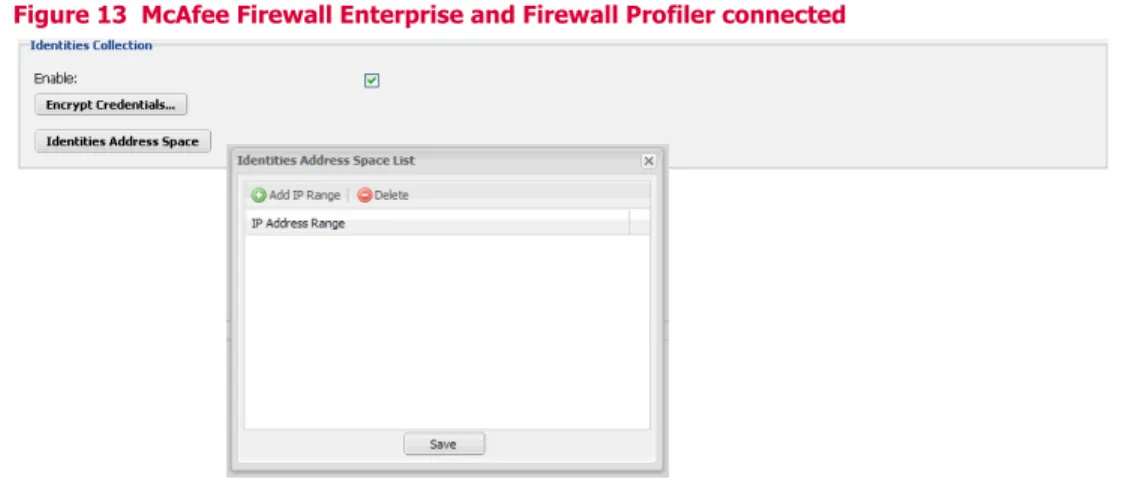
1 Click Configuration and then click Identities Address Space in the Identities Configuration section.
Figure 13 McAfee Firewall Enterprise and Firewall Profiler connected
2 Click Add IP Range and then specify an IP address range. Repeat this step for as many IP address ranges as you want to define from which identities are collected.
3 Click Save.
4 Proceed to Encrypt credentials for domains.
Encrypt credentials for domains
As a security measure, you may want to require that the credentials you supply for domains are encrypted on the Firewall Profiler. When credentials are encrypted, the Firewall Profiler must decrypt them to use them to connect to a Domain Controller. This has the effect of also requiring the passphrase whenever you attempt to add, remove, or edit a domain in the web interface because Firewall Profiler must access the encrypted credentials file to perform those actions.
Figure 14 McAfee Firewall Enterprise and Firewall Profiler connected
Add a domain to the Firewall Profiler
Configuring a domain on the Firewall Profiler involves the following: • Add a Domain
This is described in this section.
• Add a McAfee Login Collector to the domainon page 26
• Assign a McAfee Login Collector to watch a Domain Controller within the domainon page 26
To add a Domain:
1 Log on to the Firewall Profiler web interface.
2 Click Configuration and then click the Domains tab.
Figure 15 Domains tab for Configuration
3 Click Add Domain and then specify the necessary information. You must supply the appropriate credentials for managing domains if you are prompted. See Encrypt credentials for domainson page 24.
Figure 16 Adding a domain
Note: For information on ensuring you are using the correct credentials, see Verifying the domain credentials
on page 64. The Domain Controllers must be logging Security events. 4 Click Save. Firewall Profiler automatically progresses to the MLC tab.
5 Proceed to Add a McAfee Login Collector to the domain.
Table 7 Domain properties
Option Description
Domain Name Name of the domain you are adding to Firewall Profiler.
User Name and password Credentials required to log in to the Domain Controller managing the domain.
Ensure you supply the proper credentials for logging on to the Domain Controller. For more information, see Verifying the domain credentialson page 64.
Add a McAfee Login Collector to the domain
For the specified Domain, you must identify the McAfee Login Collector that provides logon information. For information about installing a McAfee Login Collector, see Appendix B, Installing a McAfee Login Collector. To start, you should add just a single MLC.
1 Click Add MLC.
Figure 17 Adding an MLC
2 Specify a name, IP Address and Port number. The MLC name is an arbitrary label you provide for use in Firewall Profiler; you can obtain the IP address and port number from the MLC itself.
3 Click Save and then accept the certificate for the MLC. Firewall Profiler automatically progresses to the Domain Controllers tab (described in Assign a McAfee Login Collector to watch a Domain Controller within the domain).
Assign a McAfee Login Collector to watch a Domain Controller within the domain
For the specified Domain, you must assign an MLC to watch a particular Domain Controller.
Note: When you add the Domain, Firewall Profiler determines which Domain Controllers are available so that they appear automatically.
To assign an MLC to watch a Domain Controller:
1 Click a Domain Controller.
Figure 18 Assigning an MLC to watch a DC
2 Click Select... in the Watch From MLC column and then select an MLC.
3 Click Save.
You now have identities collection enabled for a domain on the Firewall Profiler. Proceed to Ranking preferred user groups.
Ranking preferred user groups
With identities collection enabled, you may find that the user groups you see being reported on in the Live Data pages are not what you would like to see. By default, Firewall Profiler assigns a user to a group based on the groups the user is assigned to in the Active Directory and then by a formula that determines the number of active users in those groups. The user is assigned to the group with the fewest active users. You can change this default ranking by creating a list of preferred groups and then ranking them in the order that provides the results you want.
To alter the ranking of user groups:
1 Log on to the web interface as either an Administrator or an Operator.
2 Click Reporting and then Preferred Groups.
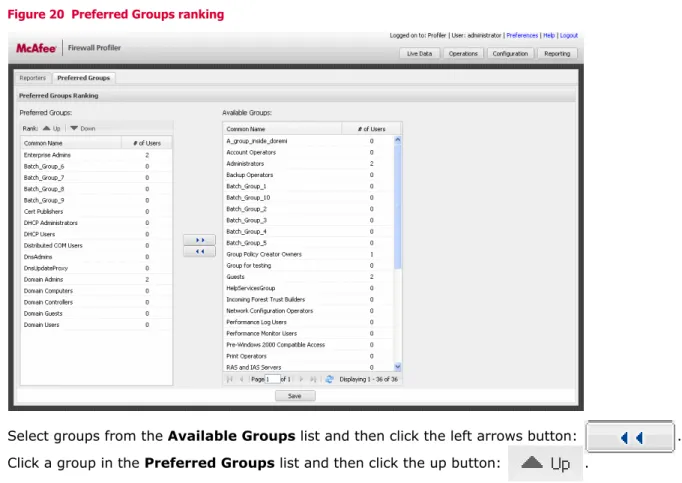
Figure 20 Preferred Groups ranking
3 Select groups from the Available Groups list and then click the left arrows button: .
4 Click a group in the Preferred Groups list and then click the up button: .
5 Use the Up and Down buttons to move user groups within the Preferred Groups list, and add or remove user groups using the left and right arrows buttons.
Remember to click Save when you are finished ranking user groups. Your changes are not committed until you click Save.
What’s next
Following are some of the things you may want to do next:
• If you have not already done so, verify your Firewall Profiler is behaving as expected as described in
Reviewing system statuson page 20.
• For instructions on how to configure identities collection, see Enabling identities collectionon page 21. • For a reference of the Live Data web interface, see Working with Live Dataon page 29.
• For a reference of the managing and configuring elements of the web interface, see Managing the Firewall Profileron page 41.
Following are some examples of management tasks you may want to do:
For information on this... See...
Adding flow exporters as data feeds Flowon page 46
Adding Reporters Adding a Reporteron page 57
Configuring access to an ePO server ePOon page 55
Utilizing alerts Alertson page 49 andServerson page 48
4
Contents Live Data page Live Data interface
Viewing the remediation summary Viewing the remediation details
Live Data page
The Live Data page enables you to visualize firewall actions in real-time so that you can quickly address the fundamental question of whether or not a network access problem is caused by the firewall.
Figure 21 Live Data page
The presentation of McAfee Firewall Enterprise audit data in the Live Data page provides: • A view of the current firewall state, enabling situational awareness
• A summarization of firewall actions with a high level of abstraction for root cause analysis • Compare mode for viewing trends in firewall actions (allows and denies) and changes in volume • Presentation of and analysis on Flow data (NetFlow v5 and v9, JFlow)
Further delving into the Remediation Summary and Remediation Details pages provides:
• A presentation of firewall audit details that are most relevant to troubleshooting access problems • On-demand query of firewall rule sets to enhance context for analysis
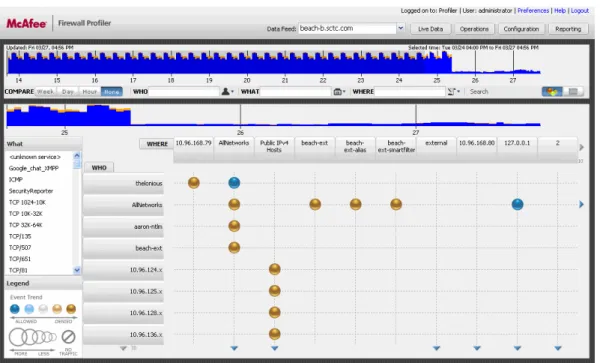
Live Data interface
When you first log on to the Firewall Profiler web interface, you are presented with the Live Data page viewing data from the first data feed (if any are defined) in alphabetical order.
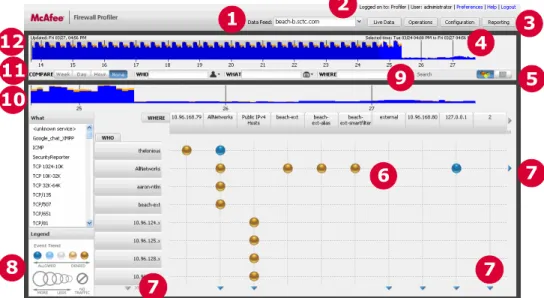
Figure 22 Live Data interface
Following are the means with which you can work with the available data (see Figure 22 for locations of these items on the Live Data page):
1
2
3
4
5
6
7
8
9
7
7
10
11
12
Use this... To do this...
Data feed selector View data from different feeds. See Selecting a data feedon page 31. Notification of logged
on status Determine to which Firewall Profiler you are logged on, and as what user account. The Firewall Profiler name is specified in Basicon page 47. Buttons and links for
managing Manage and configure the Firewall Profiler (see on page 41). Firewall Profiler web interface for managing Selected time frame
status message View the message indicating the currently selected time frame, and, if applicable, the time frame being compared. Live Data view
selector Toggle between the bubble chart view (shown in view (shown in Figure 38) for the available data. See Figure 22Viewing the remediation summary) and the Remediation Summary on page 37.
Bubble chart Determine what is happening on the network (see Reading event trendson page 36). More available
indicators See more items in the row or column. For example, click the arrow to see more sources (WHO), or more sources for a particular destination (WHERE), or more destinations for a particular source.
Bubble chart legend Analyze the bubbles in the bubble chart. The bubble sizes and colors indicate the nature of the trends in the network traffic. See Reading event trendson page 36.
WHO, WHAT and
WHERE filters Narrow your view of the available data based on the selected criteria. See (source)on page 32, Filtering on WHAT (services)on page 33, and Filtering on WHERE Filtering on WHO (destination)on page 33.
Trend chart details View allows and denies, along with firewall policy change indicators, for the time frame selected from the trend chart. See Viewing trend chart detailson page 31.
Comparison selector Compare two time frames to determine the nature of any trends occurring in network traffic. For example, a surge of denies, or disappearing traffic. See Comparing time frameson page 34.
1 2 3 4 5 6 7 8 9 10 11
Selecting a data feed
The first action to take on the Live Data page is to select a data feed. For information on defining data feeds, see Data feedson page 44 and Flowon page 46.
Figure 23 Data feed selector
Click on the drop-down list and then select a data feed. The Live Data page updates based on available data for that feed.
Selecting a time frame
With a data feed selected, you should select a time frame in the trend chart. By default, the selected time frame is seventy-two (72) hours plus whatever part of the current hour is available.
Note: All time stamps are normalized to UTC when events are received on the Firewall Profiler from a McAfee Firewall Enterprise. You are always looking at your own local time regarding events in the web interface. Figure 24 Trend chart
To select a time frame, click anywhere in the trend chart and the Select Time Frame window displays.
Figure 25 Select Time Frame window
Viewing trend chart details
The currently selected time frame is displayed in the trend chart details below the filters.
Figure 26 Trend chart details
The granularity of the trend chart details depends on how much time is selected in the trend chart. If the time frame you select is less than or equal to forty-eight (48) hours, you can move the mouse over the selected area and see the number of allows and denies for five (5) minute increments.
Figure 27 Mouse over increments
McAfee Firewall Enterprise rule change indicators
In the trend chart details, rule changes are indicated by light blue lines. If you hold the mouse cursor over the light blue line, the time of the rule change is displayed below the bottom chart line. You know you are over a rule change indicator because you only see the date and time and not the number of allows and denies. You can use this information to narrow your time frame selection around a rule change.
Figure 28 Trend chart details displaying rule change indicators
Using the WHO, WHAT, and WHERE filters
To get the most out of the WHO, WHAT and WHERE filters, you should have some kind of starting point from which you want to search for more specificity in the available data. For example, do you know if a particular source (WHO) is having difficulties, or maybe a destination (WHERE) that is causing issues?
Figure 29 WHO, WHAT, and WHERE filters
Using the filters, you can narrow the scope of the available data. Not all filter options create an immediate impact on the view of the data. Some, such as IP Address for WHO and WHERE, may not be readily apparent until you view the Remediation Summary or Remediation Details pages.
Note: The values you specify for these filters remain in effect when you click on a bubble to view the Remediation Summary page.
Filtering on WHO (source)
The WHO filter enables you to narrow your search for the source of a network event. The Reporter and Firewall Object options for this filter directly affect the view of data on the Live Data page and the change is immediately apparent because the content of the WHO column changes to reflect your selection. The User Name and User Group options also directly affect the view of data, if you have identities collection enabled (see Enabling identities collectionon page 21). When you filter on IP Address, it is not immediately apparent because there is no view of IP Addresses on the bubble chart. The data, however, is still
constrained by the filter and only those IP addresses that qualify are visible when you view the Remediation Summary or Remediation Details pages.
• Select an option from the drop-down list, type a value and then press Enter or click Search. Ensure you have the desired filter option selected when you specify a value for the filter. If you find that you are not seeing what you expect, it may be because you have entered a value that is not appropriate for the filter option that is currently selected.
Figure 30 WHO filter
Option Description
User Name Provides results only when identities collection is enabled. The name of a user retrieved from the Active Directory.
Filtering on WHAT (services)
The WHAT filter enables you to narrow your search for information by filtering on the port number or service involved. This filter directly affects the view of data on the Live Data page and the change is immediately apparent because the content of the What box changes to reflect your selection.
• Select an option from the drop-down list, type a value and then press Enter or click Search. Ensure you have the desired filter option selected when you specify a value for the filter. If you find that you are not seeing what you expect, it may be because you have entered a value that is not appropriate for the filter option that is currently selected.
Figure 31 WHAT filter
Filtering on WHERE (destination)
The WHERE filter enables you to narrow your search for the destination of a network event. The Reporter and Firewall Object options for this filter directly affect the view of data on the Live Data page. When you filter on IP Address, it is not immediately apparent because there is no view of IP Addresses on the bubble chart. The data, however, is still constrained by the filter and only those IP addresses that qualify are visible when you view the Remediation Summary or Remediation Details pages.
• Select an option from the drop-down list, type a value and then press Enter or click Search. Ensure you have the desired filter option selected when you specify a value for the filter. If you find that you are not seeing what you expect, it may be because you have entered a value that is not appropriate for the filter option that is currently selected.
Figure 32 WHERE filter
Firewall Object Provides results only when a McAfee Firewall Enterprise is selected as a data feed. IP Address Any IP Address. Note that WHO items of the form N.N.N.x, where N is a one to three
digit number, are actually synthetic Reporters created by Firewall Profiler. You may want to consider creating Reporters that contain those IP addresses rolled up into the synthetic Reporters.
Option Description
Port Port number for a network application. Service Name of a network service.
Option Description
Reporter The name of a Reporter. Reporters can be defined (see Adding a Reporteron page 57) or synthetic (in the case of Flow (see Flowon page 46).
Firewall Object The name of an object as defined on the McAfee Firewall Enterprise selected as a Data Feed.
IP Address Any IP Address. Note that WHERE items of the form N.N.N.x, where N is a one to three digit number, are actually synthetic Reporters created by Firewall Profiler. You may want to consider creating Reporters that contain those IP addresses rolled up into the synthetic Reporters.
Comparing time frames
The compare feature enables you to compare the selected time frame with an equivalent previous time frame. This can help you determine whether there is an issue with network behavior. You can quickly determine whether there is:
• a trend toward allowed traffic, perhaps indicating a new influx of network users or maybe a firewall rule that is too lax or incorrect and therefore not in place
• a trend toward denied traffic, perhaps indicating an overly aggressive firewall rule, or a change in an application
• a sudden change in network traffic, perhaps indicating that an application is down or was moved
Selected time frames and comparison options
Only those compare buttons that are applicable are enabled when you select a time frame. For definitions on the compare buttons, see Table 8.
To compare one time frame to another:
1 Open the Select Time Frame window by clicking somewhere in the trend chart.
Figure 33 Select Time Frame window
2 Specify a beginning and ending time frame by clicking the drop-down lists and selecting the appropriate values.
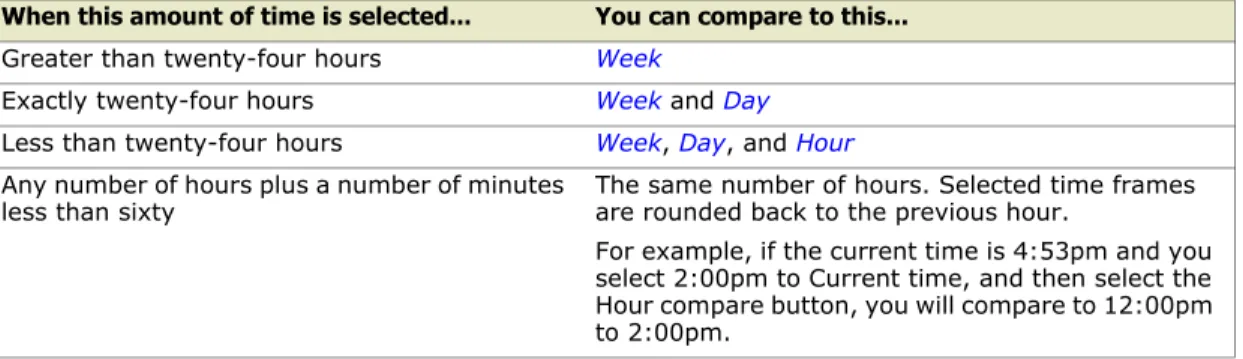
3 Select a COMPARE option (Figure 34 on page 35). Only those options that are applicable for the currently selected time frame are functional (see Compare button definitionson page 35).
When this amount of time is selected... You can compare to this... Greater than twenty-four hours Week
Exactly twenty-four hours Week and Day
Less than twenty-four hours Week, Day, and Hour
Any number of hours plus a number of minutes
less than sixty The same number of hours. Selected time frames are rounded back to the previous hour. For example, if the current time is 4:53pm and you select 2:00pm to Current time, and then select the Hour compare button, you will compare to 12:00pm to 2:00pm.
Figure 34 Compare options
4 View the resulting bubble chart graph to determine what trends, if any, have transpired between the two time frames. By holding your mouse cursor over a bubble, you can view the differences in allows and denies between the two times.
Figure 35 Mouse-over a bubble
Note: You can verify that you are comparing the desired time frames by reviewing the selected time frame status message:
Figure 36 Selected time frame status message
5 Continue to refine your comparison or proceed to view the remediation summary by clicking a bubble or the Remediation Summary view from the Live Data view selector.
Note: When you click a bubble, both the WHO and WHERE filters are populated. Table 8 Compare button definitions
Option Description
Week Compares the current time frame selection to the same time frame from one week previous, if there is enough data available. For example, if you select a time frame of 8:00am to 1:00pm on Wednesday, April 8 and then click Week, you are comparing data to 8:00am to 1:00pm on Wednesday, April 1.
Day Compares the current time frame selection to the same time frame from one day previous, if there is enough data available. For example, if you select a time frame of 8:00am to 1:00pm on Wednesday, April 8 and then click Day, you are comparing data to 8:00am to 1:00pm on Tuesday, April 7.
This option is functional only if the selected time frame is twenty-four (24) hours or less.
Hour Compares the current time frame selection to the same time frame immediately available, if there is enough data available. For example, if you select a time frame of 2:00pm to 7:00pm on Wednesday, April 8 and then click Hour, you are comparing data to 8:00am to 1:00pm also on Wednesday, April 8. In other words, think of the Hour compare function as a mirror; whatever number of hours are available in the selected time frame are included in the comparison going back from the starting point of the selected time frame. A five hour time frame is compared to the five hours immediately preceding.
Time is always rounded down to the hour for the purposes of comparing. For example, if the current time is 4:53pm and you select 2:00pm to Current time, and then select the Hour compare button, you will compare to 12:00pm to 2:00pm.
This option is functional only if the selected time frame is less than twenty-four (24) hours.
None The default selection None means you are looking at the currently selected time frame only (see Figure 22).
Reading event trends
When you first select a time frame (see Selecting a time frameon page 31), the Live Data bubble chart view displays the current traffic results. You can see the current bandwidth, number of allows and number of denies by holding the mouse cursor over a bubble. For example:
When you compare two time frames (see Comparing time frameson page 34), the bubble details change to display both before and now data. For example:
Bubbles tend to change color and size when you view data while comparing two time frames. The meaning of the bubbles is always shown in the bubble chart legend (as seen in Figure 22 on page 30). Following are examples of the available bubble types.
Figure 37 Bubble examples
When comparing time frames, you are typically looking for meaningful changes in trends. For example, you want to know when there is a sudden increase in Denies in events, or maybe a sudden drop in events. The bubble chart always displays what is occurring with network events for the selected time frame. When you are comparing, the bubble type indicates what has happened with events relative to the compared time frame.
For example, you could narrow your view of the data to a specific set of users and a specific system. By comparing your current time frame with a previous time frame, you could see from the bubble type whether something occurred that should have your interest. A large bubble in the comparison view would indicate that relative to the previous time frame, there has been an increase in the number of events. A dark orange color would further indicate that the trend is heavily toward denies. This increase in the number of events, and the increase of those events being denies may indicate a problem that requires your attention. For example, if there was recently a firewall policy change, there may be a problem with the rule that was introduced or changed. You can click on the bubble to see the Remediation Summary page (see
Viewing the remediation summaryon page 37) and then from that the Remediation Details page (see
Viewing the remediation summary
To view the current data as a table, click the Remediation Summary selector from the Live Data view selector.
The Remediation Summary page presents a quick summary of events: whether the event was allowed or denied, the source and destination, the application involved, a count of connections, and the root cause and rule name (supplied by the McAfee Firewall Enterprise currently selected as the data feed).
You can also change to the Remediation Summary page by clicking a bubble in the bubble chart. In this case, the WHO and WHERE filters are populated with the values taken from the intersection of the bubble you clicked.
The resulting view of the data is shown in Figure 38. Any values you specified for the WHO, WHAT, or
WHERE filters are honored in the resulting data even if, as with specifying an IP address for WHO, it was not immediately obvious when viewing the bubble chart.
You can review, in the title bar area of the Remediation Summary table, what filtering was applied to the data when you clicked on the bubble (labeled as Filtering from Bubble). For example, for Source, you can see whether it was a Reporter or a User Group. Note that only one What filter (from the list next to the
WHO column of the bubble chart) is active, and it is identified by the label Application.
• To return to the bubble chart view, click the bubble chart selector from the Live Data view selector. Your view of the data for the bubble chart is the same as before you clicked the bubble, enabling you to drill down again by clicking a different bubble.
• To remain on the Remediation Summary page, but remove any filtering that was applied by clicking on a bubble, click the Clear Bubble Filter button.
Figure 38 Remediation Summary page
To sort a column, click on it. Clicking again toggles between sorting in ascending or descending order. Use the scroll bar on the right, and the paging function along the bottom to navigate multiple pages of data.
Table 9 Remediation Summary page fields
Option Description
Details Click the Details icon to view the Remediation Details page (see Viewing the remediation detailson page 38)
For descriptions of the rest of these fields, see Remediation Details page fieldson page 38.
Viewing the remediation details
On the Remediation Summary page (see Viewing the remediation summaryon page 37), click the Details icon to view the Remediation Details page.
You can review, in the title bar area of the Remediation Details table, what filtering was applied to the data when you clicked on the bubble. For example, for Source, you can see whether it was a Reporter or a User Group. The filtering from the bubble details are removed when you click the Clear Bubble Filter button on the Remediation Summary page.
Figure 39 Remediation Details page
Table 10 Remediation Details page fields
Option Description
Details Click Back to return to the Remediation Summary page.
Action Visible for McAfee Firewall Enterprise data feeds only—Specifies whether the action was Allowed or Denied. When the action is Denied, you can review the values for Root Cause and Rule Name to investigate why the traffic was denied.
Source The source (or WHO, to Firewall Profiler) for the network event. Application The name of the service involved in the network event.
Destination The destination (or WHERE, to Firewall Profiler) for the network event.
Root Cause Visible for McAfee Firewall Enterprise data feeds only—The root cause for the traffic being denied, taken from the data received from the McAfee Firewall Enterprise. There is no value for this option when the action is Allowed. Possible values for Root Cause are: General Attack, Application Defense violation, URL filter by SmartFilter, Denial of Service Attack, Buffer Overflow Attack, Protocol Violation, Signature-based IPS, SPAM, Virus, TrustedSource: Bad Reputation, Policy Violation: Improper Source, Service or Destination, Policy Violation: IPFilters, Policy Violation: User Failed auth to Firewall, Policy Violation, and NetProbe. For more information on these, see your McAfee Firewall Enterprise (Sidewinder®) documentation.