THE USE OF LOCAL AVAILABLE MATERIALS IN DEVELOPING A DIGITAL RESISTANCE BASE SOIL
NITRATE METER
Chiwetalu U. J.
Department of Agricultural and Bio-resources Engineering, Faculty of Engineering
Enugu State University of Science and Technology (ESUT)
Mbajiorgu C. C.
Department of Agricultural and Bio-resources Engineering, Faculty of Engineering
University of Nigeria, Nsukka, Enugu State-Nigeria (UNN)
Ozibo B. N.
Department of Physics, Geology and Geophysics, Faculty of Science
Federal University, Ndufu-Alike Ikwo, Ebonyi State, Nigeria
ABSTRACT
The study of the nitrogen cycle has intensified, focusing on nitrogen loss pathways next to the more
traditional study topics such as plant nitrogen uptake in order to maintain high productivity and
healthy environment. This work presents the development of a digital soil nitrate meter for
measuring the quantity of nitrate in a given soil sample. This nitrate meter was developed following
the working principles of resistance based meters. It was tested by measuring the nitrate content of
seven samples. For each sample, the nitrate concentration was taken at 60 seconds and 90 seconds
respectively. The result obtained for sample 1, 2, 3, 4, 5, 6 and 7 at 60 seconds were 000.0, 017.5,
090.4, 057.3, 054.5, 042.0, and 041.2 respectively. Thus, at 90 seconds the following results were
obtained for the same samples; 000.0, 017.7, 092.2, 058.4, 056.2, 042.8 and 041.8, all in milligram
per litre (mg/l). The results obtained for these samples were validated using the ones obtained with
the standard nitrate solutions and nitrate colour card. However, it was observed that the
measurements obtained with the newly developed soil nitrate meter compared well with the
standard nitrate solution and nitrate colour card.
INTRODUCTION
Nitrogen exists in the soil system in many forms and changes (transforms) very easily from one form
to another. There are three major forms or state of nitrogen in the soil namely: organic nitrogen
(Org-N), ammonium nitrogen (NH4+-N), and nitrate nitrogen (NO3-N). The Nitrate (NO3-) is the form of
reactive Nitrogen (N) that is most susceptible to leaching and runoff; thus, a more thorough
understanding of nitrification and NO3(-) availability is needed if we are to accurately predict the
consequences of residential expansion for soil and water quality.
Nitrate is a vital component in all living ecosystems because it is the most readily assimilated form of
nitrogen by plant. Most plants obtain the nitrogen they need as inorganic nitrate from the soil
solution. Plants cannot use the nitrogen in the organic form. Nitrates are nitrogen compounds that
occur naturally in the soil, but may also be introduced through fertilizer application. Plants use
nitrogen in nitrates for their own metabolism and to produce proteins. Nitrate is formed from the
chemical combination of nitrogen and oxygen. Nitrate is extracted from the soil through the roots
and is distributed in the whole plant to be converted to protein compounds with high energy through
photosynthesis. Nitrates of fresh soil samples can be extracted quantitatively using a K2SO4.The
nitrogen cycle is biologically influenced by prevailing climatic conditions along with the physical and
chemical properties of a particular soil, (John, et.al, 2014).
Furthermore, nitrate is normally extracted from soils by shaking a representative sample of known
weight with a known volume of 2M KC1 (Bremner and Keeney, 1966). However, soil nitrate can be
measured in the laboratory and as well in the field using an instrument called Nitrate Meter.
Laboratory methods for measuring soil nitrate involve the cost of transporting samples and the delay
in obtaining the results, so a field test has advantages.
However, this paper presents the Development and Testing of Digital Resistance Base Soil Nitrate
Meter for use in measuring in-soil nitrate levels.
PROBLEM STATEMENT
Since the realization that excess Nitrogen (N) has negative effects on soil, water, air, ecosystem and
human health, and thus may lead to significant environmental pollution or contribute to global
warming, this study therefore highlights the need for employing the use of Nitrate meter in
AIM AND OBJECTIVES OF THE STUDY
The aim of this study is to develop a Digital Resistance-Base Soil Nitrate Meter using locally available
material in Nigeria for use in measuring in-soil nitrate levels. The following are the specific objectives,
they include;
To develop a nitrate meter using the working principles of resistance based meters.
To test the nitrate meter of different soil samples and obtain results for their nitrate
concentration.
To validate the results from the newly developed nitrate meter with the standard nitrate solution
and nitrate colour card.
LITERATURE REVIEW
Ezrin et al (2015) conducted a research on the development of real time soil nutrient mapping system
in paddy field. This was in line with the application of advanced sensing technology in agriculture for
an effective field management and improved crop yield. The used 118 lots of a paddy field located in
Sawah Sempadan, Tanjung Karang, Selangor as the study area and a Veris 3100 Soil EC Sensor for
measuring the soil apparent Electrical Conductivity (ECa). They also carried out the nutrient analyses
of the soil samples collected from the 118 lots using Kjeldahl digestion technique. The results
produced form their system was nearly identical to a Kriging map produced via ArcGIS software. They
concluded that their findings indicated that the soil nutrient variability map was possible to be
produced in real-time basis without engaging any tedious work in the field and it would be reliable
for use in the site for best fertilizer management practices.
A study on the development of a sensor array consisting of three different ion-selective electrodes for
simultaneous determination of soil macronutrients was carried out by Kim et al (2006) in
ion-selective electrodes for simultaneous real-time analysis of soil macronutrients. It was in a quest
for variable-rate nutrient management. They used Kelowa Solution to evaluate the macronutrients (N,
P and K) of seven US Corn Belt soils and Ion-Selective Electrodes for Sensing NO3-N and K in the Soil
Extracts. Their results showed a high coefficient of determination (r2> 0.9) and almost 1:1 relation
between the levels of nitrate-N and potassium obtained with the ion-selective electrodes and
standard analytical instruments.
Shaw et al (2013) assessed the potential for ion selective electrodes (ISE) and dual wavelength UV
identified the limited accuracy of fertilizer recommendations for nitrogen which could be improved
through the use on-farm soil rapid tests. They collected three soil samples from Henfaes Research
Station, Abergwyngregyn, UK (53°14′ N, 4°01′ W). They determined the soils NO3- using Dual
Wavelength UV Spectroscopy and NO3− ISE (ELIT 8021) - with a solid state PVC polymer matrix
membrane which was pre-conditioned in a 1000mgL-1NO3- solution for 4 h and calibrated using NO3−
solutions of range (1000, 100, 10, 1, 0.5 mg NO3−L−1). The results they got were to the
internationally-approved standard laboratory method. The ISE rapid test procedure gave a near 1:1
response and coefficient of determination, r2 = 0.978, 0.968, 0.989 respectively for the three soils and
that with the dual wavelength UV spectroscopy were r2 = 0.978, 0.983, 0.991. They gave that the
accuracy with ISE rapid test was reduced at concentrations <10 mg NO3− L−1) and they concluded that
both ISE and dual wavelength UV spectroscopy have clear potential to be used for the rapid on-farm
determination of soil NO3− concentration.
For a real-time prediction of soil nitrates using an intact core extraction procedure, Price et al (2003)
researched on rapid nitrate analysis of soil cores using ISFETs. They collected four soil samples from
Illinois which were Ade loamy sand, Proctor clay loam, and two drummers silty clay loams (which
differed in organic carbon content). In the extraction system, they held 600g of each of the four soil
samples between two filters and pushed an extraction through it. The extraction solution was
sampled at the exit face of the core and routed to the ion-selective field-effect transistor/flow
injection analysis (ISFET/FIA) system operating at 100Hz. at 100 Hz. Their results indicated that nitrate
extraction of the soil cores was successful, and that data descriptors based on response curve peak
and slope of the ISFET nitrate response curve might be used in tandem in a real–time prediction
system.
Design of an economic, reliable and automated system for the acquisition of real-time data on the
level nitrate nitrogen (NO3-N) in the soil is one of the many attributes of precision agriculture
technologies. Sibley et al (2008) studied field-scale validation of an automated soil nitrate extraction
and measurement system. They developed soil nitrate mapping system (SNMS) for collecting the
required data. The soil samples were taken from #203 and #207 fields in the Nova Scotia Agricultural
College (NSAC) farm, seeded with carrot and spring wheat respectively. The results they obtained
from the nitrate extraction and measurement system (NEMS) were compared with that from
and coefficient of efficiency (CE) techniques. They posited soil nitrate measurements from NEMS and
standard laboratory for the variety of the field conditions tested was excellent.
Shaw (2015) in his work titled “developing in-situ and real-time methods of soil nitrogen
determination”, he said that excess application of nitrogen to crop can lead to environmental
pollution, contributing global warming. He went further in carrying out micro dialysis-derived
diffusive flux measurement of the soil nitrogen in the forms of NH4+ and NO3-. He took eight grassland
soil samples up an altitudinal gradient and evaluated its nitrogen content using micro dialysis. Also,
he used conventional soil core batch extraction (using 0.5 M K2SO4 or distilled H2O). The two results
were compared using one-way ANOVA the Fisher’s least significant difference post hoc test. The two
results were similar in that the dominant N-form was the same regardless of the method used.
In summary, the review shows that few researches today have been done on the development and
testing of a nitrate meter for field use locally. This triggered this research work.
MATERIALS AND METHODS
LOCATION OF DEVELOPMENT OF THE NITRATE METER
The nitrate meter was developed at the laboratory unit of the Electrical and Electronics Engineering
Department, Faculty of Engineering, University of Nigeria Nsukka, Enugu, Nigeria. The facilities in this
laboratory were fully adopted.
MATERIALS
The materials used for this work are; Resistor, 7805 IC, Capacitor, Microcontroller(PIC16F877A),
LM741 IC, Liquid crystal display (16x2), Iron steel probe, Light emitting diode (LED), 4MHZ crystal,
Button, Connection wire, Mother board, 9v battery.
Equipment: Vero Board, Digital Multi meter, Soldiering iron, Screw driver, Standard nitrate kit,
METHOD
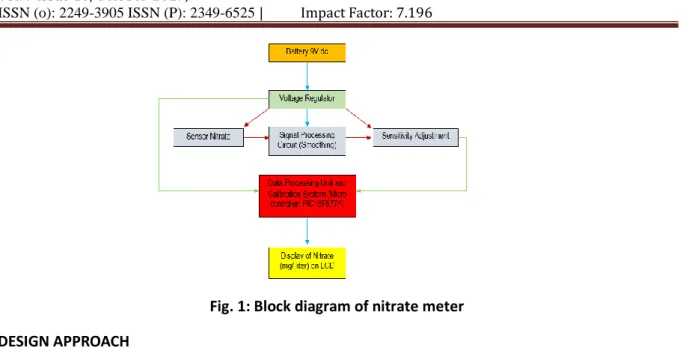
The system block diagram in figure 1, shows the working principles of the nitrate meter. This meter
adopted the working principle of an impedance based meter with a microcontroller system and an
insertion sensor probe to read the concentration of soil nitrate in water solution. Generally, the
impedance based nitrate meters use the relationship between the resistances of Nitrate to water
and when the electrode of the metering unit is in contact with soil-water solution containing nitrate,
Fig. 1: Block diagram of nitrate meter
DESIGN APPROACH
The most common approach in developing nitrate meters is simply to use a voltage divided circuit to
generate a voltage Vout, that is directly proportional to the concentration of nitrate, and then utilize a
microcontroller to measure the voltage within a given period to estimate the nitrate concentration in
mg/L or ppm. A voltage divided circuit was adopted for the development of this meter with an lm741
IC (operational amplifier) to obtain a smoothing output voltage respectively. The microcontroller
measure and displays the corresponding concentration of nitrate in mg/litre on the LCD (Liquid
crystal display) as a digital output. The output voltage generated by the system as a result of inflow of
current into the system has a direct relationship with the resistance of the nitrate in the soil–water
solution. The meter was calibrated to read nitrate concentration in mg/litre of water. In calibration of
the system, nitrate test solutions (#1 and #2) and soil sample were used as sources of nitrate,
standard solutions were prepared from 5mg/litre of distil water (H2O) to 160mg/litre. An
internationally and universally accepted fresh water nitrate colour code card was also a helpful tool
during the calibration of this device. This consists of a set of individual coloured rings or bands in
spectral order representing each digit of the resistors value. The colour change is an indication of the
concentration of nitrate in mg/l or ppm in the soil water solution which were matched with the
Plate 1: Developed Nitrate meter
TESTING PROCEDURE
The nitrate meter is controlled from a power button which turns on to indicate that the device has
been powered. A known quantity of soil sample was poured into 150ml conical flask and the meter
probe inserted into the test tube containing the soil water solution for its nitrate concentration
reading. Three quarter length of the robe must be in contact with the sample in solution for accurate
readings. The meter will stay for about 60seconds after being switched on before it will start to
display some reading at the LCD. The probe conducts some current which causes the movement of
voltage in the system. The voltage is measured directly at the analog to digital converter (A/C) of
microcontroller (pic16f877a). The voltage is converted back to corresponding nitrate in mg/litre and
displayed at LCD. When the probes are inserted in the soil-water solution sample of a readable level,
the change in nitrate content causes change in resistances which in turn causes change in the output
voltage. The voltage measured will be smoothing with op-amp comparator (LM741 IC) to remove
electrical noise from the system. The voltage will be converted back to corresponding nitrate in
mg/litre and display at LCD. Thus, seven samples were tested for their nitrate concentration following
the procedure stipulated above and the working principles shown in figure 1.
TEST SAMPLE COLLECTION
Seven different sample were collected and assessed for their nitrate concentration in mg /l
o Sample 1(distilled water): This was obtained from Conraws scientific equipment, Presidential
road Enugu.
o Sample 2 (store bore hole water in gee pee): This was obtained from Agricultural and Bio
o Sample 3(a mixture of bore hole water store in a gee pee tank and edible salt (half tea spoon
full).
o Sample 4 (soil sample collected from No. 4 Federal staff quarters Independence Layout, Enugu).
The sample was mixed with distilled water and was tested immediately.
o Soil sample 5 (soil sample collected from No. 4 Federal staff quarters Independence Layout,
Enugu). This was allowed to settle for 20minute before it was tested.
o Soil sample 6 (soil sample collected from Agricultural and Bio-resources Engineering research
farm, Faculty of Engineering, Enugu State University of Science and Technology, Enugu). The
sample was mixed with distilled water and was tested immediately.
o Soil sample 7(soil sample collected from Agricultural and Bio-resources Engineering research
farm, Faculty of Engineering, Enugu State University of Science and Technology, Enugu) but was
allowed to settle for 20 minutes before testing.
RESULT AND DISCUSSION
The results obtained for this work were grouped into two different categories;
1. Result obtained using standard solution of sodium nitrate and colour code card in testing
different samples
2. Result obtained using the developed resistor nitrate meter of this work in testing seven different
Table1: Standard solution of sodium nitrate and soil sample readings used for the calibration of the
nitrate meter
Solution (mg/l) or ppm
Vout (V) Time (sec) Input voltage(V)
5 1.50 60 4.96
10 1.60 60 4.96
20 1.80 60 4.96
30 2.00 60 4.96
40 2.21 60 4.96
50 2.42 60 4.96
60 2.61 60 4.96
70 2.80 60 4.96
80 3.00 60 4.96
90 3.22 60 4.96
100 3.41 60 4.96
110 3.60 60 4.96
120 3.82 60 4.96
130 4.10 60 4.96
140 4.24 60 4.96
150 4.44 60 4.96
160 4.63 60 4.96
An internationally and universally accepted fresh water nitrate colour code card developed as a
simple and quick way of identifying the concentration of nitrate in any given water solution was used
in determination of the nitrate concentration for each sample. The colour obtained for each sample
was matched with the colours in the nitrate colour code card and read as the concentration mg/lfor
each sample. The colour code card consists of a set of individual coloured rings or bands in spectral
order representing each digit of the resistors value. The colour change is an indication of the
concentration of nitrate in mg/l or ppm in the samples these were matched with the digital readings
of the nitrate meter. This consists of a set of individual coloured rings or bands in spectral order
representing each digit of the resistors value. Plate 2 below is a fresh water nitrate colour card
Plate 2: Fresh water nitrate colour code card
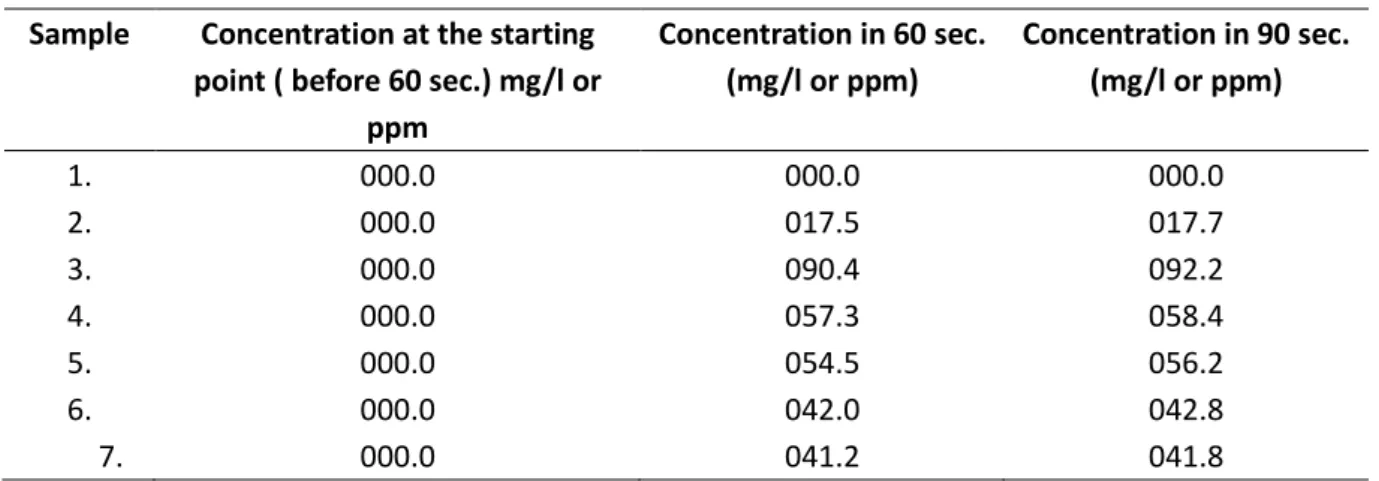
The result obtained for seven samples using the resistor nitrate meter of this work are given in Table
2 below.
Table 2: Result obtained using the developed resistor nitrate meter
Sample Concentration at the starting point ( before 60 sec.) mg/l or
ppm
Concentration in 60 sec. (mg/l or ppm)
Concentration in 90 sec. (mg/l or ppm)
1. 000.0 000.0 000.0
2. 000.0 017.5 017.7
3. 000.0 090.4 092.2
4. 000.0 057.3 058.4
5. 000.0 054.5 056.2
6. 000.0 042.0 042.8
7. 000.0 041.2 041.8
The result obtained for sample 1 recorded 000.0mg/l throughout the recording time, this is an
indication that the sample (distilled water) has no nitrate content. Sample 2, recorded 017.5mg/l at
60 seconds and 017.7 mg/l at 90 seconds. This showed that there are some traces of nitrate in the
sample though the water seems to be clean. Trace of nitrate in the water can be attributed to algae
growth in the tank. Five more samples were tested and the results obtained from them at 60 and 90
seconds respectively were recorded to be 090.4, 092.2 for sample 3, sample 4, 057.3, 058.4, sample 5,
054.5, 056.2, sample 6, 042.0, 042.8, sample 7, 041.2, 041.8 all in mg/l. The variation in the results
obtained for the seven samples tested was as a result of the differences in nitrate concentration for
each sample. Moreover the results obtained at 60 seconds was lower than that obtained at 90
seconds, this could be attributed to increase in time for the reading because 60 seconds is an
solution. However, it is expected that the meter reading will decrease at a longer time because of
settling of nitrate in the solution.
CONCLUSION
In this study, a Digital Resistance Base Soil Nitrate Meter was developed and tested. It may be noted
that the readings were not obtained exactly as given or stipulated in the nitrate colour code cards but
were found within a very close range. The resistance base nitrate meter is used to measure
concentration of nitrate in soil or water just like other nitrate meters. The advantage of this meter
over other types is that, it is very easy to operate with high level of precision especially when the
source of power is stable. Discrepancies in the readings may be as a result of human error during the
REFERENCE
Bremner, J.M. and D.R. Keeney. 1966. Determination and isotope-ratio analysis of different forms of
nitrogen in soils. I. Exchangeable ammonium, nitrate, and nitrite by extraction distillation
methods. Soil Sci. Soc. Am. Proc. 30:577-582.
Ezrin M. H., Aimrun W., Amin M. S. M. and Bejo S. K. (2015). “Jurnal Teknologi (Sciences &
Engineering) 78:1–2, p125–131.
John A. Lamb, Fabian G. Fernandez, and Daniel E. Kaiser: Extension Specialists in Nutrient
Management, AG‐FO‐3770‐B—(REVISED 2014).
Kim H. J., Hummel J. W. and Sudduth K. A. (2006). “Ion-Selective Electrodes for Simultaneous
Price R.R., Hummel J. W., Birrel S. J. and Ahmad I. S. (2003). “Rapid Nitrate Analysis of Soil Cores Using
ISFETs”. Transactions of the ASAE Vol. 46(3): xxx–xxx 2003 American Society of Agricultural
Engineer.
Real-Time Analysis of Soil Macronutrients”. Unpublished Dissertation presented to the Faculty of the
Graduate School University of Missouri-Columbia.
Shaw R. J. (2015). “Developing in-situ and real-time methods of soil nitrogen determination”.
Unpublished A thesis submitted to School of Environment, Natural Resources and Geography,
Bangor University.
Shaw R., Williams A. P., Miller A. and Jones D. L. (2013). “Assessing the Potential for Ion Selective
Electrodes and Dual Wavelength UV Spectroscopy as a Rapid on-Farm Measurement of Soil
Nitrate Concentration”. Agriculture 2013, 3, 327-341.
Sibley K. J., Astatkie T., Brewster G., Strik P. C., Adsett J. F. and Pruski K. (2008). “Field-scale validation