APPLICATION OF TAGUCHI APPROACH FOR OPTIMIZATION OF
CNC WIRE ELECTRICAL DISCHARGE MACHINING PROCESS
PARAMETERS
Bijendra Diwakar*Vedansh Chaturvedi** Jyoti Vimal**
ABSTRACT
In this research work, through the Taguchi methodology found the optimum process parameters for CNC wire electric discharge machining (WEDM). The object of the research paper to optimize the MRR and SR of work piece high chromium high carbon (HCHC) die steel tool. This methodology based on Taguchi’s, analysis of variance (ANOVA) and signal to noise ratio (S/N Ratio) to optimize the CNC WEDM process parameter. The design of experiment for machining process control parameter are Voltage(A), Discharge current(B), Pulse duration(C), Pulse frequency(D) and Wire Tension(E) L27 (3*5) standard orthogonal
array design of experiment three level and five parameter A, B,C,D and E respectively for each combination we have conducted one experiment. We have found the optimum results for CNC WEDM through the Signal to Noise ratio (S/N ratio).
Keywords: CNC WEDM, Taguchi’ method, ANOVA, MRR, SR , S/N Ratio.
*Research Scholar
INTRODUCTION
The Wire-cut EDM (WEDM) uses a slender wire diameter of the order of 0.15 –0.30 mm as an Electrode. Wire travels through the work piece from upper and lower wire guides. In
wire-cut EDM process the spark is occurring between continuous traveling wire and work piece. Here wire Acts like a band saw, but sparks instead of teeth do the cutting. The variations in the machining Parameters, such as the gap voltage, wire feed rate, gap current, and duty factor, greatly affect the Measures of the machining performance, for example, the SR and the MRR. Therefore, proper Selection of the machining parameters can result in better machining performance in the electrical Discharge machining process. In this study, a Reciprocating Wire-cut EDM machine, Electronica makes, EZZYCUT – PLUS model was used as the experimental machine. Cylindrical hard copper wire with a diameter of 0.25 mm was used as an electrode to erode a work piece of High-Carbon-High-Chromium (HCHC) die steel plate of the thickness of 30mm. The schematic diagram of the experimental setup is shown in Fig. 1. The work piece and electrode were separated by a moving dielectric fluid i.e. blend of tap water and coolant oil (S100) in a ratio of 20:1. The variation of MRR and SR with machining parameters and optimization of machining settings for maximum MRR minimum SR should be investigated experimentally and the obtained results should be interpreted and modelled statistically to understand closely the behaviour of machining rate and accuracy in CNC WEDM In this study, the effect of the machining parameters and their level of significance on the MRR and SR are statistically evaluated by using analysis of variance (ANOVA). The settings of machining parameters were determined by using Taguchi experimental design method.
METHODOLOGY
A. Analysis of Variance (ANOVA)
Analysis of variance (ANOVA) and F-test (standard analysis) are used to analysis the experimental data as given follows
Notation:
Following Notation are used for calculation of ANOVA method C.F. = Correction factor
T = Total of all result n = Total no. of experiments
ST = Total sum of squares to total variation.
Sx = Sum of the squares of due to parameter x (X = A, B, C, D,E)
NX1, NX2, NX3 = Repeating number of each level (1, 2, 3) of parameter X
XX1, XX2, XX3 = Values of result of each level (1, 2, 3) of parameter X
FX= Degree of freedom (D.O.F.) of parameter of X
fT = Total degree of freedom (D.O.F.)
fe = Degree of freedom (D.O.F.) of error terms
VX = Variance of parameter X
Se = Sum of square of error terms
Ve = Variance of error terms
FX = F-ratio of parameter of X
SX’ = Pure sum of square
CX= Percentage of contribution of parameter X
Ce = Percentage of contribution of error terms
CF = T2/n
ST = ∑i=1 to 27 Xi2 – CF
SX = ( XX12/NX1 + XX22/NX2 + XX32/NX3) – CF
FX = ( number of levels of parameter X) – 1
fT = ( total number of results)-1
fe = fT - ∑fX
VX = SX/fX
Se = ST - ∑SX
Ve = Se/fe
FX = VX/Ve
SX’ = SX – (Ve*fe)
CX = SX’/ST * 100%
Ce = ( 1- ∑PX)*100%
SIGNAL TO NOISE RATIO CALCULATION
Quality Characteristics:
S/N characteristics formulated for three different categories are as follows: Larger is Best Characteristic:
Data sequence for MRR (Material Removal Rate), which are higher-the-better performance characteristic are pre-processed as per Eq.1
Nominal and Smaller are Best Characteristics
Data sequences for SR , which are lower-the-better performance characteristic, are pre-processed as per Eq.1 &2
S/N= -10 log (x/s2x)...2
S/N= -10 log ((1/n) (∑(x2))...3
Where y^ is average of observed data x, sx2 is variance of x, and n is number of observations.
EXPERIMENTAL SET UP AND WORK PROCEDURE:
Equipment:Wire Cut EDM works on the principle of Electrical Discharge Wire Cutting (EDWC), most commonly known as Wire Cut EDM. It is a spark erosion procedure to produce complex 2-Dimentional and 3-2-Dimentional shapes through electrically conductive work pieces. This machine is used only for manufacture parts which are electrically conductive. Wire Cut EDM differs from conventional EDM is that a thin, 0.05-0.3 mm in diameter wire used for manufacturing of our product.
Figure 1. Schematic Diagram of EzeeCutPlus Wire EDM
Material:
In this investigation, we used work piece material High Chromium High Carbon die steel (HCHC) in this experiments. Which have cold work tool steel with substantial amounts of Chromium and Carbon (HCHC) tool steels offer good dimensional accuracy, wear resistance and machinability.
Design of Experiments
The experimental layout for the machining parameters using the L27 orthogonal array was
table I In the taguchi method, most all of the observed values are calculated based on ‘the higher the better’ and ‘the smaller the better’..Thus in this study, the observed values of MRR, and SR were set to maximum, and minimum respectively.
Table I: Design Scheme of Experiment of Parameters and Level
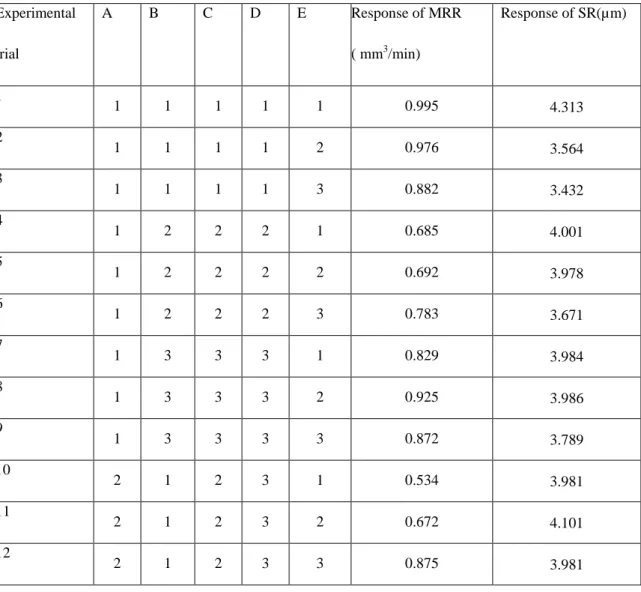
Table II: Observed Values of MRR and SR
Control Parameters
Level
Units Observed Values
1 2 3
Voltage [A]
Discharge current [B] Pulse duration [C] Pulse frequency [D] Wire Tension [E]
120.00 16.00 6.00 60.00 1100.00 140.00 24.00 8.00 70.00 1200.00 160.00 32.00 10.00 80.00 1300.00 Volt Amp µsec KHz gm
1. Material Removal
Rate (mm3/min)
2. Surface Roughness (Ra)
Experimental
trial
A B C D E Response of MRR
( mm3/min)
Response of SR(µm)
1
1 1 1 1 1 0.995 4.313
2
1 1 1 1 2 0.976 3.564
3
1 1 1 1 3 0.882 3.432
4
1 2 2 2 1 0.685 4.001
5
1 2 2 2 2 0.692 3.978
6
1 2 2 2 3 0.783 3.671
7
1 3 3 3 1 0.829 3.984
8
1 3 3 3 2 0.925 3.986
9
1 3 3 3 3 0.872 3.789
10
2 1 2 3 1 0.534 3.981
11
2 1 2 3 2 0.672 4.101
12
TAGUCHI ANAYSIS FOR MRR
Anaysis of MRR using MINITAB softwareTaguchi Analysis: Response of MRR versus A, B, C, D, E
Larger is better
Table III. Response Table for Signal to Noise Ratios for MRR
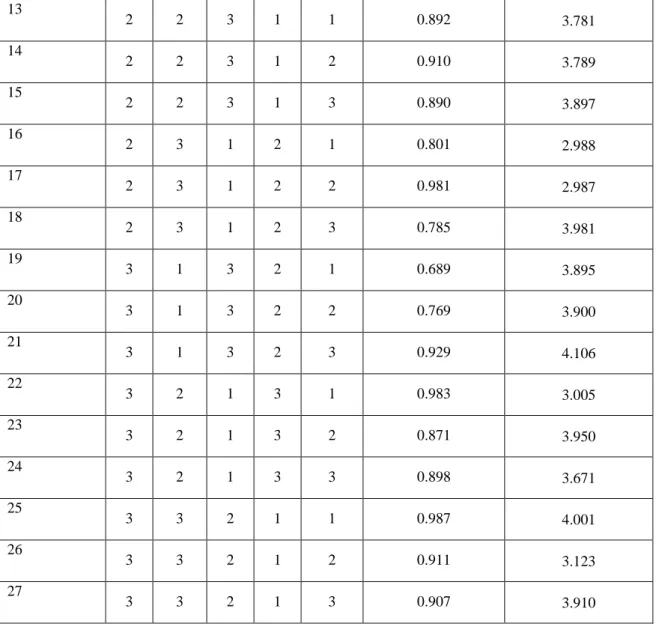
13
2 2 3 1 1 0.892 3.781
14
2 2 3 1 2 0.910 3.789
15
2 2 3 1 3 0.890 3.897
16
2 3 1 2 1 0.801 2.988
17
2 3 1 2 2 0.981 2.987
18
2 3 1 2 3 0.785 3.981
19
3 1 3 2 1 0.689 3.895
20
3 1 3 2 2 0.769 3.900
21
3 1 3 2 3 0.929 4.106
22
3 2 1 3 1 0.983 3.005
23
3 2 1 3 2 0.871 3.950
24
3 2 1 3 3 0.898 3.671
25
3 3 2 1 1 0.987 4.001
26
3 3 2 1 2 0.911 3.123
27
3 3 2 1 3 0.907 3.910
Level A B C D E
1 -1.4944 -1.9515 -0.8694 -0.6600 -1.8696
2 -1.8980 -1.5240 -2.2713 -2.1069 -1.4239
3 -1.1346 -1.0515 -1.3863 -1.7600
-1.2335
Table IV: Response Table for Means for MRR
Level A B C D E
1 0.8488 0.8134 0.9080 0.9278 0.8217
2 0.8156 0.8449 0.7829 0.7904 0.8563
3 0.8827 0.8887 0.8561 0.8288 0.8690
Delta 0.0671 0.0752 0.1251 0.1373 0.0473
Rank 4 3 2 1 5
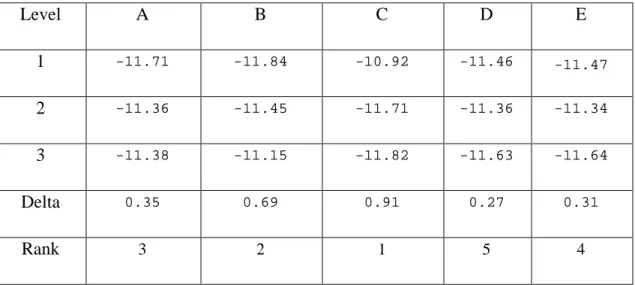
TAGUCHI ANAYSIS FOR SR
Taguchi Analysis: Response of SR versus A, B, C, D, E Smaller is better
Table V. Response Table for Signal to Noise Ratios For SR
Level A B C D E
1 -11.71 -11.84 -10.92 -11.46 -11.47
2 -11.36 -11.45 -11.71 -11.36 -11.34
3 -11.38 -11.15 -11.82 -11.63 -11.64
Delta 0.35 0.69 0.91 0.27 0.31
Rank 3 2 1 5 4
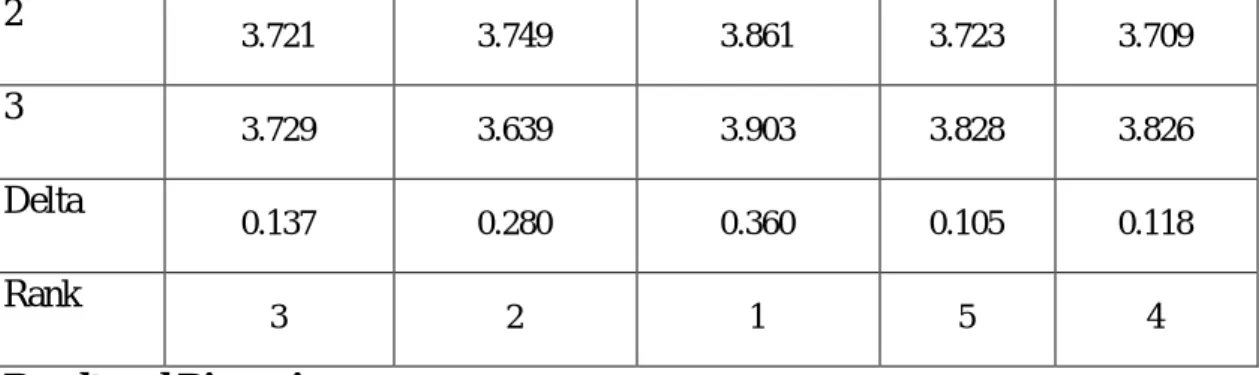
Table VI. Response Table for Means for SR
Level A B C D E
1
3.858 3.919 3.543 3.757 3.772
2
3.721 3.749 3.861 3.723 3.709
3
3.729 3.639 3.903 3.828 3.826
Delta
0.137 0.280 0.360 0.105 0.118
Rank
3 2 1 5 4
Result and Discussion:-
The following discussion focuses on the different of process parameters to the observed values (MRR and SR) based on the Taguchi methodology.
Material Removal Rate (MRR)
Main effects of MRR of each factor for various level conditions are shown in figure2 and 3.
3 2 1 -0.5 -1.0 -1.5 -2.0 -2.5 3 2
1 1 2 3
3 2 1 -0.5 -1.0 -1.5 -2.0 -2.5 3 2 1 A M ea n of S N ra tio s B C D E
Main Effects Plot for SN ratios
Data Means
Signal-to-noise: Larger is better
Fig.2 Main Effects Plot for S/N ratios for MRR
3 2 1 0.92 0.88 0.84 0.80 3 2
1 1 2 3
3 2 1 0.92 0.88 0.84 0.80 3 2 1 A M ea n of M ea ns B C D E
Main Effects Plot for Means
Data Means
With the above graph for S/N ratio for MRR and Mean for MRR we have found the optimal parameter setting A3B3C1D1E3 which is voltage at level 3 (160 Volt), Discharge current at level 3 (32 Amp), Pulse duration at level 1 (6 µsec), pulse frequency at level 1 ( 60 KHz), Wire tension at level 3 (1300 gm).
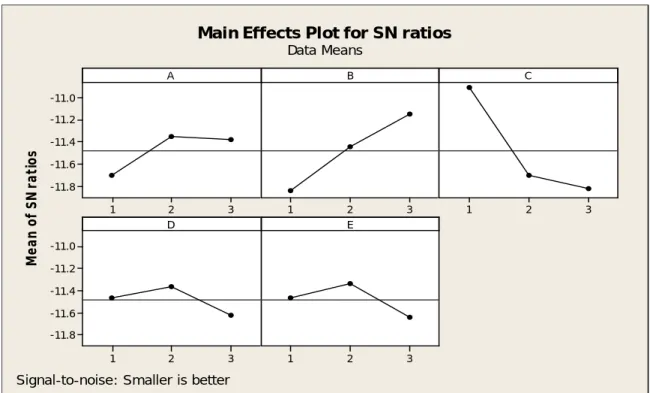
Surface Roughness (SR)
Figure 4 and 5 evaluates the main effects of each factor for various level conditions.
3 2 1 -11.0 -11.2 -11.4 -11.6 -11.8 3 2
1 1 2 3
3 2 1 -11.0 -11.2 -11.4 -11.6 -11.8 3 2 1 A M ea n of S N ra tio s B C D E
Main Effects Plot for SN ratios
Data Means
Signal-to-noise: Smaller is better
Fig . 4 Main Effects Plot for S/N ratios for SR
3 2 1 3.9 3.8 3.7 3.6 3.5 3 2
1 1 2 3
3 2 1 3.9 3.8 3.7 3.6 3.5 3 2 1 A M ea n of M ea ns B C D E
Main Effects Plot for Means
Data Means
With the above graph for S/N ratio for SR and Mean for SR we have found the optimal parameter setting A2B3C1D2E2 which is voltage at level 2 (140 Volt), Discharge current at level 3 (32 Amp), Pulse duration at level 1 (6 µsec), pulse frequency at level 2 ( 70 KHz), Wire tension at level 2 (1200 gm).
CONCLUSION
Based on Taguchi analysis for Material removal rate, pulse frequency is the most significant factor because it is having 1 rank in case of MRR and predicted optimal parameter setting is A3B3C1D1E3. According to predicted optimal setting we have conducted the experiment and MRR found 0.9827 mm3/min. In the case of surface roughness pulse duration is the most significant factor because it is having 1 rank in case of SR and predicted optimal parameter setting are A2B3C1D2E2. According to predicted optimal parameter setting for SR we have found 2.987 µm that shows the successful implementation of Taguchi analysis.
REFERENCES
[1] Y.K. Lok, T.C. Lee, Processing of advanced ceramics using the wire-cut EDM process, J. Mater. Process. Technology. 63 (1–3) (1997) 839–843.
[2] J.T. Huang, Y.S. Liao, W.J. Hsue, Determination of finish-cutting operation number and machining parameters setting in wire electrical discharge machining, J. Mater. Process. Technol. 87 (1999) 69–81.
[3] Y.S. Liao, J.T. Huang, H.C. Su, A study on the machining-parameters optimization of wire electrical discharge machining, J. Mater. Process. Technol. 71 (1997) 487–493.
[4] Ranjit K.Roy, “A Premier On The Taguchi Method” , Van Nostrand Reinhold, New York, 1996.
[5] Ranjit K.Roy, “Design of Experiments Using the Taguchi Approach” , John Wiley & Sons, New York, 2001.
[6] B.H. Yan, C.C. Wang, W. D.Liu and F.Y. Huang, “Machining Characterstics of Al2O3/6061 Al Composit using Rotary EDM with a Dilsklike Electrode” , The International
Journal of Advanced Manufacturing Technology, 16:322-333, 2000.
[7] S.S. Mahapatra, and A. Patnaik,, Optimization of wire electrical discharge machining (WEDM) process parameters using Taguchi method, International Journal of Advanced Manufacturing Technology, 2007. Vol. 34, pp. 911-92.