Hungarian Association of Agricultural Informatics European Federation for Information Technology in Agriculture, Food and the Environment
Journal of Agricultural Informatics. Vol. 7, No. 1
journal.magisz.org
A brief review of the application of machine vision in livestock behaviour
analysis
Matthew Tscharke
1,
Thomas M. Banhazi
1I N F O
Received 16 Mar. 2016 Accepted 18 Apr. 2016 Available on-line 30 Apr. 2016 Responsible Editor: M. Herdon
Keywords: livestock, welfare, animal behaviour, machine vision systems, behaviour-recognition, monitoring systems.
A B S T R A C T
It is desirable to increase the frequency between livestock welfare assessments to enhance problem identification and consumer confidence in livestock welfare management. However, animal welfare is difficult to monitor in practice, due to the inefficiencies involved in manually documenting and determining, animal behaviour, social interaction and health condition of large numbers of animals. Furthermore, the effectiveness of a welfare assessment relies on the intuition of the observer which may vary considerably between assessors. Hence, this review investigates the application of machine vision systems to recognise and monitor the behaviour of animals in a quantitative manner. Behaviour-recognition concepts, techniques, and current behaviour monitoring systems are reviewed. Findings indicate that further research is required to develop systems that can monitor the behaviour and welfare of animals’ more efficiently and effectively in commercially realistic environments.
1
Introduction: Livestock Behaviour and Vision Systems
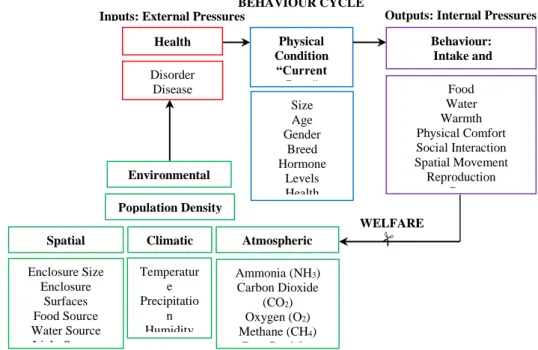
Measuring and assessing the behaviour of livestock is important as it can be used to indicate their welfare status (Dutta et al., 2015; Porto et al., 2014). Behaviour is formed from an animal’s continuous interaction with its environment (Figure 1). Animal behaviour is a response to an internal stimuli (physiological) such as hunger or an external stimuli such as climate. If the goal of the behaviour is not, or cannot, be achieved the animal may change its behaviour or physiological response (Busse et al., 2015).
Figure 1. Behaviour cycle
1 National Centre for Engineering in Agriculture (NCEA), University of Southern Queensland (USQ), Toowoomba Queensland. Contact: [email protected]
BEHAVIOUR CYCLE
Inputs: External Pressures Outputs: Internal Pressures
Behaviour: Intake and Expenditure Food Water Warmth Physical Comfort Social Interaction Spatial Movement Reproduction Rest Size Age Gender Breed Hormone Levels Health Physical Condition “Current State” Health Disorder Disease WELFARE Environmental Stimuli
Spatial Climatic Atmospheric
Temperatur e Precipitatio
n Humidity
Ammonia (NH3)
Carbon Dioxide (CO2)
Oxygen (O2)
Methane (CH4)
There is potential for welfare problems to arise when there are inadequate environmental enrichments to support the behavioural needs of livestock.
It has been argued that the husbandry methods used in intensive livestock production have resulted in the deprivation of some naturally occurring behaviours (Fraser, 1983). Producers have a strong interest in maintaining the welfare of their livestock from both economic and ethical perspectives. As often proactive welfare management has a positive effect on a farm’s production efficiency and the quality and marketability of the end product (Kashiha et al., 2013).
The observation processes currently used to measure livestock behaviour are subjective, as farm workers perform the welfare assessment. The worker’s involvement in these tasks are necessary and therefore increase the demand on the labour and costs associated with monitoring animal behaviour. These factors have potential to influence the level of attention each animal receives (Oczak et al., 2013; Pereira et al., 2013). Thus, behavioural measurements are open for interpretation and have potential to be overlooked.
Given the problems mentioned above, this review investigates the application of machine vision systems to recognise and monitor the behaviour of animals in a quantitative manner. Specifically in this article, behaviour-recognition concepts, techniques, and current behaviour monitoring systems are reviewed.
1.1
Applying machine vision systems to the behaviour recognition task
To overcome these issues, tools that can objectively assess the behaviour and welfare status of livestock species accurately, repeatedly and continuously are required. Ideally an autonomous system is required that:
(i)
Can recognise the onset of welfare related problems (mimics the intelligence of a
trained welfare inspector) and
(ii)
Has the ability to monitor and recognise these behaviours continuously
A machine vision system is a suitable device for undertaking this task as it can continuously operate without operator involvement and has the potential to quantitatively assess animal behaviour under a predetermined process that will not change greatly (Noldus et al., 2001). For these reasons, vision systems have replaced human inspectors in many inspection-tasks in food-related industries (Brosnan and Sun, 2004). In recent times, research surrounding developing tools for the automatic identification of animal behaviour has gained interest.
As the above example demonstrates, behaviour recognition systems are required to automatically collect and recognise behaviour-related features which describe the target-object(s) at each time step. These features need to be modelled in sequence and within the constraints that characterise the behaviour.
The purpose of this review is to demonstrate if and how machine vision systems may be used to:
(i) Objectively and automatically determine animal behaviour in commercial environments (especially those surrounding the pose of the animal) and to
(ii)
Identify any undesirable behaviourA vision system is made up of hardware (camera, computer) and software components (intelligence). These components are programmed to communicate with one-another similar to that of the communication between the eyes and brain. In a recognition process, the eyes provide information to the brain which then interprets the information to provide the basis for, or to contribute to a decision.
2
Technical aspects: The Recognition Process
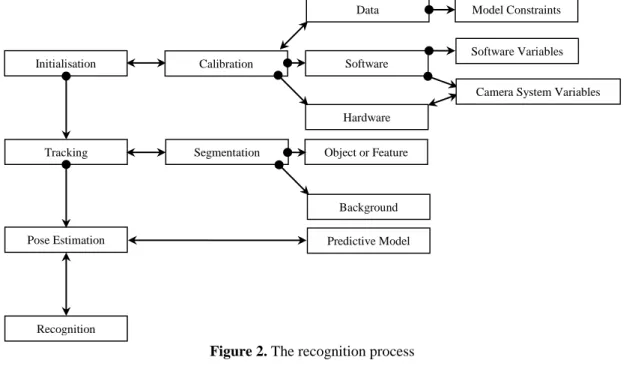
A vision system’s behaviour recognition procedure can be broken into four main stages: (i) initialisation, (ii) tracking, (iii) pose estimation and (iv) recognition (Moeslund and Granum, 2001) (see Figure 2).
Initialisation is a configuration-stage where the foundation for further processing is achieved. Reference to the information gained in the initialisation stage makes it easier for the system to interpret the scene in subsequent processes. This stage can be broken up into software, hardware and data calibration components, all of which assist in obtaining an appropriate representation of the information within the image scene. The Tracking stage involves segmentation, where features of objects within the image are identified and separated from the remainder of the image for further analysis. Tracking techniques create associations between successive image frames using these object features. Pose Estimation is a stage that aims to identify the state of the target-object within an image scene. The pose of a target-object can be identified from its features. Recognition is the correct labelling and identification of a pose or a sequence of poses as a given action or gesture.
Figure 2. The recognition process
Hardware Software
Model Constraints
Calibration
Segmentation Object or Feature
Background Initialisation
Tracking
Pose Estimation
Recognition
Predictive Model Data
2.1
Initialisation
Initialisation can involve tasks carried out before (offline), or after (online) the vision system is commissioned. In essence, each task of the initialisation stage will involve some form of calibration. Hardware, such as the room lighting and camera settings (exposure, focus and contrast) may need to be calibrated to optimise the integrity of the image for further processing. These calibration tasks are usually carried-out offline however, some instruments enable online adjustment of these features. For example, cameras with built-in automatic focus can automatically adjust the focal length between the lens and the imaging sensor to obtain a clear image, and cameras with built-in automatic exposure can control the level of light incident onto the imaging sensor to maintain a suitable dynamic range of light intensity within the resultant image. Like hardware, software must also be initialised. Software initialisation requires the calibration and optimisation of variables within the software to enable the tracking and recognition processes to function correctly.
Data describing the target-object also needs to be collected and calibrated. This can be performed either offline where a detailed model of the target-object is pre-defined. Known as a model based on a priori knowledge. Or alternatively online where there is no a priori information available (model-free) and the model for the target-object is learnt and built over time from tracking, clustering and classifying the object features in successive images. These models are either continuously referred to in a matching process by the software component (direct model), or are used to identify a pose for adaptive learning (indirect model). Data such as image distortion coefficients and other model-related referencing variables may also be included in the offline data (Lind et al., 2005).
As the initialisation stage encompasses the main structure of the system, the way in which these components are configured and interfaced with one another has a large influence in the overall performance of the system. In addition, the selection of the descriptive features associated with the object also plays a vital role.
2.2
Features and cues selection
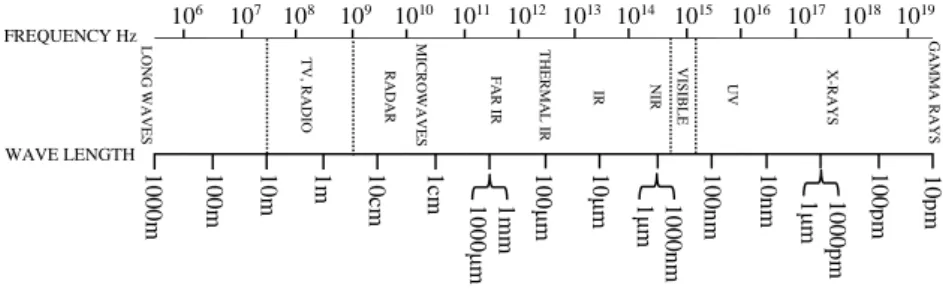
Features are classes’ of information that can be extracted from images which have special meaning. Features associated with images acquired in the visible spectrum are considered here, however other features, such as temperature, can be identified from image sensors sensitive to other bands in the electromagnetic spectrum (see Figure 3).
Figure 3. Electro-Magnetic Spectrum
Features can be classed into temporal, spatial, valued, or textural types. Velocity and acceleration are examples of temporal features which can be found between images when motion occurs. Spatial features are point(s), edge(s) or shapes of various size and dimensions associated with a target-objects shape-appearance. Value features are image-specific values such as colour information acquired from an image colour space which may represent the scene or the target-objects visual appearance. Textural features are a group or range of features such as colours, intensities, edges, points and shapes which can be combined into a textural feature or template. A feature can also derive its own distribution over time. The feature extraction processes need to be practical in respect to the application’s demand on computational cost and efficiency. These processes must also describe the target-object such that
106 107 108 109 1010 1011 1012 1013 1014 1015 1016 1017 1018 1019
1 0 0 0 m 1 0 0 m 1
0m 1m 10
cm 1 cm 1 mm 10 00 μm 10
0μm 10μm 100n
m 1 0 n m 1 0 p m 1 0 0 0 n m
1μm 10
0
0
p
m
1μm 100p
validation and re-location can occur reliably and errors are prevented in subsequent estimation and recognition stages.
The concept of features should also include external factors, as an animal’s behaviour is likely to be the result of an environmental stimulus or goal-driven need. For example, a nocturnal animal will exhibit different behaviour depending on whether its environment is ‘light’ or ‘dark’. Thus, illumination may be an important external-variable required to define an observed behaviour in this example. Other external variables, such as temperature, air quality, and the location of feed and drinking stations may also be considered features which explain the current conditions that may influence certain behaviours. After the feature-set is selected, certain techniques must be applied to identify, segment and track features effectively in and across each image frame.
2.3
Tracking
The tracking process involves the combination of two main processes, (i) segmentation and (ii) temporal correspondence.
Segmentation involves the process of extracting target feature(s) from images. Thus after segmentation, a feature-set describing the object and any other conditions will be obtained from the image. Often, an additional enhancement process is also implemented before segmentation to modify the image’s pixels to support the feature extraction processes. Temporal correspondence refers to the process of associating (linking) one or more features in an image-frame to adjacent frames by continuously collecting and comparing against previously collected feature information. The correspondence can also be described as spatial-temporal indicating that there are space and time dimensions factored into the tracking process. This process can dramatically improve the chance and speed in relocating any features of interest in subsequent frames, and therefore can increase the overall efficiency of the segmentation process. Tracking processes are favourable in animal studies as the animal needs to be continuously tracked to understand its behaviour. Hence, the tracking function would be an important component of a system designed to detect animal welfare status on-farm.
In the segmentation and temporal correspondence processes, four classes of techniques are used to recover a set of features from an image. In general, these are (i) scene-based, (ii) motion-based, (iii) shape-based and (iv) appearance-based techniques.
Scene-based techniques aim to describe the background scene such that any object entering it can be easily segmented when the background scene is removed. Scene based techniques include subtraction methods and Mixtures of Gaussians (MoG). Motion-based techniques use temporal correspondence between frames to determine the movements of objects within scenes. The velocity and acceleration (optical flow) of the pixels representing the movement target-object between images can be found. This movement can be characteristic of some form of behaviour. For example, two people boxing will exhibit fast movements when attacking and slow movements during defensive moves or when planning attack. Such fighting motions have been studied in rodents through manual observation (Pellis and Pellis, 1987). Shape-based techniques strive to recover unique dimensional attributes of the target-object from edges and points located within the image. Appearance-based techniques utilise the intensity properties of the image such as, colour, saturation or hue to form a basis to segment objects from the image (Moeslund et al. (2006).
These four classes of techniques can be used in any sequence. For example, a scene based technique may be used to segment an object, then a shape and appearance based technique can be used to describe it. Alternatively, an appearance based technique could be used to find certain colours in an image, followed by a shape based technique to describe the boundaries of the colour region(s). These four classes can also be used in combination to form textures. For example, ‘blob analysis’ is an appearance-shape texture method, as a combination of image values and their co-ordinates are used to provide grounds for segmentation (Wren et al., 1997b).
2.4
Pose estimation and behaviour recognition
After feature-set is extracted, the intelligence of the system needs to be configured so that pose and behaviour can be recognised. The pose estimation stage determines the correspondence between a pose and feature information such as its orientation, position, appearance and current movement. The word pose should not be associated with only shape and size. For example, a bird may have unique colouring on the underside of its wing that is hidden when it is stationary, hence colour may be used as a cue indicate its posture. The recognition phase is the correct identification and labelling of a sequential combination of poses using a cross-reference to previously obtained data. Similar processes can be used when recognising behaviour from a sequence of poses and when estimating a pose from a given feature-set.
2.4.1
Recording biomechanical data
In most cases, biomechanical information surrounding the target-object needs to be collected to model its relevant features. This a priori data can be collected in one of the three following ways: (i) actively by attaching sensors to the subject, (ii) passively by observing the subject using a sensor device such as a video camera, or (iii) using markers, which involves a combination of active and passive techniques. Active techniques are techniques that attach sensors physically to the subject’s body, such as accelerometers which could be used to determine the kinematics of the subject’s model. Alternatively, a marker can be placed on the subject and a vision system can be used to track and record the motion and position of the motion of the markers relative to the motion of the subject’s body. However, having to place a marker or sensor on the subject is not always practical, so passive systems may be considered. Passive techniques build their own feature references, such as body motion constraints and dimensions, using a vision system without physically interfering with the subject (a look and learn approach) (Kakadiaris and Metaxas, 1998; Kakadiaris and Metaxas, 1996). A list of motion capture providers can be found in Alberto (2011).
2.4.2
Methods for handing model-data
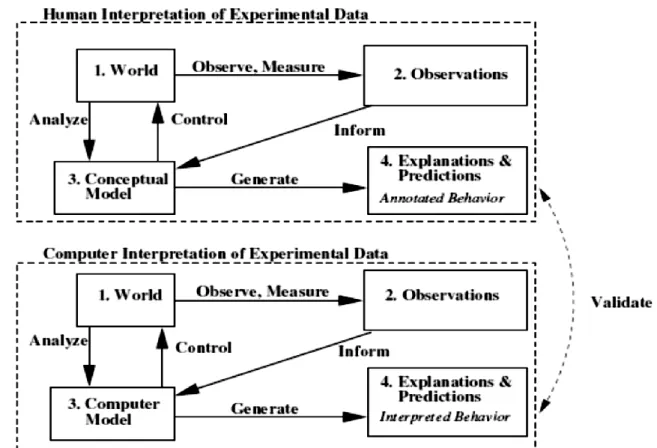
One of three different data storage and retrieval methods can be programmed to derive a feature-set of a target-object, or to access a previously stored feature-set for validation purposes. These three methods which structure the data-flow are model-free, direct and indirect methods. Here the word model refers to the distributions (clusters or groups) that represent dissimilar feature-sets. Systems that do not use prior knowledge are model-free at initialisation, and build their recognition database (groupings or clusters of feature information) online while the system is running. The application of such systems in artificial surveillance is promising as systems that operate model-free can effectively learn and categorise object-behaviour systematically. Hence, they are commonly called machine-learning systems. However, the limitation for a model-free system is that it lacks intuition, and for a particular pose or behaviour external intelligence is required to correctly label or interpret the discovered data clusters (see Figure 4).
Figure 4. The validation process: comparing a computer and a human’s interpretation of behaviour from Xue
and Henderson (2006)
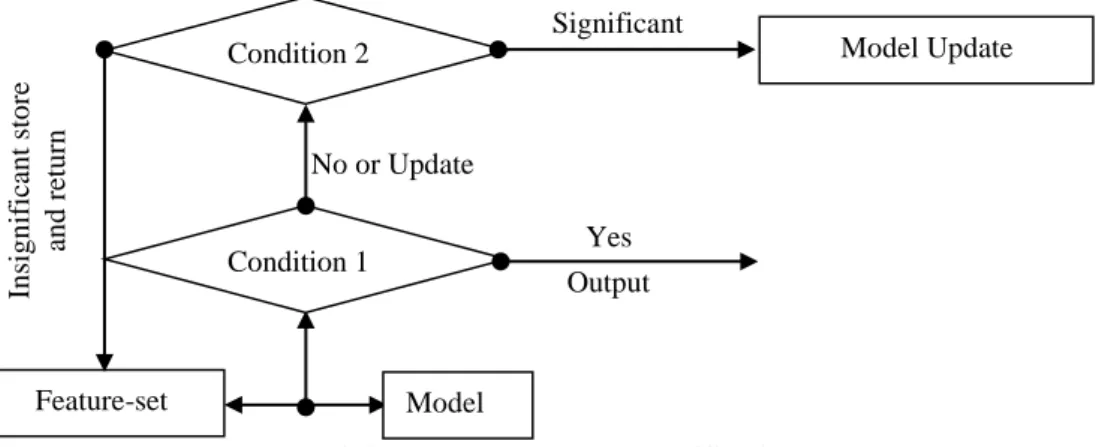
An indirect method self-learns in a similar manner to the model-free method only with constraints which restrict the level of adaptation of the model. The updates to the model only occur when the observed feature is highly correlated to a cluster representing a built-in feature. New clusters can form when there is significant evidence to support the proposal that a new cluster exists. Therefore, this method can be used to help confirm the integrity of the initial a priori model distribution(s) and labelling over time. However, if not done correctly the indirect model can update and compound the reference data (and thus models) with errors if false positives are frequently introduced into the clusters that define the model. The balance between whether the system updates its model (or not) is known as the plasticity of the system. This balance is based on how well the observed feature-set relates to the existing model. The control and flexibility in the indirect data storage and retrieval method make it well suited for recognition type vision systems that observe deformable bodies which vary considerably.
Once sufficient information of the target-object has been acquired, the underlying definition of the recorded behaviour or poses must be translated into a computer readable model. This model is categorised using three techniques known as (i) clustering, (ii) classification and (iii) training.
recursive process of categorising information is called as training. Support vector machines (SVM) are regarded as good classifiers that are able to discriminate effectively between clusters of information (Burges, 1998).
Figure 5. Training: a clustering and classification process
The aim of the clustering and classification stage is to provide an information-structure which the computer can then associate incident features with and determine their validity. So the comparison can be made effectively and efficiently the feature-set may also be scaled or compressed.
The two types of scale relevant to identifying behaviour are spatial and temporal scale. Objects can vary in size and shape (spatial) and the size and shape of objects can vary over a random period of time (temporal). For example, it may take a child less than a second to sit down but it may take and elderly person half a minute. How can a system intuitively interpret this as the same action? In a spatial example, a person walking away from a camera will continuously have a decreasing amount of pixels associated to his or her body. How can a system interpret this as the same object across all frames?
In both cases a method is required to facilitate these changes of scale across image sequences. A system in its most basic form which neglects temporal scale can be considered static, as correlations between new observations and prior data references are only made within the scene at the current time step. In this case matching tasks can only identify the final pose, like an observation in a photograph. This process is often called template matching, where segmentation, pose estimation and behaviour recognition are performed almost simultaneously. However, using such a system limits the ability to forecast behaviour, as the prior sequence of actions leading up to the final interpretation and physiological reasoning behind the behaviour is not known. Several methods are used overcome the problems associated with temporal scale across images. In general, these methods are based on or similar to Dynamic Bayesian networks (DBN). A DBN is a data structure that supports different states. The states within the DBN are defined by training a collection of feature-sets corresponding to a sequence of behaviour. Thus, an incident feature-set which describes a part of a behaviour will have a strong association to a state stored within in the DBN, if the behaviour’s states have been predefined before initialisation, or during adaptation. During recognition, a feature-set does not have to be an exact match to a state, but just the closest match, based on conditional probability, above a specified threshold. A DBN can be thought of conceptually as a path which defines the behaviour. The feature-set is used to determine the location (the state) of the subject on the behaviour path. Once the position on the path is found, the system can transition between adjacent states based on the fit between the feature-set and the DBN. Monitoring the timing and frequency of transition patterns between states can be used to track, recognise and forecast a given behaviour. Spatial scale can be handled using rotation and scale invariant techniques such as ‘Scale Invariant Feature Transform’ (SIFT) and ‘Speed-up Robust Features’ (SURF) (Lowe, 2004; Lowe, 1999; Bay et al., 2006).
Condition 2
Feature-set
Model Update
Condition 1
Model
Significant
No or Update
In
sig
n
if
ican
t sto
re
an
d
r
etu
rn
3
COMMERCIALLY AVAILABLE VISION SYSTEMS THAT
DETERMINE BEHAVIOUR
Vision systems have been developed and are commercially available for recording and monitoring the behaviour of both humans and animals. These systems can be classified into two types based on their ability to, (i) record biomechanical information for modelling behaviour (such as a motion capture system) and to (ii) recognise and quantify behaviours automatically from video (behaviour recognition systems).
3.1
Biomechanical recording systems
Several companies provide vision-based motion-capture services to record and reconstruct the geometry and motion of bodies, virtually. Such systems do not recognise or identify behaviour, but can be used to record the constraints and features for a given sequence of animal movement (body measurements, angles, motion timing) to define its model.
Vicon Systems has a range of systems for life sciences animation and engineering that have the ability to record and reconstruct models of human and animal movement (Vicon, 2010). Their systems can record behaviours in 2D, and in 3D both actively using markers and passively without. The passive system enables the user to define landmarks on the surface of the subjects body to target specific body movements. Tolerances of 0.01 mm can be achieved for the reconstructed body surface mesh. A model can be captured in 3D using a system composed of up to 10 cameras. The system is capable of presenting real-time 3D information such as joint angles. The company also provides systems designed for the capture of animals biometric information (Vicon, 2010). All kinematic data is transferable to third party software packages such as Matlab (The MathWorks Inc., Natick MA, USA) and LabVIEW (National Instruments Corporation, Austin TX, USA) for further analysis in the form of a C3D file. Vicon systems have been used in numerous research projects on animals to record parts of their biomechanical function (Liu et al., 2007; Herring et al., 1993).
3.2
Behaviour recognition systems
Behaviour recognition systems can be classified into either laboratory or field-type implementations. Laboratory type implementations allow for the additional expenditure on control (building, enclosure or environmental alterations) that may not be feasible to operate in commercially realistic environments. Field-type implementations are flexible and can be integrated into existing commercial environments (which are variable) with little or no control required. Furthermore, the type of behaviour assessed by the system can be categorised into either tracking or pose related behaviour, where tracking relates to the co-ordinate position of the animal relative to its surroundings and pose relates to is actual physical actions.
In general, the commercially available systems found during the review had the objective to record the spatial movement of a laboratory animal performing a set task. Observational tests carried out using vision systems included tracking the rodent through various maze types to analyse the animal’s behaviour when subject to certain environmental conditions. Other vision systems recorded fear conditioning experiments, light-dark-testing, tail suspensions, swim tests and novel object recognition. Recorded variables included, time resting, time moving, entry to a zone, time in a zone, locomotive speed, distance travelled, contact between different coloured animals and condition-place-preference. The systems generally export data output into Microsoft Office Excel (Microsoft Corporation, Redmond, WA, United States) and facilitate a visual output of the tracking plot. In most tracking systems presented here, the animals were identified and tracked by their geometric centre after segmentation. A description of the main features of some commercially available systems follows.
collection of data based on predefined positions or zones within the image arena defined by the user. For example, the animals can start or pause the experiment by moving between different locations inside the image (TSE-Systems, 2010).
Actimetrics (2010) has four vision systems Freeze Frame, Water Maze, Limelight and Big Brother (ActiMetrics, Wilmette IL, USA) which are all marketed at different testing environments. Freeze Frame is a fear conditioning software which is used to determine the animal’s motion when it is subject to a fear provoking stimulant such as loud noise or uncomfortable environment. This motion recognition system can detect the movement of limbs (grooming, sniffing turning and rearing) when an animal (mouse or rat) is stationary, however, it has no ability to recognise, label or record these movements. Water Maze has a project planning component where the user can enter an experimental design before running an experiment. The system then notifies the user which animals should be introduced into to the experiment, and the timing of their introduction. The animal’s movement can be used to trigger different recording properties of the experiment in a similar way to the TSE system mentioned above. An algorithm compensates for lighting changes and shadows within the image. The Limelight system can track up to four arenas at once using one camera. Complex behaviours are manually labelled or scored (offline or online) by an operator. A novel feature of the Limelight system is the ability to monitor body length which indicates different stretch-attend behaviours caused by changes in the body length of the test animal. For example from the camera’s top view, the body length will be shorter when the animal is in a rearing position (sitting). Over the course of the experiment, the body lengths are divided into short, medium or long body lengths manually. These three data clusters are then used to cross examine the spatial locations in which the animals are situated at the time the change in body length occurs, and to identify any relevant patterns. The Big Brother system is a system which is capable of tracking a large number of laboratory animals from above in open field type tests (in the laboratory). Each camera’s image can be divided into 50 sections to define the boundaries of 50 arenas containing a rodent to be tracked. Thus, four cameras can be used to track the movement of up to 200 animals (Actimetrics, 2010).
Med Associates Inc (2010) also has a range of systems for monitoring lab animals. A fear conditioning and tracking system which utilises video recorded of the near infrared spectrum, an open field video tracking system with test enclosure, and a water maze and video tracking software designed to determine the path co-ordinates undertaken by the animal and other motion variables that occur during a Water Maze test.
Qubit Systems Inc (2010) has two video systems. The QUATTRO (Qubit Systems Inc., Kingston ON, Canada) system can track animals in three dimensions using two cameras (top and side view). The system determines and tracks the animal’s geometric centre. A mask (image-based filter) is applied to remove false positives improving identification. Another one of Qubit’s products called Video Tracking Software, can track an animal in a range of the different observation type tests previously listed. Qubit Systems, Inc also offers a system called DanioTrack, which can determine the tracking information of multiple danio (zebra fish) in one arena from pre-recorded video (Qubit Systems Inc, 2010).
Biobserve (2010) has four vision systems. The Trackit2D (BIOBSERVE GmbH, Augustin, Germany) system uses a pan-tilt-zoom (PTZ) camera to automatically follow the object and keep it within the boundaries of the image. Trackit 3D uses the top and side view of the animal’s arena to obtain the x, y and z co-ordinates of the test subject. The system can be used to track fish species in a tank. The Viewer system tracks the centroid, nose and the tail of mice and rats. Additional movement can be identified using these three points such as the animal moving its head from side to side (head wagging), stretching and freezing (when the animal stops abruptly). The Forced Swim Test or FST system is designed to observe the reaction of an animal from the side view when it is placed in water. The system automatically determines whether the animal is struggling, swimming or floating by measuring its position between predefined zones on the surface of the water (Biobserve, 2010).
Noldus (2010) has a wide range of products targeting animal and human behaviour. The
Observer XT
(Noldus Information Technology BV, Wageningen, Netherlands) software can be
experiment. The user then manually documents the behaviour as it takes place from either
streaming video or pre-recorded video files. The software organises the data so that results of
certain behaviours can be easily accessed by querying the acquired data.
EthoVision® XT is a
vision system which can track the nose point, centroid and tail base of a laboratory animal.
From these three points the body elongation can also be found.
Catwalk XT
is a novel system
to analyse the gait of mice (Deumens
et al.
, 2007). The mice walk over a LED illuminated glass
plate which reflects the light of all points within the glass plate except for where the animal is
in direct contact. The feet of the animal can be observed and are automatically classified by the
system. The tail or other parts of the animal’s body which are not required in the analysis can
to be removed manually by the operator (Noldus, 2010).
IBM’s smart surveillance solution (S3) is a commercially available surveillance software package for tracking humans. The system simultaneously monitors different levels of surveillance. For example, the system can be used to track a car, its number plate, and its occupants in the parking space surrounding a building. Lower level cameras monitor the entry and exit points of the building and provide a means of facial and appearance recognition. Using this surveillance framework the movements of the car’s occupants can be tracked in a time line from when their vehicle arrives to when it leaves. The system is structured to be able to accept queries to classify events. For example, someone or a vehicle remaining in the camera view for an extended period of time could be considered loitering or abandoned so a query can be set to sift through all events bounded by this criterion. Other search criteria consider the target-object type, size, image-region, and appearance (Chiao-Fe et al., 2005).
4
RESEARCH BASED VISION SYSTEMS THAT DETERMINE
BEHAVIOUR
There are many applications of vision systems in agriculture and other industries which essentially fit within three broad research categories of surveillance applications, control applications and analysis applications (Moeslund et al., 2006). The following section presents various research projects that adopt machine vision systems to determine animal behaviour.
A number of vision systems that target animal production have been developed in research organisations. In most applications, the aim is to reduce the level of animal handling and improve efficiency, safety and welfare compared to traditional methods. Some examples are systems which survey the linear or angular dimensions of livestock such as cattle and pigs for sorting or weight estimation (Banhazi et al., 2009b; Brandl and Jorgensen, 1996; Schofield et al., 1999; Schofield et al., 2002). A vision-based control application was demonstrated by Wouters et al. (1990) who applied imaging techniques to housed piglets. The application determined the thermal comfort-levels of the piglets from characteristics of their spatial behaviour (as observed in images) to determine appropriate parameters to regulate the thermal conditions within their enclosure. More recently a similar control system was created based on the resting behaviour of the pigs as determined by a vision system (Xin, 1999; Shao and Xin, 2008; Xin and Shao, 2002). Other researchers have created and simulated models of pigs’ behaviour based on the spatio-temporal data obtained from live pigs in an effort to determine the behaviour of pigs in relation to their housing requirements (Stricklin et al., 1998; Gonyou et al., 1997).
A study conducted by Sumpter et al. (1997) aimed to herd a group of ducks using a ‘robotic sheep dog’. A vision system was required to determine the coordinate location of the robot and the ducks to control the path of the robot. A behavioural simulation model was built based on parameters acquired from observing the behaviour of the ducks. Vaughan et al. (2000, p117) later reports the success of the ‘robotic sheep dog’ project in both the simulation and real-world applications, concluding that their “methodology is appropriate for future animal-interactive robotics experiments” and that uncomplicated mathematical models could be used to model basic flock behaviour.
1997; Little and Boyd, 1998; Aydin et al., 2010; Favreau et al., 2006). Gait analysis has been used in the development of sports simulation models to improve the athletic performance of both humans and animals. The locomotor activity of the animal has also been determined though the observation of body parts other than directly from the animals legs. Burghardt and Calic (2006) devised an image processing technique to determine in the loco-motor behaviour of wild lions based on head posture and facial recognition.
A large number of analysis methods also focus on animal tracking. In the poultry industry, a vision system was used to detect and track broiler chickens and identify the birds interacting with the drinker and feeder (Sergeant et al., 1998). Kato et al. (1996) used a vision system in an aquatic environment to track and record the position and velocity of fish in a tank and successfully identified the left and right turning behaviour of the fish. In a similar manner, Cangar et al. (2008) determined the spatial movement of a cow in a barn using a vision system. Measures of walking trajectory, distance walked, orientation of the main axis, body width/length ratio, hip length and back area were recorded.Eating, drinking, standing and lying behaviours were derived from the continuous monitoring of these variables in relation to its enclosure.
EthoVision, a generic behavioural assessment software, has been described in the literature (Noldus et al., 2002). The software has been used to study insects in various applications such as the time taken for cockroaches to reach the odour bait and the behavioural interaction between other insects including wasps, aphids, ticks, beetles, flies, and spiders (Noldus et al., 2001). Šustr et al. (2001) used the EthoVision system and their own software to create a hybrid system to enable them to study the interactions of pigs during pre and post weaning. The study focused on behaviours related to contact such as fighting. Markings were made on the pigs and identified by the system to track the pig’s movements. Like Šustr, Lind et al. (2005) developed a basic vision system to overcome some of the limitations of the EthoVision software in tracking the movements of pigs. Their study involved the administration of apomorphine to minipigs to observe and record the locomotor behaviour of the subject. Perner (2001) used a side viewing angle to successfully track the movement of pigs based on motion parameters and time.
Vision systems have also been developed to determine when an animal’s welfare is compromised based on certain behavioural characteristics. Duarte et al. (2009) identified the activity of flat fish ‘taking off’ and ‘surface swimming’ as a preliminary measure of their welfare. Branson and Belongie (2005) also developed a vision system to give an indication of the animal welfare by monitoring the behaviours of multiple mice from a side view. Complex behaviours such as grooming frequency and basic postures such as stretch, sit and walk were identified. Systems have also been designed to monitor herds to detect their behaviour during milking (Kaihilahti et al., 2007).
Identification of multiple animals within the field of view presents additional challenges as multiple regions within the image containing individual animals need to be identified and analysed. Tweed and Calway (2002) demonstrated the ability to identify and track multiple birds during flight using image processing techniques. Kalafatic et al. (2001) tracked multiple mice in a laboratory using a contour tracking technique that was based on the animals’ movements.
A large number of vision systems are targeted at specific human-behaviour applications. One such example is given by How-Lung et al. (2006) who developed a system which can monitor people in an aquatic environment. The application acts as a virtual life guard for a swimming pool. As their system was aimed at preventing drowning, they monitored the surface of the pool for people acting in distress.
Wren et al. (1997a) created a system called ‘Pfinder’ (People finder) an improved version of the ALIVE system (Maes et al., 1997) which can identify the head, hands and body of a person in real time using a camera with a fixed view. It is suggested that the system could potentially be used to track vehicles and animals.
people using pan-tilt-zoom (PTZ) cameras. The system has three levels of recognition. Level one identifies the agent which can be done from a long distance. The system then automatically instructs the camera to zoom in on the agent to perform another level of analysis. At the next stage the agent is classified based on its posture or movement. For example, the system determines whether agent is a car, human, cat or dog. If more detailed information can be acquired from the agent such as a human face, a third level is used to identify the face and/or facial expression if need be. The system is structured to learn and has the ability to recognise the movement patterns and shape for certain silhouette postures (HERMES, 2009). The W4 system has similar objectives to the HERMES project (Haritaoglu et al., 2000).
5
FUTURE RESEARCH POSSIBILITIES
A system which can identify complex behaviours in and between animals, such as fighting, is not currently commercially-available. Given the techniques used, the performance of the commercial systems reviewed would be questionable if applied outside the laboratory environment. Therefore, a vision system would need to be designed to monitor both simple tracking and complex behaviours in a commercial farm environment. For example, a significant amount of information can be gained by simply determining the pose of an animal. For instance, if a sow can be automatically and reliably identified in a standing posture the result can lead into two useful surveillance applications. When the sow is not standing it must be lying down or sitting, therefore by detecting when the sow is not standing one can assume that is beginning to lie down. This transition can be used to activate a control system to prevent her crushing her piglets (Weary et al., 1996). Using the same identification scheme, one can log the time taken in a standing pose in addition to the general activity of the sow or gilt which can be used for oestrus detection during their interaction with boars (Cornou, 2006; Ostersen et al., 2010). It may also be possible to detect when a sow is on heat from the distinct lack of motion (freezing), pricking of its ears and the arching of its back, which shortens the perceived length of the animal. This form of automated oestrus-detection system could result in up to 30% labour-cost savings by both minimising the manual labour required to facilitate the interaction between the sow and boar(s) and the non-productive days (Freson et al., 1998).
The potential to identify welfare-compromised animals through other motion characteristics or spatial characteristics can also be explored. Systems that identify dead animals or animals with poor mobility can be developed by tracking the movement of the animals around the pen (Tillett et al., 1997). Animals with poor mobility or dead animals can also be found by averaging the image over time and observing the animals which have greatest presence in the background image. The mobility or condition of the animal may be achieved by a gait analysis as performed by a vision system (von Wachenfelt et al., 2010; Favreau et al., 2006; Aydin et al., 2010).
Tracking the animal around its enclosure can also lead to the discovery of other important behaviours such as the time taken at the feeder or drinker and help to optimise the animal’s requirements, such as the number of feed stations or space requirements. The behavioural activity around certain parts of the enclosure has the potential to assist with disease prevention. For example, an outbreak of diarrhoea can be traced back to excessive water consumption of individual animals (Pedersen and Madsen, 2001). A system that identifies sufficient space requirements based on the posture or activity of the animals is also a possible application area (Ekkel et al., 2003).
Stressors or threats can be recognised from animals’ freezing and abrupt lack of motion in the image. Tail biting in groups of pigs or wounds from animals fighting can be identified in images based on blood colour information. Single tail biting events are suggested to be strong indicators of a larger outbreak approaching and therefore, if identified early enough may provide sufficient information to implement management strategies to control the problem (Statham et al., 2009). Fighting behaviour may also be detected from various motion characteristics (Pellis, 1988).
be used to determine the required thermal level for input into the environmental control system in a similar manner to what was demonstrated previously by Shao and Xin (2008) and Wouters et al. (1990). The difference would be that the control would be based using the actual temperatures of the individual animals not on their spatial characteristics.
Potentially, the same system could also be used to monitor the animal’s health (through variations in temperature) and its relationship to its behaviour, as IR imaging has been used for the detection of disease and flu symptoms (Gariepy et al., 1989; Rainwater-Lovett et al., 2009; Schaefer et al., 2007; Stewart et al., 2007; Banhazi et al., 2009a). This would also immensely improve traceability. Ng and Acharya (2009) give an account of how IR was used during the 2003 SARS out break to identify people who might have been carrying the H5N1 virus. The same concept can potentially be undertaken at piggeries to identify an outbreak or localise animals or groups of animals with flu or disease like symptoms based on their temperature profile.
Temperature may also be related to types of behaviour. For example, fighting animals may have increased temperatures. Monitoring temperature could help with the identification of fighting behaviour (Pedersen et al., 1998).
Temperature has also shown a correlation to the level of pen fouling as pigs may choose to lay on surfaces that are zoned for excreting to satisfy their thermal comfort (Aarnink et al., 2006). In addition, inflammation around wounds may also be able to be identified from heat characteristics giving some indication of fighting, tail biting or injury to the hoofs (FLIR, 2010). Another advantage of using IR is that segmentation of the animal from the resulting images is relatively straight forward if the surrounding temperature is not similar to animal temperature. This segmentation benefit could also be used to document when and where the animal excretes within its enclosure. Despite these benefits, the major problem with IR video cameras is that their expense which limits their application on farms. However, in future as they become cheaper and operate at higher resolutions, they will be the preferred choice for most applications (Banhazi et al., 2009a).
6
CONCLUSION
An animal welfare is the primary reason for its behaviour to be monitored. Hence, the main focus is to identify behaviours that lead up to the event that causes an animal’s welfare to be compromised. In particular, the behaviours which may result in long-term adverse effects need to be targeted. To achieve this, first tools to assess animal welfare are required (Smulders et al., 2006). Machine vision systems are able to facilitate this assessment and overcome problems related the level of individual animal attention, labour and welfare assessment. It is possible for a machine vision system to recognise the critical points in an observed behavioural sequence that indicates welfare problem. At one end of the scale the basic motion derived behaviours such as freezing (no-motion) and an animal’s movements relative to its environment can be tracked using relatively straight forward techniques. At the other end of the scale are complex behaviours which require more demanding reconstruction, validation and adaptation of models to document behaviour in detail.
Numerous experiments in psychology and pharmacology, involving visual observation of the interaction between humans and machines, and animals and objects were found in the literature.
ability to reconstruct relatively complex body movements from images and then recognise them. Behaviour recognition systems in commercial farm environments require more complex controls and sophisticated algorithms to be useful, as they need to assess large animals, large groups of animals and operate in dirty and often corrosive environments with non-uniform lighting. For these reasons, a number of authors experienced difficulties implementing behaviour recognition systems in commercial farms. Systems which can identify complex behaviours in and between animals are not currently commercially available. Given the techniques used, the performance of the commercial systems reviewed would be questionable if applied outside the laboratory environment. Therefore, further development is required to realize the full potential of vision-based techniques in monitoring and recognising the complex behaviour of livestock in commercial farm environments.
ACKNOWLEDGEMENT
We would like to acknowledge the financial assistance and support of the PORK CRC, and the professional support received from colleagues at the University of Southern Queensland and the National Centre of Engineering in Agriculture (NCEA).
REFERENCES
Aarnink, A. J. A., Schrama, J. W., Heetkamp, M. J. W., Stefanowska, J. & Huynh, T. T. T. (2006). Temperature and body weight affect fouling of pig pens. Journal of Animal Science 84(2224-2231). doi: 10.2527/jas.2005-521
Actimetrics (2010). Actimetrics, Available on www.actimetrics.com, Accessed on 8th July 2010.
Alberto, M. (2011).Appendix B - Motion Capture Service Providers. In Understanding Motion Capture for Computer Animation (Second Edition), 233-245 Boston: Morgan Kaufmann. doi: 10.1016/b978-0-12-381496-8.00014-7
Andersen, H., Jørgensen, E., Dybkjær, L. & Jørgensen, B. (2008). The ear skin temperature as an indicator of the thermal comfort of pigs. Applied Animal Behaviour Science 113(1-3): 43-56. doi:
10.1016/j.applanim.2007.11.003
Aydin, A., Cangar, O., Ozcan, S. E., Bahr, C. & Berckmans, D. (2010). Application of a fully automatic analysis tool to assess the activity of broiler chickens with different gait scores. Computers and Electronics in Agriculture
73(2): 194-199.
doi: 10.1016/j.compag.2010.05.004
Banhazi, T., Kitchen, J. & Tivey, D. (2009a). Potential of using infrared thermography for determination of skin wetness and thus perceived thermal comfort of pigs. Australian Journal of Multi-disciplinary Engineering 7(1): 47-54.
Banhazi, T. M., Tscharke, M., Ferdous, W. M., Saunders, C. & Lee, S.-H. (2009b).Using image analysis and statistical modelling to achieve improved pig weight predictions. In SEAg 2009, Vol. 1, CD publication (Eds T. Banhazi and C. Saunders). Brisbane, Australia: SEAg
Bay, H., Tuytelaars, T. & Van Gool, L. (2006). Surf: Speeded up robust features. Computer Vision–ECCV 2006: 404-417. doi: 10.1007/11744023_32
Bharatkumar, A. G., Daigle, K. E., Pandy, M. G., Cai, Q. & Aggarwal, J. K. (1994).Lower Limb Kinematics of Human Walking with the Medial Axis Transformation. In In Workshop on Motion of Non-Rigid and Articulated Objects, 70-76. doi: 10.1109/mnrao.1994.346252
Biobserve (2010). Biobserve, Available on www.biobserve.com, Accessed on 9th July 2010.
Brandl, N. & Jorgensen, E. (1996). Determination of live weight of pigs from dimensions measured using image analysis. Computers and Electronics in Agriculture 15(1): 57-72. doi: 10.1016/0168-1699(96)00003-8
Branson, K. & Belongie, S. (2005).Tracking multiple mouse contours (without too many samples). In Computer Vision and Pattern Recognition, 2005. CVPR 2005. IEEE Computer Society Conference on, Vol. 1, 1039-1046 vol. 1031. doi: 10.1109/cvpr.2005.349
Bregler, C. (1997).Learning and recognizing human dynamics in video sequences. 568-574. doi:
Brosnan, T. & Sun, D.-W. (2004). Improving quality inspection of food products by computer vision--a review.
Journal of Food Engineering 61(1): 3-16. doi: 10.1016/s0260-8774(03)00183-3
Burges, C. J. C. (1998). A tutorial on support vector machines for pattern recognition. Data mining and knowledge discovery 2(2): 121-167.
Burghardt, T. & Calic, J. (2006). Analysing animal behaviour in wildlife videos using face detection and tracking. Vision, Image and Signal Processing, IEE Proceedings - 153(3): 305-312. doi: 10.1049/ip-vis:20050052
Busse, M., Schwerdtner, W., Siebert, R., Doernberg, A., Kuntosch, A., König, B. & Bokelmann, W. (2015). Analysis of animal monitoring technologies in Germany from an innovation system perspective. Agricultural Systems 138(0): 55-65.
doi: 10.1016/j.agsy.2015.05.009
Cangar, Ö., Leroy, T., Guarino, M., Vranken, E., Fallon, R., Lenehan, J., Mee, J. & Berckmans, D. (2008). Automatic real-time monitoring of locomotion and posture behaviour of pregnant cows prior to calving using online image analysis. Computers and Electronics in Agriculture 64(1): 53-60. doi:
10.1016/j.compag.2008.05.014
Chen, Z. & Lee, H. J. (1992). Knowledge-guided visual perception of 3-D human gait from a single image sequence. IEEE Transactions on systems, man and cybernetics 22(2): 336-342. doi: 10.1109/21.148408
Chiao-Fe, S., Hampapur, A., Lu, M., Brown, L., Connell, J., Senior, A. & Yingli, T. (2005).IBM smart
surveillance system (S3): a open and extensible framework for event based surveillance. In IEEE Conference on Advanced Video and Signal Based Surveillance, 2005. AVSS 2005., 318-323. doi: 10.1109/avss.2005.1577288
Cornou, C. (2006). Automated oestrus detection methods in group housed sows: Review of the current methods and perspectives for development. Livestock Science 105(1-3): 1-11. doi: 10.1016/j.livsci.2006.05.023
Deumens, R., Jaken, R. J. P., Marcus, M. A. E. & Joosten, E. A. J. (2007). The CatWalk gait analysis in assessment of both dynamic and static gait changes after adult rat sciatic nerve resection. Journal of Neuroscience Methods 164(1): 120-130.
Duarte, S., Reig, L. & Oca, J. (2009). Measurement of sole activity by digital image analysis. Aquacultural Engineering 41(1): 22-27. doi: 10.1016/j.jneumeth.2007.04.009
Dutta, R., Smith, D., Rawnsley, R., Bishop-Hurley, G., Hills, J., Timms, G. & Henry, D. (2015). Dynamic cattle behavioural classification using supervised ensemble classifiers. Computers and Electronics in Agriculture
111(0): 18-28. doi: 10.1016/j.compag.2014.12.002
Ekkel, E. D., Spoolder, H. A. M., Hulsegge, I. & Hopster, H. (2003). Lying characteristics as determinants for space requirements in pigs. Applied Animal Behaviour Science 80(1): 19-30. doi:
10.1016/s0168-1591(02)00154-5
Favreau, L., Reveret, L., Depraz, C. & Cani, M.-P. (2006). Animal gaits from video: Comparative studies.
Graphical Models 68(2): 212-234. doi: 10.1016/j.gmod.2005.04.002
FLIR (2010). FLIR Systems, Available on www.flir.com/thermography/, Accessed on 4th Aug 2010. Fraser, A. (1983). The behaviour of maintenance and the intensive husbandry of cattle, sheep and pigs.
Agriculture, Ecosystems and Environment 9(1): 1-23. doi: 10.1016/0167-8809(83)90002-6
Freson, L., Godrie, S., Bos, N., Jourquin, J. & Geers, R. (1998). Validation of an infra-red sensor for oestrus detection of individually housed sows. Computers and Electronics in Agriculture 20(1): 21-29. doi:
10.1016/s0168-1699(98)00005-2
Gariepy, C., Amiot, J. & Nadai, S. (1989). Ante-mortem detection of PSE and DFD by infrared thermography of pigs before stunning. Meat Science 25(1): 37-41.
doi: 10.1016/0309-1740(89)90064-8
Gonyou, H. W., Zhou, J. H. & Stricklin, W. R. (1997).Applying Animat Technology to the Design and
Haritaoglu, I., Harwood, D. & Davis, L. S. (2000). W4: real-time surveillance of people and their activities.
Pattern Analysis and Machine Intelligence, IEEE Transactions on 22(8): 809-830. 10.1109/34.868683
HERMES (2009).HERMES - Human Expressive graphic Representation of Motion and their Evaluation in Sequences, EU Sixth Framework Programme, Final Project Report. (24 Pages).
Herring, S. W., Sola, O. M., Huang, X., Zhang, G. & Hayashida, N. (1993). Compartmentalization in the pig latissimus dorsi muscle. Cells Tissues Organs 147(1): 56-63. doi: 10.1159/000147482
How-Lung, E., Junxian, W., Wah, A. H. K. S. & Wei-Yun, Y. (2006). Robust human detection within a highly dynamic aquatic environment in real time. IEEE Transactions on Image Processing 15(6): 1583-1600. doi:
10.1109/tip.2006.871119
Kaihilahti, J., Suokannas, A. & Raussi, S. (2007). Observation of Cow Behaviour in an Automatic Milking System using Web-based Video Recording Technology. Biosystems Engineering 96(1): 91-97. doi:
10.1016/j.biosystemseng.2006.10.001
Kakadiaris, I. A. & Metaxas, D. (1996).Model-based estimation of 3D human motion with occlusion based on active multi-viewpoint selection. 81: Published by the IEEE Computer Society. doi: 10.1109/cvpr.1996.517057
Kakadiaris, I. A. & Metaxas, D. (1998). Three-dimensional human body model acquisition from multiple views.
International Journal of Computer Vision 30(3): 191-218. doi: 10.1109/iccv.1995.466881
Kalafatic, Z., Ribaric, S. & Stanisavljevic, V. (2001).A system for tracking laboratory animals based on optical flow and active contours. In 11th International Conference on Image Analysis and Processing., 334-339. doi:
10.1109/iciap.2001.957031
Kashiha, M., Pluk, A., Bahr, C., Vranken, E. & Berckmans, D. (2013). Development of an early warning system for a broiler house using computer vision. Biosystems Engineering 116(1): 36-45. doi:
10.1016/j.biosystemseng.2013.06.004
Kato, S., Tamada, K., Shimada, Y. & Chujo, T. (1996). A quantification of goldfish behavior by an image processing system. Behavioural Brain Research 80(1-2): 51-55.
doi: 10.1016/0166-4328(96)00018-6
Lind, N. M., Vinther, M., Hemmingsen, R. P. & Hansen, A. K. (2005). Validation of a digital video tracking system for recording pig locomotor behaviour. Journal of Neuroscience Methods 143(2): 123-132. doi:
10.1016/j.jneumeth.2004.09.019
Little, J. & Boyd, J. (1998). Recognizing people by their gait: the shape of motion. Videre: Journal of Computer Vision Research 1(2): 1-32.
Liu, Z. J., Kayalioglu, M., Shcherbatyy, V. & Seifi, A. (2007). Tongue deformation, jaw movement and muscle activity during mastication in pigs. Archives of oral biology 52(4): 309-312. doi:
10.1016/j.archoralbio.2006.10.024
Lowe, D. G. (1999).Object recognition from local scale-invariant features. In The Proceedings of the Seventh IEEE International Conference on Computer Vision. , Vol. 2, 1150-1157: IEEE. doi: 10.1109/iccv.1999.790410
Lowe, D. G. (2004). Distinctive image features from scale-invariant keypoints. International Journal of Computer Vision 60(2): 91-110. doi: 10.1023/b:visi.0000029664.99615.94
Maes, P., Darrell, T., Blumberg, B. & Pentland, A. (1997). The ALIVE system: Wireless, full-body interaction with autonomous agents. Multimedia Systems 5(2): 105-112.
doi: 10.1007/s005300050046
Med Associates Inc (2010). Med Associates, Inc , Available on www.med-associates.com, Accessed on 9th July 2010.
Moeslund, T. B. & Granum, E. (2001). A Survey of Computer Vision-Based Human Motion Capture. Computer Vision and Image Understanding 81(3): 231-268.
doi: 10.1006/cviu.2000.0897
Ng, E. & Acharya, R. (2009). Remote-sensing infrared thermography. Engineering in Medicine and Biology Magazine, IEEE 28(1): 76-83.
doi: 10.1109/memb.2008.931018
Noldus (2010). Software and labs for behavioural research and video tracking | Noldus Information Technology, Available on www.noldus.com, Accessed on 9th July 2010.
Noldus, L., Spink, A. J. & Tegelenbosch, R. A. J. (2001). EthoVision: a versatile video tracking system for automation of behavioral experiments. Behavior Research Methods, Instruments, & Computers 33(3): 398. doi:
10.3758/bf03195394
Noldus, L. P. J. J., Spink, A. J. & Tegelenbosch, R. A. J. (2002). Computerised video tracking, movement analysis and behaviour recognition in insects. Computers and Electronics in Agriculture 35(2-3): 201-227. doi:
10.1016/s0168-1699(02)00019-4
Oczak, M., Ismayilova, G., Costa, A., Viazzi, S., Sonoda, L. T., Fels, M., Bahr, C., Hartung, J., Guarino, M., Berckmans, D. & Vranken, E. (2013). Analysis of aggressive behaviours of pigs by automatic video recordings.
Computers and Electronics in Agriculture 99(0): 209-217. doi: 10.1016/j.compag.2013.09.015
Ostersen, T., Cornou, C. & Kristensen, A. R. (2010). Detecting oestrus by monitoring sows’ visits to a boar.
Computers and Electronics in Agriculture 74(1): 51-58. doi: 10.1016/j.compag.2010.06.003
Pedersen, B. K. & Madsen, T. N. (2001).Monitoring Water Intake in Pigs: Prediction of Disease and Stressors. In
Livestock Environment VI, 173-179 Louisville, Kentucky: The Society for engineering in agricultural, food, and biological systems.
doi: 10.13031/2013.7070
Pedersen, B. K., Petersen, L. B., Hjelholt, K., Andersen, H. M. L., Ruby, V. & Kai, P. (1998).Growing-Finishing Pigs: Cooling Reduces Aggressive Behaviour and Pen Fouling. In 15th International Pig Veterinary Society Congress, 5 Birmingham, England.
Pellis, S. M. (1988). Agonistic versus amicable targets of attack and defense: Consequences for the origin, function, and descriptive classification of play-fighting. Aggressive Behavior 14(2): 85-104. doi: 10.1002/1098-2337(1988)14:2%3C85::aid-ab2480140203%3E3.0.co;2-5
Pellis, S. M. & Pellis, V. C. (1987). Play-fighting differs from serious fighting in both target of attack and tactics of fighting in the laboratory rat Rattus norvegicus. Aggressive Behavior 13(4): 227-242.
doi: 10.1002/1098-2337(1987)13:4%3C227::aid-ab2480130406%3E3.0.co;2-c
Pereira, D. F., Miyamoto, B. C. B., Maia, G. D. N., Tatiana Sales, G., Magalhães, M. M. & Gates, R. S. (2013). Machine vision to identify broiler breeder behavior. Computers and Electronics in Agriculture 99(0): 194-199. doi: 10.1016/j.compag.2013.09.012
Perner, P. (2001). Motion tracking of animals for behavior analysis. Visual Form 2001: 779-786. doi: 10.1007/3-540-45129-3_72
Porto, S. M. C., Arcidiacono, C., Giummarra, A., Anguzza, U. & Cascone, G. (2014). Localisation and identification performances of a real-time location system based on ultra wide band technology for monitoring and tracking dairy cow behaviour in a semi-open free-stall barn. Computers and Electronics in Agriculture
108(0): 221-229.
doi: 10.1016/j.compag.2014.08.001
Qubit Systems Inc (2010). Qubit Systems, Inc , Available on www.qubitsystems.com, Accessed on 9th July 2010. Rainwater-Lovett, K., Pacheco, J. M., Packer, C. & Rodriguez, L. L. (2009). Detection of foot-and-mouth disease virus infected cattle using infrared thermography. The Veterinary Journal 180 ( 3): 317-324. doi:
10.1016/j.tvjl.2008.01.003
Rohr, K. & Systeme, A. K. (1997). Human movement analysis based on explicit motion models, chapter 8. In Motion-Based Recognition. doi: 10.1007/978-94-015-8935-2_8
Schaefer, A. L., Cook, N. J., Church, J. S., Basarab, J., Perry, B., Miller, C. & Tong, A. K. W. (2007). The use of infrared thermography as an early indicator of bovine respiratory disease complex in calves. Research in Veterinary Science 83(3): 376-384.
Schofield, C. P., Marchant, J. A., White, R. P., Brandl, N. & Wilson, M. (1999). Monitoring Pig Growth using a Prototype Imaging System. Journal of Agricultural Engineering Research 72(3): 205-210. doi:
10.1006/jaer.1998.0365
Schofield, C. P., Wathes, C. M. & Frost, A. R. (2002).Integrated Management Systems for Pigs - Increasing Production Efficiency and Welfare. In Animal Production in Australia, Vol. 24, 197-200 (Eds D. K. Revell and D. Taplin). Adelaide, South Australia.
Sergeant, D., Boyle, R. & Forbes, M. (1998). Computer visual tracking of poultry. Computers and Electronics in Agriculture 21(1): 1-18. doi: 10.1016/s0168-1699(98)00025-8
Shao, B. & Xin, H. (2008). A real-time computer vision assessment and control of thermal comfort for group-housed pigs. Computers and Electronics in Agriculture 62(1): 15-21. doi: 10.1016/j.compag.2007.09.006
Smulders, D., Verbeke, G., Mormède, P. & Geers, R. (2006). Validation of a behavioral observation tool to assess pig welfare. Physiology & Behavior 89(3): 438-447.
doi: 10.1016/j.physbeh.2006.07.002
Statham, P., Green, L., Bichard, M. & Mendl, M. (2009). Predicting tail-biting from behaviour of pigs prior to outbreaks. Applied Animal Behaviour Science 121(3-4): 157-164. doi: 10.1016/j.applanim.2009.09.011
Stewart, M., Webster, J. R., Verkerk, G. A., Schaefer, A. L., Colyn, J. J. & Stafford, K. J. (2007). Non-invasive measurement of stress in dairy cows using infrared thermography. Physiology & Behavior 92(3): 520-525. doi:
10.1016/j.physbeh.2007.04.034
Stricklin, W., De Bourcier, P., Zhou, J. & Gonyou, H. (1998). Artificial pigs in space: using artificial intelligence and artificial life techniques to design animal housing. J Anim Sci. 76(10): 2609-2613.
Sumpter, N., Boyle, R. & Tillett, R. (1997).Modelling collective animal behaviour using extended point-distribution models. University of Leeds, School of Computer Studies.
Šustr, P., Špinka, M., Cloutier, S. & Newberry, R. C. (2001). Computer-aided method for calculating animal configurations during social interactions from two-dimensional coordinates of color-marked body parts.
Behavior Research Methods, Instruments, & Computers 33(3): 364. doi: 10.3758/bf03195390
Tillett, R. D., Onyango, C. M. & Marchant, J. A. (1997). Using model-based image processing to track animal movements. Computers and Electronics in Agriculture 17(2): 249-261. doi: 10.1016/s0168-1699(96)01308-7
TSE-Systems (2010). phenotyping, behaviour, metabolism, inhalation research -TSE Systems, Available on
www.tse-systems.com, Accessed on 8th July 2010.
Tweed, D. & Calway, A. (2002).Tracking multiple animals in wildlife footage. In 16th International Conference on Pattern Recognition., Vol. 2, 24-27 vol.22.
doi: 10.1109/icpr.2002.1048227 (Kérdéses)
Vaughan, R., Sumpter, N., Henderson, J., Frost, A. & Cameron, S. (2000). Experiments in automatic flock control. Robotics and Autonomous Systems 31(1-2): 109-117.
doi: 10.1016/s0921-8890(99)00084-6
Vicon (2010). Motion Capture Systems from Vicon, Available on http://www.vicon.com/, Accessed on 4th August 2010
von Wachenfelt, H., Nilsson, C. & Pinzke, S. (2010). Gait and force analysis of provoked pig gait on clean and fouled rubber mat surfaces. Biosystems Engineering 106(1): 86-96.
Weary, D. M., Pajor, E. A., Fraser, D. & Honkanen, A.-M. (1996). Sow body movements that crush piglets: a comparison between two types of farrowing accommodation. Applied Animal Behaviour Science 49(2): 149-158. Wouters, P., Geers, R., Parduyuns, G., Goossens, K., Truyen, B., Goedseels, V. & Van der Stuyft, E. (1990). Image-analysis parameters as inputs for automatic environmental temperature control in piglet houses.
Computers and Electronics in Agriculture 4: 233-246. doi: 10.1016/0168-1699(90)90014-g
Wren, C. R., Azarbayejani, A., Darrell, T. & Pentland, A. P. (1997a). Pfinder: Real-time tracking of the human body. IEEE Transactions on Pattern Analysis and Machine Intelligence 19(7): 781. doi: 10.1109/34.598236
267 - 284.
doi: 10.1080/088395197118154
Xin, H. (1999). Assessing swine thermal comfort by image analysis of postural behaviors. Journal of Animal Science 77(E-Suppl 2): 1.
Xin, H. & Shao, B. (2002).Real-time Assessment of Swine Thermal Comfort by Computer Vision. In
Proceedings of the World Congress of Computers in Agriculture and Natural Resources, 362-369 (Eds F. S. Zazueta and J. Xin). 13-15, March 2002, Iguacu Falls, Brazil: ASAE. doi: 10.13031/2013.8353