ANALYSIS OF VEHICULAR NITROGEN OXIDES AND METEOROLOGICAL VARIABLES IN NEW DELHI
Uma Arora
Ex-Research Scientist CAS, IIT Delhi Block VI Hauz Khas New Delhi -110016
India
ABSTRACT: An analysis has been done to study the real time concentration of
vehicular nitrogen oxides (NO, NO2 & NOx ) and their correlation with meteorological
variables. The continuous hourly concentrations of NO NO2 & NOx and meteorological
variables were measured Jan.,1997- Aug.,1998.
The NO and NOx concentrations are found negatively correlated with wind
speed and temperature and positively correlated with humidity. The NO2 concentration
is positively correlated with wind speed and negatively correlated with humidity. It is found that all may be positively as well as negatively correlated with wind direction. Trend line has been calculated for each relation.
Key word index: Correlation, wind speed, Temperature, Humidity, Trend line.
1. INTRODUCTION
The present paper concentrates on vehicular pollutants NO, NO2 & NOx at a point
in the city i.e. IIT Delhi. Correlation of Nitrogen oxides with meteorological variables has been
Plotted and studied. Correlation study ( Cardenas et al.,1998 ) between CO, NOy , O3 and
non-methane hydrocarbons and their relationships with meteorology for the Norfolk coast, U.K. found that the concentrations of the chemical species were mostly a function of source characteristics with chemistry playing a minor role. Morel et. al., (1999) treated as air pollution a stochastic process and derived a probability distribution for air pollution concentration which was used to analyze the data from Santigo.
The objective of the present paper is to study the correlation of continuous hourly
measured data of NO, NO2 & NOx for 1977 and 1998 with meteorological variables
near outer ring road at IITD. Statistical analysis has been done to find the trend lines
and coefficient of correlation between NO, NO2 & NOx and meteorological variables
namely wind speed, humidity, temperature, and wind direction. The continuous
ISSN(O): 2249-3905, ISSN(P) : 2349-6525 | Impact Factor: 6.573 | Thomson Reuters ID: L-5236-2015
between pollution data and meteorological variables have been calculated. Due to large variation in daily concentration data out of the range has been neglected. Trend lines have been obtained.
2. MONITORING SITE AND EQUIPMENT
Delhi is located at 280 381 N latitude and 770 171 E longitude. The air pollution
monitoring laboratory was located inside the IIT Delhi campus. The laboratory was 10 km far from the airport, 10 km from the city centre and 28 m far from the main road – the outer ring road. The width of the road was 23.2 m. There was a boundary wall of 2m height between measuring laboratory and main road from the laboratory. As the instrument is installed near the road, all types of transport light and heavy i.e. two and three wheelers, cars, trucks, buses have been covered, though number of cars, two and three wheelers are more than heavy vehicles. On a working day number of vehicles were counted during peak hours i.e. 8-11 a.m. and 5-8 p.m. (refer Uma & Alok ,2001). HORIBA’S automatic stable air pollution monitoring system and meteorological measuring equipment were used for the measurement of data. In order to measure NO,
NO2 & NOx concentration continuously in ppm HORIBA’S APNA –350 E monitor has
been used, in which newly developed cross flow modulated (CFM) semidecompression chemiluminescene technique is used which results in remarkable zero drift performance and highest levels of sensitivity.
The manual calibration of the NO, NO2 & NOx analyzer was routinely accomplished by
the span and zero gas. The sample air flow rate was 1.5 l/m . Once in every seven days the control system switched automatically into a standard calibration. The range of
ambient NO, NO2 & NOx monitor was changed daily according to the time. The minimum
range was 0 ppm and maximum was 50 ppm. The pollutants from ambient air were sucked through glass sampling tube at the height of 4m from the ground surface. The measuring sensors for the meteorological variables, temperature and humidity, were at a height 10m and 2.8m respectively. The rotating propeller for wind speed and tail assembly for wind direction were at 10m height. The equipment allows to acquire, at its transmitter all the four meteorological variables. The converter of the equipment electrically converts the signal from each transmitter to record it continuously into an analog recorder and output it to the exterior. The output range for wind speed ,
temperature, humidity and wind direction were 0~ 30m/s, -50~50C, 0~100% and
0~540 respectively. The measuring accuracy for wind speed was better than 0.3m/s at
lower than 10m/s and better than 3% at higher than 10m/s.For temperature, humidity
and wind direction the measuring accuracies were better than 0.5C , 5% and 3
respectively. The analyzed mean hourly data of NO, NO2 & NOx and meteorological
3. RESULTS AND DISCUSSION
The continuous hourly mean data were recorded from January 1997 to mid
August 1998 of vehicular NO, NO2 & NOx. Due to variation in data a big number of
values has been discarded. Statistical analysis was done to find the the trend lines and
coefficient of correlation between NO, NO2 & NOx and meteorological variables
namely wind speed, humidity, temperature, and wind direction. The NO and NOx concentrations are found negatively correlated with wind speed and temperature
and positively correlated with humidity. The NO2 concentration is positively correlated
with wind speed and negatively correlated with humidity. It is found that all Nitrogen oxides may be positively as well as negatively correlated with wind direction. The NO,
NO2 & NOx concentration vs. meteorological variables wind speed, humidity,
temperature and wind direction for 1977 and 1998 have been plotted in figures 1, 2
and 3 respectively. These figures show the overall trend of the NO, NO2 & NOX
concentrations with respect to four meteorological variables. In few places data was not available.
NO (in ppm) vs. METEOROLOGICAL VARIABLES
Fig. 1
NO2 (in ppm) vs. METEOROLOGICAL VARIABLE
ISSN(O): 2249-3905, ISSN(P) : 2349-6525 | Impact Factor: 6.573 | Thomson Reuters ID: L-5236-2015
Fig. 2
NOx ( in ppm) vs. METEOROLOGICAL VARIABLES
ISSN(O): 2249-3905, ISSN(P) : 2349-6525 | Impact Factor: 6.573 | Thomson Reuters ID: L-5236-2015
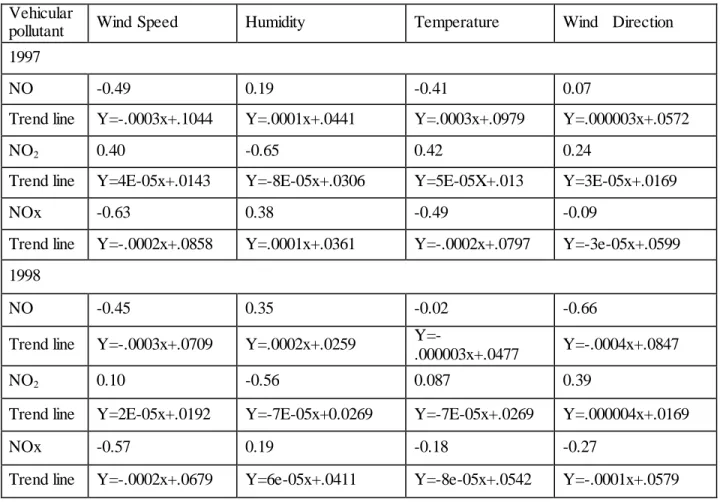
Table 1 shows the correlation coefficients and trend lines of NO, NO2 & NOx with wind
speed, temperature, humidity and wind direction.
Vehicular
pollutant Wind Speed Humidity Temperature Wind Direction
1997
NO -0.49 0.19 -0.41 0.07
Trend line Y=-.0003x+.1044 Y=.0001x+.0441 Y=.0003x+.0979 Y=.000003x+.0572
NO2 0.40 -0.65 0.42 0.24
Trend line Y=4E-05x+.0143 Y=-8E-05x+.0306 Y=5E-05X+.013 Y=3E-05x+.0169
NOx -0.63 0.38 -0.49 -0.09
Trend line Y=-.0002x+.0858 Y=.0001x+.0361 Y=-.0002x+.0797 Y=-3e-05x+.0599
1998
NO -0.45 0.35 -0.02 -0.66
Trend line Y=-.0003x+.0709 Y=.0002x+.0259
Y=-.000003x+.0477 Y=-.0004x+.0847
NO2 0.10 -0.56 0.087 0.39
Trend line Y=2E-05x+.0192 Y=-7E-05x+0.0269 Y=-7E-05x+.0269 Y=.000004x+.0169
NOx -0.57 0.19 -0.18 -0.27
Trend line Y=-.0002x+.0679 Y=6e-05x+.0411 Y=-8e-05x+.0542 Y=-.0001x+.0579
Correlation coefficients of NO, NO2 and NOX with wind speed, Humidity, Temperature and
wind directions and trend lines. Y shows the concentration of Nitrogen oxides and variable x shows the meteorological variable. Table 1
AKNOWLEDGEMENTS
ISSN(O): 2249-3905, ISSN(P) : 2349-6525 | Impact Factor: 6.573 | Thomson Reuters ID: L-5236-2015
REFERENCES
Cardenas , L.M., Austin, J.F., Burgress R.A. et. al.(1998) Correlations between CO, NOy, O3 and
non –methane hydrocarbons and their relationships with meteorology during winter 1993 on the north norfolk coast, U.K. Atmospheric Environment 32,3339-3351.