REVIEW ARTICLE
Iran J Allergy Asthma Immunol June 2019; 18(3):251-261.
Interleukin-18
Polymorphisms Deficiency Association with Asthma Risk:
An Update Meta-analysis
Huan Liu1,2, Yu Feng3, Wei Zhang2, Xiao-Dong Deng2, Ying Ma4, and Yun Liu2
1
Department of Preventive Medicine, North Sichuan Medical College, Nanchong, Sichuan, China
2 Department of Forensic Medicine, North Sichuan Medical College, Nanchong, Sichuan, China 3
Department of Criminal Science and Technology, Chongqing Police College, Chongqing, China
4 Department of Neurology, Affiliated Hospital of North Sichuan Medical College, Nanchong, Sichuan, China
Received: 5 April 2018; Received in revised form: 20 December 2018; Accepted: 21 January 2019
ABSTRACT
Growing evidence indicated conflicting results that Interleukin-18 (IL-18) promoter polymorphisms rs1946518 (A-607C), rs187238 (G-137C) and rs549908 (A-105C) were associated with asthma risk. The aim of this study is to comprehensively evaluate the IL-18 polymorphisms and asthma by a systematic review and meta-analysis.
A total of 12 studies testing the association between these polymorphisms and asthma were examined (8 studies for A-607C, 8 studies for G-137C, and 4 studies for A-105C) in the update meta-analysis, up to Dec 30, 2017. Summary odds ratios (ORs) and 95% confidence intervals (CI) were used to estimate the strength of association between each polymorphism and asthma using fixed- and random-effects models when appropriate. Heterogeneity and publication bias were evaluated.
The meta-analysis results indicated that any allele frequencies of the IL-18 polymorphisms (A-607C, G-137C and A-105C) was not associated with asthma risk (p>0.05). And no statistically significant association was observed between genotype frequencies of these polymorphisms and asthma under different genetic models (p>0.05). Subgroup analysis results were similar to the main analysis by ethnicity, sample size, genotyping methods, matching criteria and quality score. There was no evidence of publication bias.
The present meta-analysis suggests that IL-18 polymorphisms (A-607C, G-137C and A-105C) were unlikely to be associated with asthma risk.
Keywords: Asthma; Genetic susceptibility; Interleukin-18; Meta-analysis; Single nucleotide polymorphism
INTRODUCTION
Asthma is a common, complex, chronic medical condition, which is characterized by lung inflammation,
Corresponding Author:Yun Liu, PhD;
Department of Forensic Medicine, North Sichuan Medical College, NO.234 Fujiang Road, Nanchong, 637000, Sichuan, China. Tel/Fax: (+86 817) 2240 083, E-mail: [email protected]
reversible airflow obstruction, and enhanced airway
responsiveness to a diversity of environmental stimuli.1
It was caused by a combination of genetic and environmental factors,2,3 and which is associated with the imbalance of different types of helper T cells (Th),
especially the imbalance of Th1/Th2 cells,4,5
involved in regulating the immune response of Th1/Th2 cells.6 So the IL-18 gene is considered as a candidate asthma susceptibility gene. IL-18 was initially isolated from the serum of Mycobacterium bovis Bacillus Calmette-Guerin (BCG)-infected mice challenged with lipopolysaccharide (LPS) which is a member of the Interleukin-1 (IL-1) family and described as IFN-γ-inducing factor (IGIF).7,8 The gene for human IL-18 is located on chromosome 11q22.2-22.3, a region that has been previously linked to atopy-related traits.9
Recently, IL-18 promoter polymorphisms at positions A-607C (rs1946518), G-137C (rs187238) and A-105C (rs549908) had been extensively studied. However, the results of these studies were incoherent. Many studied suggested that the IL-18 polymorphisms
were associated with asthma,10-14 whereas some studies
indicated that lack of an association between IL-18
polymorphisms and asthma.6,15-18 The inconsistent
results may result in a single study or small sample size
makes the lower statistical power. Ma and colleagues’19
conducted a meta-analysis to evaluate the association between these polymorphisms (A-607C, G-137C) and the risk of asthma in 2012. In their study, A-607C polymorphism was associated with asthma risk, but G-137C did not. In the past few years, more studies concerning the association between the IL-18 polymorphisms (A-607C, G-137C) and the risk of
asthma have been published in different
regions.12,13,17,18 We thought these studies should also be included, and we added a new polymorphism (A-105C) of IL-18.14,15,20,21 Thus, the aim of our study is to use a systematic review and update meta-analysis to estimate the association between IL-18 polymorphisms (A-607C, G-137C, and A-105C) and asthma according to all published case-control studies.
MATERIALS AND METHODS
Publication Search
We searched the PubMed, Medline, Web of Science, Wanfang and China National Knowledge Infrastructure (CNKI) databases for all articles on the association between IL-18 polymorphisms and asthma up till December 30, 2017. The search terms were as followed: (“IL-18” or “interleukin-18” or “interleukin 18” or “IGIF”) and (“genetic variation” or “genetic variant” or “polymorphism” or “snps”) and (“asthma” or “bronchial asthma” or “allergic asthma”). All of the
identified articles and their references were checked as well for other relevant studies. We evaluated review and previous meta-analysis articles in order to found additional eligible studies.
Inclusion Criteria and Exclusion Criteria
Eligible studies should cater all the followed criteria: 1. Studies on people were associated between the IL-18 gene polymorphisms (A-607C, G-137C, and A-105C) and asthma, but not animal experiments. 2. Studies should cater case-control or cross-sectional research, and excluded review, systematic review or meta-analysis. 3. Data provided within the studies was useful for odds ratios (ORs) and 95% credibility interval (CI), or ORs and 95%CI can be calculated. Studies without extractable or credible data should be excluded.22 4. For overlapping studies, only the most complete or the latest literature will be included. 5. The meta-analysis is not limited sample size of the literature, no matter how many samples can be included.
Data Extraction
Data was extracted from each eligible literature according to the above-mentioned inclusion and exclusion criteria listed by 2 investigators (Liu H and
Zhang W)independently, who were blinded to each
other. Extractive data were checked by 1 investigator (Deng XD), and disputed data were resolved through negotiation. Characteristics of the studies were extracted as followed: first author, year of publication, country, Ethnicity, numbers of cases and controls, genotype distribution, allele frequency, evidence of
hardy-weinberg equilibrium (HWE), genotyping
methods, and matching variables. The basic
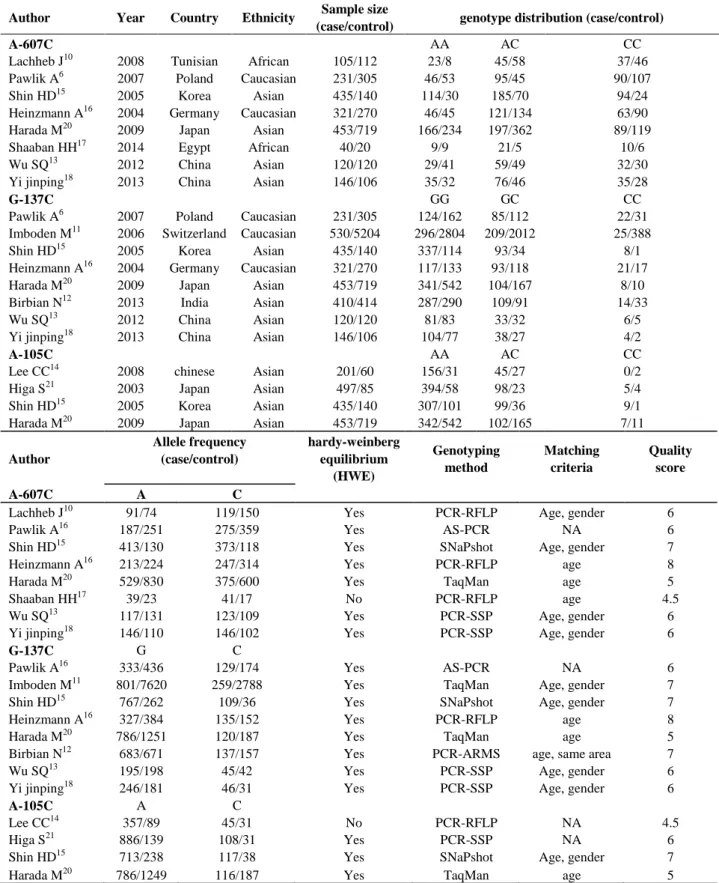
information of eligible studies was showed in Table 1.
Quality Score Assessment
Table 1. Characteristics of the studies included in the meta-analysis on interleukin-18 polymorphisms and asthma risk
Author Year Country Ethnicity Sample size
(case/control) genotype distribution (case/control)
A-607C AA AC CC
Lachheb J10 2008 Tunisian African 105/112 23/8 45/58 37/46
Pawlik A6 2007 Poland Caucasian 231/305 46/53 95/45 90/107
Shin HD15 2005 Korea Asian 435/140 114/30 185/70 94/24
Heinzmann A16 2004 Germany Caucasian 321/270 46/45 121/134 63/90
Harada M20 2009 Japan Asian 453/719 166/234 197/362 89/119
Shaaban HH17 2014 Egypt African 40/20 9/9 21/5 10/6
Wu SQ13 2012 China Asian 120/120 29/41 59/49 32/30
Yi jinping18 2013 China Asian 146/106 35/32 76/46 35/28
G-137C GG GC CC
Pawlik A6 2007 Poland Caucasian 231/305 124/162 85/112 22/31
Imboden M11 2006 Switzerland Caucasian 530/5204 296/2804 209/2012 25/388
Shin HD15 2005 Korea Asian 435/140 337/114 93/34 8/1
Heinzmann A16 2004 Germany Caucasian 321/270 117/133 93/118 21/17
Harada M20 2009 Japan Asian 453/719 341/542 104/167 8/10
Birbian N12 2013 India Asian 410/414 287/290 109/91 14/33
Wu SQ13 2012 China Asian 120/120 81/83 33/32 6/5
Yi jinping18 2013 China Asian 146/106 104/77 38/27 4/2
A-105C AA AC CC
Lee CC14 2008 chinese Asian 201/60 156/31 45/27 0/2
Higa S21 2003 Japan Asian 497/85 394/58 98/23 5/4
Shin HD15 2005 Korea Asian 435/140 307/101 99/36 9/1
Harada M20 2009 Japan Asian 453/719 342/542 102/165 7/11
Author
Allele frequency (case/control)
hardy-weinberg equilibrium
(HWE)
Genotyping method
Matching criteria
Quality score
A-607C A C
Lachheb J10 91/74 119/150 Yes PCR-RFLP Age, gender 6
Pawlik A16 187/251 275/359 Yes AS-PCR NA 6
Shin HD15 413/130 373/118 Yes SNaPshot Age, gender 7
Heinzmann A16 213/224 247/314 Yes PCR-RFLP age 8
Harada M20 529/830 375/600 Yes TaqMan age 5
Shaaban HH17 39/23 41/17 No PCR-RFLP age 4.5
Wu SQ13 117/131 123/109 Yes PCR-SSP Age, gender 6
Yi jinping18 146/110 146/102 Yes PCR-SSP Age, gender 6
G-137C G C
Pawlik A16 333/436 129/174 Yes AS-PCR NA 6
Imboden M11 801/7620 259/2788 Yes TaqMan Age, gender 7
Shin HD15 767/262 109/36 Yes SNaPshot Age, gender 7
Heinzmann A16 327/384 135/152 Yes PCR-RFLP age 8
Harada M20 786/1251 120/187 Yes TaqMan age 5
Birbian N12 683/671 137/157 Yes PCR-ARMS age, same area 7
Wu SQ13 195/198 45/42 Yes PCR-SSP Age, gender 6
Yi jinping18 246/181 46/31 Yes PCR-SSP Age, gender 6
A-105C A C
Lee CC14 357/89 45/31 No PCR-RFLP NA 4.5
Higa S21 886/139 108/31 Yes PCR-SSP NA 6
Shin HD15 713/238 117/38 Yes SNaPshot Age, gender 7
Harada M20 786/1249 116/187 Yes TaqMan age 5
Statistical Analysis
We first checked the control subjects in each study if there was significant deviation from the HWE by a
web-based program (http://ihg2
helmholtz-muenchen.de/cgi-bin/hw/hwa1.pl), and considered
p<0.05 was significant.
The STATA software (version 12, Stata
Corporation) was applied for data calculation and analysis. Summary ORs with corresponding 95% CI were used to estimate the association between genotypes, allele and asthma genetic risk for each polymorphism in different comparison genetic models and allele, including dominant model (-607A/C: CC + CA vs AA, -137G/C: CC + GC vs GG, and -105A/C: CC + CA vs AA), and recessive model (-607A/C: CC vs CA + AA, -137G/C: CC vs GC + GG, and -105A/C: CC vs CA + AA), heterozygote comparison (-607A/C: CA vs AA, -137G/C: GC vs GG, and -105A/C: CA vs AA), homozygote comparison (607A/C: CC vs AA, -137G/C: CC vs GG, and -105A/C: CC vs AA), and allele comparison (-607A/C: C vs A, -137G/C: C vs G, and -105A/C: C vs A ), respectively.
The statistical heterogeneity among eligible studies was estimated using the Q-test and I2 statistics.25,26 The fixed-effect model (Mantel-Haenszel method) was used to estimate the pooled ORs if the heterogeneity among studies was not significant (p>0.10 and I²<50%).
Otherwise, random-effect model should be
considered.27,28 To explore sources of heterogeneity in
studies, we used a galbraith plot to estimate the
heterogeneity. Besides, logistic meta-regression
analysis and subgroup analysis were performed to investigate potential sources of heterogeneity among studies. The logistic meta-regression analysis was conducted by year of publication, ethnicity, sample size
(≥500 and<500 subjects), genotyping methods,
matching criteria and HWE. Subgroup analysis included the following variables: ethnicity (Asian and
No Asian), Sample size (≥500 and<500 subjects),
genotyping methods (polymerase chain reaction-restriction fragment length polymorphism (PCR-RFLP) and no PCR-RFLP), matching criteria and quality score. Since the number of studies of -105A/C locus was only 4, logistic meta-regression analysis and subgroup analysis were not performed.
Sensitivity analysis was applied to evaluate the reliability of this meta-analysis. A Begg’s funnel plot and Egger’s regression asymmetry test were used to evaluate publication bias of eligible studies, if p<0.05,
publication bias was considered statistically
significant.29,30
RESULTS
Characteristics of Studies
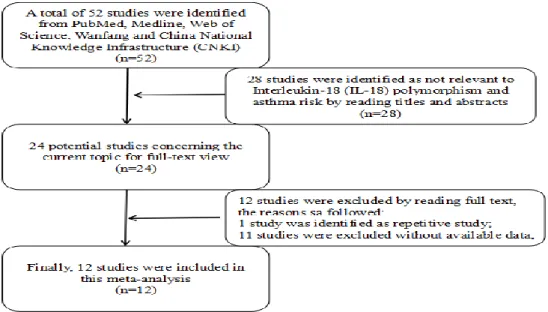
In total, 12 literatures fulfilled the criteria (Figure 1).
In some literatures, two or three gene loci have been studied.6,13,15,16,18,20 The characteristics of the literatures are summarized in Table 1. For IL-18 polymorphisms, all the 8 studies (1851 cases and 1792 controls) for -607 A/C,6,10,13,15-18,20 8 studies (2646 cases and 7278 controls) for -137 G/C6,11-13,15,16,18,20 and 4 studies (1586 cases and 1004 controls) for -105 A/C14,15,20,21 were conducted in the meta-analysis. Four studies were conducted in Asian,13,15,18,20 tow in Caucasian,6,16 and tow in African10,17 for -607A/C; Five studies were conducted in Asian,12,13,15,18,20 three in
Caucasian6,11,16 for 137 G/C; Four studies were
conducted in Asian14,15,20,21 for 105 A/C. The sample size varied greatly in the eligible literatures, ranging from 60 to 5734. SNaPShot, TaqMan, AS-PCR,PCR-RFLP, PCR-SSP and PCR-ARMS genotyping methods were used among the eligible literatures. Except for
Lee CC14 and Shaaban HH,17 the genotype distributions
among the controls of all eligible literatures were
consistent with HWE. All studies have presented matching information, such as age and gender, except for the studies of Pawlik A,6 Lee CC14 and Higa S.21
Main Results of Meta-Analysis
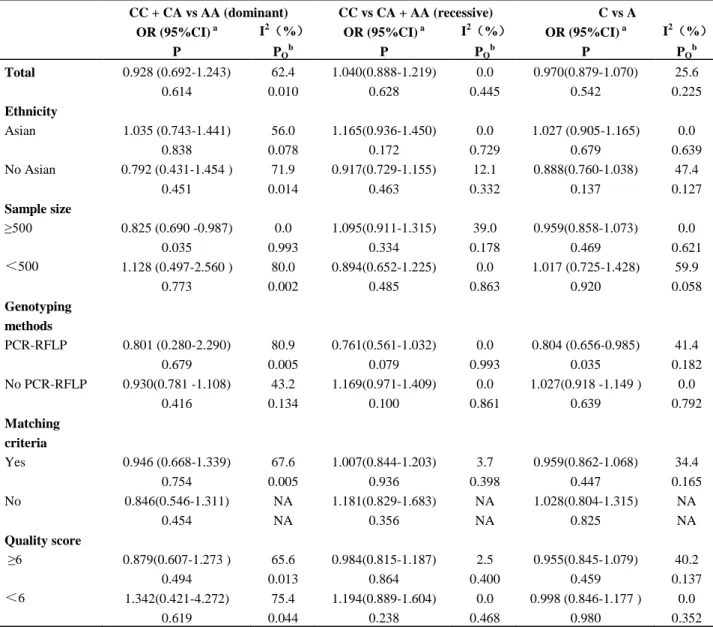
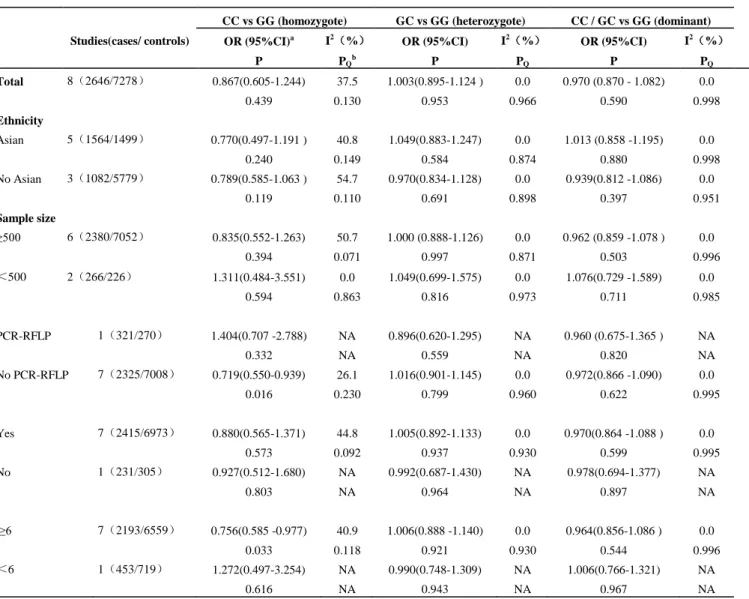
The meta-analysis suggested that the A-607C polymorphism, G-137C polymorphism and A-105C polymorphism were not associated with asthma in all comparison allele and genotypes genetic models (dominant, recessive, heterozygote and homozygote; Table 2, Table 3, and Table 4). However, we failed to find out any significant association between the A-607C polymorphism, G-137C polymorphism and asthma in all comparison allele and genotypes models through subgroup analysis according to ethnicity, sample size, genotyping methods, matching criteria and quality score (Table 2, Table 3). Since the number of studies of -105A/C locus was only 4, subgroup analysis were not performed.
Table 2. Stratified analysis of the interleukin-18 (IL-18) -607A/C polymorphism on asthma risk
Studies(cases/c ontrols)
CC vs AA (homozygote) CA vs AA (heterozygote) OR (95%CI)a
P
I2(%) PQb
OR (95%CI) P
I2(%) PQb Total 8(1851/1792) 0.951(0.781-1.158) 39.0 0.936(0.672-1.304 ) 66.4
0.617 0.119 0.695 0.004
Ethnicity
Asian 4(1154/1085) 1.114(0.866 -1.434 ) 0.0 1.048(0.714-1.539) 62.6
0.402 0.822 0.810 0.045
No Asian 4(697/707) 0.715(0.413-1.239) 57.0 0.816(0.411-1.619) 74.4
0.231 0.073 0.561 0.008
Sample size
≥500 4(1440/1434) 0.951(0.758-1.193) 0.0 0.813(0.672-0.985) 0.0
0.662 0.583 0.034 0.868
<500 4(411/358) 0.934(0.432-2.018) 68.5 1.242 (0.498-3.095) 81.1
0.862 0.023 0.643 0.001
Genotyping methods
PCR-RFLP 3(466/402) 0.619(0.274-1.395) 60.4 0.907(0.272-3.019) 82.9
0.247 0.080 0.873 0.003
No PCR-RFLP 5(1385/1390) 1.081(0.864-1.353) 0.0 0.971(0.714-1.320) 54.5
0.493 0.884 0.850 0.067
Matching criteria
Yes 7(1620/1487) 0.931(0.667-1.300) 47.7 0.976(0.662-1.440) 70.4
0.674 0.075 0.904 0.002
No 0.969(0.597-1.573) NA 0.755(0.471-1.210) NA
1(231/305) 0.899 NA 0.243 NA
Quality score
≥6 6(1358/1053) 0.877(0.608-1.265) 51.2 0.869(0.578-1.308) 68.0
0.482 0.069 0.501 0.008
<6 2(493/739) 1.083(0.779-1.504) 0.0 1.642(0.352-7.651) 80.8
Table 2. Continue
CC + CA vs AA (dominant) CC vs CA + AA (recessive) C vs A OR (95%CI) a
P
I2(%)
PQb
OR (95%CI) a P
I2(%)
PQb
OR (95%CI) a P
I2(%)
PQb Total 0.928 (0.692-1.243) 62.4 1.040(0.888-1.219) 0.0 0.970(0.879-1.070) 25.6
0.614 0.010 0.628 0.445 0.542 0.225
Ethnicity
Asian 1.035 (0.743-1.441) 56.0 1.165(0.936-1.450) 0.0 1.027 (0.905-1.165) 0.0
0.838 0.078 0.172 0.729 0.679 0.639
No Asian 0.792 (0.431-1.454 ) 71.9 0.917(0.729-1.155) 12.1 0.888(0.760-1.038) 47.4
0.451 0.014 0.463 0.332 0.137 0.127
Sample size
≥500 0.825 (0.690 -0.987) 0.0 1.095(0.911-1.315) 39.0 0.959(0.858-1.073) 0.0
0.035 0.993 0.334 0.178 0.469 0.621
<500 1.128 (0.497-2.560 ) 80.0 0.894(0.652-1.225) 0.0 1.017 (0.725-1.428) 59.9
0.773 0.002 0.485 0.863 0.920 0.058
Genotyping methods
PCR-RFLP 0.801 (0.280-2.290) 80.9 0.761(0.561-1.032) 0.0 0.804 (0.656-0.985) 41.4
0.679 0.005 0.079 0.993 0.035 0.182
No PCR-RFLP 0.930(0.781 -1.108) 43.2 1.169(0.971-1.409) 0.0 1.027(0.918 -1.149 ) 0.0
0.416 0.134 0.100 0.861 0.639 0.792
Matching criteria
Yes 0.946 (0.668-1.339) 67.6 1.007(0.844-1.203) 3.7 0.959(0.862-1.068) 34.4
0.754 0.005 0.936 0.398 0.447 0.165
No 0.846(0.546-1.311) NA 1.181(0.829-1.683) NA 1.028(0.804-1.315) NA
0.454 NA 0.356 NA 0.825 NA
Quality score
≥6 0.879(0.607-1.273 ) 65.6 0.984(0.815-1.187) 2.5 0.955(0.845-1.079) 40.2
0.494 0.013 0.864 0.400 0.459 0.137
<6 1.342(0.421-4.272) 75.4 1.194(0.889-1.604) 0.0 0.998 (0.846-1.177 ) 0.0
0.619 0.044 0.238 0.468 0.980 0.352
a
95% confidence intervals. b PQ value of Q test for heterogeneity test and associated I2 are shown. Random-effects model was used when I2>50% and/or PQ<0.1; otherwise, fixed-effects model was used. NA, not applicable.
Heterogeneity Analysis A-607C polymorphism
For dominant and heterozygote genetic models, the values of I2 and PQ were greater than 50% and less than
0.10, which indicated statistically significant
heterogeneity among eligible literatures. Logistic meta-regression analysis was performed to explore the
sources of heterogeneity among the eligible
publications, including year of publication, ethnicity, sample size, genotyping methods, matching criteria and
HWE. However, no data could explain the
heterogeneity in allele and different comparison genetic
models (p≥0.501). Subgroup analysis based on
recessive: I2=8.0%, PQ=0.365; heterozygote: I2=43.2%,
PQ=0.117; homozygote: I
2
=0.0%, PQ=0.601). And
summary ORs and 95%CI were not significantly influenced (allel: OR=0.991, 95%CI=0.895-1.098,
p=0.861; dominant: OR=0.913, 95%CI=0.776-1.074,
p=0.273; recessive: OR=1.074, 95%CI=0.909-1.270,
p=0.402; heterozygote: OR=0.912,
95%CI=0.766-1.085, p=0.298; homozygote: OR=1.007,
95%CI=0.820-1.237, p=0.946). The results indicated
that the Lachheb J10 and Shaaban HH17studies were the
major sources of the heterogeneity in the meta-analysis.
G-137C Polymorphism
For recessive genetic models, the values of PQ was
less than 0.10, which indicated statistically
heterogeneity among eligible literatures. Logistic meta-regression analysis was performed to explore the
sources of heterogeneity among the eligible
publications, including year of publication, ethnicity, sample size, genotyping methods, matching criteria. However, no data could explain the heterogeneity in allele and different comparison genetic models (p≥0.728).
Table 3. Stratified analysis of the IL-18 -137G/C polymorphism on asthma risk
Studies(cases/ controls)
CC vs GG (homozygote) GC vs GG (heterozygote) CC / GC vs GG (dominant)
OR (95%CI)a
P
I2(%)
PQb
OR (95%CI)
P
I2(%)
PQ
OR (95%CI)
P
I2(%)
PQ
Total 8(2646/7278) 0.867(0.605-1.244) 37.5 1.003(0.895-1.124 ) 0.0 0.970 (0.870 - 1.082) 0.0
0.439 0.130 0.953 0.966 0.590 0.998
Ethnicity
Asian 5(1564/1499) 0.770(0.497-1.191 ) 40.8 1.049(0.883-1.247) 0.0 1.013 (0.858 -1.195) 0.0
0.240 0.149 0.584 0.874 0.880 0.998
No Asian 3(1082/5779) 0.789(0.585-1.063 ) 54.7 0.970(0.834-1.128) 0.0 0.939(0.812 -1.086) 0.0
0.119 0.110 0.691 0.898 0.397 0.951
Sample size
≥500 6(2380/7052) 0.835(0.552-1.263) 50.7 1.000 (0.888-1.126) 0.0 0.962 (0.859 -1.078 ) 0.0
0.394 0.071 0.997 0.871 0.503 0.996
<500 2(266/226) 1.311(0.484-3.551) 0.0 1.049(0.699-1.575) 0.0 1.076(0.729 -1.589) 0.0
0.594 0.863 0.816 0.973 0.711 0.985
PCR-RFLP 1(321/270) 1.404(0.707 -2.788) NA 0.896(0.620-1.295) NA 0.960 (0.675-1.365 ) NA
0.332 NA 0.559 NA 0.820 NA
No PCR-RFLP 7(2325/7008) 0.719(0.550-0.939) 26.1 1.016(0.901-1.145) 0.0 0.972(0.866 -1.090) 0.0
0.016 0.230 0.799 0.960 0.622 0.995
Yes 7(2415/6973) 0.880(0.565-1.371) 44.8 1.005(0.892-1.133) 0.0 0.970(0.864 -1.088 ) 0.0
0.573 0.092 0.937 0.930 0.599 0.995
No 1(231/305) 0.927(0.512-1.680) NA 0.992(0.687-1.430) NA 0.978(0.694-1.377) NA
0.803 NA 0.964 NA 0.897 NA
≥6 7(2193/6559) 0.756(0.585 -0.977) 40.9 1.006(0.888 -1.140) 0.0 0.964(0.856-1.086 ) 0.0
0.033 0.118 0.921 0.930 0.544 0.996
<6 1(453/719) 1.272(0.497-3.254) NA 0.990(0.748-1.309) NA 1.006(0.766-1.321) NA
0.616 NA 0.943 NA 0.967 NA
a 95% confidence intervals. bQ value of Q test for heterogeneity test and associated I2 are shown.Random-effects model was used when I2>50% and/or
Table 3. Continue
Studies(cases/ controls)
CC vs GC/GG (recessive) C vs G
OR (95%CI) P
I2(%)
PQ
OR (95%CI) P
I2(%)
PQ
Total 8(2646/7278) 0.881(0.603-1.288) 44.2 0.946 (0.864-1.036) 0.0
0.514 0.084 0.232 0.869
Ethnicity
Asian 5(1564/1499) 0.747(0.485-1.152) 45.7 0.977 (0.845-1.130) 0.0
0.188 0.118 0.752 0.803
No Asian 3(1082/5779) 0.897(0.543-1.480) 60.6 0.926(0.824-1.040) 0.0
0.669 0.079 0.195 0.541
Sample size
≥500 6(2380/7052) 0.848(0.548-1.310) 56.7 0.935(0.851-1.027) 0.0
0.457 0.041 0.163 0.785
<500 2(266/226) 1.292(0.481-3.475) 0.0 1.090 (0.777 -1.529) 0.0
0.611 0.859 0.619 0.992
Genotyping methods
PCR-RFLP 1(321/270) 1.476(0.759-2.872) NA 1.043 (0.792-1.373 ) NA
0.251 NA 0.764 NA
No PCR-RFLP 7(2325/7008) 0.714(0.549-0.929) 31.2 0.934(0.848-1.028) 0.0
0.012 0.190 0.165 0.855
Matching criteria
Yes 7(2415/6973) 0.896(0.562-1.429) 50.9 0.942(0.856-1.038) 0.0
0.645 0.057 0.226 0.793
No 1(231/305) 0.930(0.523-1.654) NA 0.971(0.742-1.270) NA
0.806 NA 0.828 NA
Quality score
≥6 7(2193/6559) 0.848(0.561-1.281) 47.9 0.934(0.847-1.030) 0.0
0.433 0.074 0.171 0.842
<6 1(453/719) 1.275(0.499-3.254) NA 1.021(0.799-1.306 ) NA
0.612 NA 0.866 NA
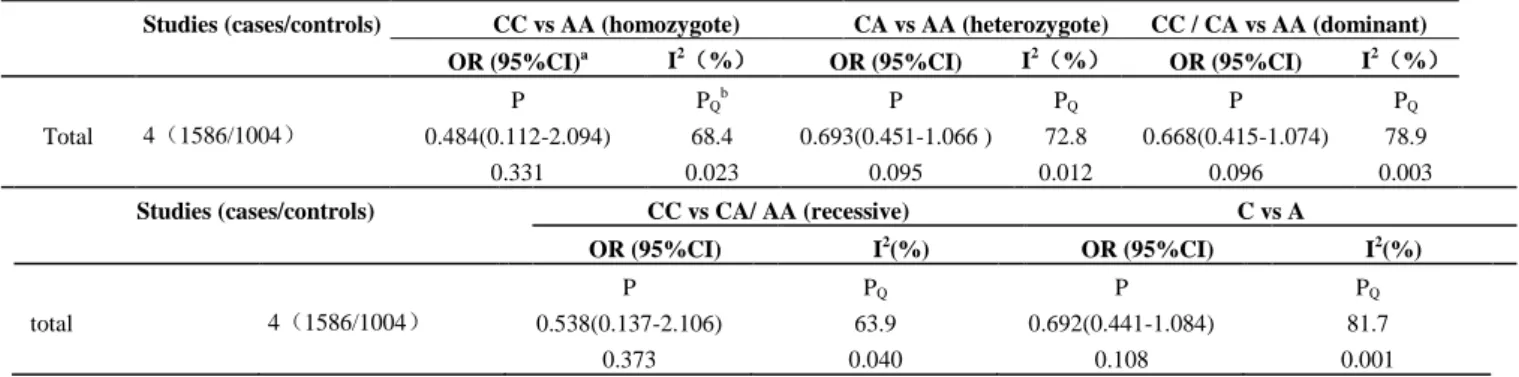
Table 4. Main analysis of the IL-18-105A/C polymorphism on asthma risk
Studies (cases/controls) CC vs AA (homozygote) CA vs AA (heterozygote) CC / CA vs AA (dominant)
OR (95%CI)a I2(%)
OR (95%CI) I2(%)
OR (95%CI) I2(%)
P PQb P PQ P PQ
Total 4(1586/1004) 0.484(0.112-2.094) 68.4 0.693(0.451-1.066 ) 72.8 0.668(0.415-1.074) 78.9
0.331 0.023 0.095 0.012 0.096 0.003
Studies (cases/controls) CC vs CA/ AA (recessive) C vs A
OR (95%CI) I2(%) OR (95%CI) I2(%)
P PQ P PQ
total 4(1586/1004) 0.538(0.137-2.106) 63.9 0.692(0.441-1.084) 81.7
0.373 0.040 0.108 0.001
a 95% confidence intervals. bPQ value of Q test for heterogeneity test and associated I2 are shown. Random-effects model was used when I2>50% and/or
Subgroup analysis (Table 3) and galbraith plots
showed that the Imboden M11 maybe the source of
heterogeneity. The heterogeneity was greatly dropped under allele and different comparison genetic models by omitting the literature (allel: I2=0.0%, PQ=0.936;
dominant: I2=0.0%, PQ=1.000; recessive: I 2
=40.7%,
PQ=0.119; heterozygote: I2=0.0%, PQ=0.935;
homozygote: I2=31.9%, PQ=0.184). And summary ORs
and 95%CI were not significantly influenced (allel:
OR=0.987, 95%CI=0.879-1.109, p=0.827; dominant:
OR=0.999, 95%CI=0.871-1.146, p=0.987; recessive:
OR=0.920, 95%CI=0.678-1.248, p=0.590;
heterozygote: OR=1.015, 95%CI=0.879-1.173,
p=0.834; homozygote: OR=0.919, 95%CI=0.673-1.255,
p=0.594). The results indicated that the Imboden M11 publication was the major source of the heterogeneity in the meta-analysis.
Sensitivity Analysis
Sensitivity analysis was performed by sequentially deleting one study at a time. For each polymorphism, the significance of pooled ORs were not fundamentally altered under allele and different comparison genetic models (data not shown) that indicated our meta-analysis results were statistically reliable.
Publication Bias
Begg’s funnel plot and Egger’s test were used to estimate the publication bias. The shapes of the Begg’s funnel plot did not indicate any evidence of obvious asymmetry under different genetic models. We did not find obvious publication bias for any of the polymorphisms under different genetic models
(A-607C, Egger’s test p≥0.806; G-137C, Egger’s test
p≥0.662; A-105C, Egger’s test p≥0.176).
DISCUSSION
I L-18 is a unique cytokine that enhances innate immunity and both Th1 and Th2 driven immune
responses.17 In human beings, the secretion of IL-18 by
peripheral blood mononuclear cells and level of serum
IL-18 were increased in asthma.31,32 So far, the
polymorphisms of IL-18 genetic susceptibility to asthma have been widely studied, but the results were not consistent. Therefore, we performed a meta-analysis to clarify the relationship between the three polymorphisms (-607A/C, -137G/C, -105A/C) and susceptibility to asthma.
In current meta-analysis, we did not find a genetic association between the polymorphisms (607A/C, -137G/C, -105A/C) and asthma risk in overall populations. Interestingly, for -607A/C polymorphism, our result was inconsistent with Ma and colleagues’ meta-analysis,19 it might be that we added three studies which might have effectively altered the overall results. But for -137G/C polymorphism, our result was consistent with Ma and colleagues’ meta-analysis19,
three case-control studies were added, which have no effect on the result. For -105A/C polymorphism, as we have seen, this study was the first comprehensive meta-analysis to evaluate the relationship with asthma susceptibility. Perhaps, the results showed that the three polymorphisms were of no role in asthma risk was premature due to limited number of studies included in this study.
Heterogeneity is a crucial issue when conducting a meta-analysis. There existed significant heterogeneity in dominant and heterozygote genetic models comparisons in A-607C polymorphism. We failed to find any characteristics that could explain the heterogeneity using the meta-regression analysis. Subgroup analysis revealed that no asian, PCR-RFLP and small sample size might be the sources of heterogeneity. The galbraith plots showed that the Lachheb J10 and Shaaban HH17 were the outlier studies, which were in accordance with subgroup analysis belong the no asian, PCR-RFLP and small sample size publications. The heterogeneity was greatly dropped under allele and different comparison genetic models by omitting these two literatures, and summary ORs and 95%CI were not significantly influenced. In addition, the results indicated that the study of Lachheb
J10 and Shaaban HH17 were the sources of
heterogeneity. For -137G/C polymorphism, significant heterogeneity was found in the recessive genetic models. We failed to find any characteristics that could explain the heterogeneity using the meta-regression analysis. Subgroup analysis and galbraith plots showed
that the Imboden M11 maybe the source of
heterogeneity. The heterogeneity was greatly dropped under allele and different comparison genetic models by omitting the literature, and summary ORs and 95%CI were not significantly influenced. So, we think
the study of Imboden M11 was the source of
heterogeneity.
showed that the current meta-analysis results were stable and reliable.
There were some limitations to this meta-analysis need to be taken into account when interpreting the results. First, in this meta-analysis, all eligible studies were published in English and Chinese indexed by the selected databases, the lack of data published in other languages might contribute to some publication bias. Second, The ethnicity of studies (A-607C: African, Caucasian, Asian; G-137C: Caucasian, Asian; A-105C: Asian) were too limited to be extended to all races. Third, we excluded some studies that cannot acquire genotype numbers or frequencies from the original studies, which may result in a selection bias. Fourth, asthma is a complex disease, we studied only three polymorphisms of one gene. But we did not conduct the gene-gene and gene-environment interactions analysis because of the unavailability of raw data from the original studies. Finally, elimination of these studies which the genetic distributions of the controls in some studies were deviated from the HWE from analysis did not influence the meta-analysis results significantly. So, we did not exclude these studies from our analysis. Due to these limitations, the results of this meta-analysis should be further verified by prospective trials or full-gene sequencing of random, multicenter, and large samples.
This meta-analysis suggests that the IL-18 gene polymorphisms (A-607C, G-137C and A-105C) may not contribute to asthma susceptibility.
ACKNOWLEDGEMENTS
This project supported by National Natural Science Foundation of China, No.81400966; Scientific research fund of Sichuan Provincial Education Department, No. 14ZA0191 and 15ZA0209; and Research and development program project of North Sichuan Medical College, No.CBY-A-YB09
REFERENCES
1. Zhen Che, Xiaoxia Zhu, Cijiang Yao, Ying Liu, Yanyan
Chen, Jiyu Cao, et al .The association between the C-509T and T869C polymorphisms of TGF-b1 gene and the risk of asthma: A meta-analysis. Hum Immunol 2014, 75(2):141-50.
2. Holgate ST, Davies DE, Powell RM, Howarth PH,
Haitchi HM, Holloway JW. Local genetic and
environmental factors in asthma disease pathogenesis: chronicity and persistence mechanisms. Eur Respir J 2007; 29(4):793-803.
3. Vercelli D. Discovering susceptibility genes for asthma
and allergy. Nat Rev Immunol .2008, 8:169-182.
4. Tattersfield AE, Knox AJ, Britton JR , Hall IP. Asthma.
Lancet 2002; 360(9342):1313-22.
5. Huang XZ, Zhuang JH, Ren YG, Zhou LJ, Zhou Q.
Association of interleukin-6 and interleukin-18 gene polymorphism with rheumatoid arthritis in Guangdong Han population. Nan Fang Yi Ke Da Xue Xue Bao 2007; 27(11):1661-4.
6. Pawlik A, Kaminski M, Kuśnierczyk P, Kurzawski M,
Dziedziejko V, Adamska M, et al. Interleukin-18 promoter polymorphism in patients with atopic asthma. Tissue Antigens 2007; 70(4):314-8.
7. Nakamura K, Okamura H, Wada M, Nagata K, Tamura
T. Endotoxin- induced serum factor that stimulates gamma interferon production. Infect Immun 1989; 57(2):590-5.
8. Chang JT, Segal BM, Nakanishi K, Okamura H, Shevach
EM. The costimulatory effect of IL-18 on the induction of antigen-specific IFN-gamma production by resting T cells is IL-12 dependent and is mediated by up-regulation of the IL-12 receptor beta2 subunit. Eur J Immunol 2000; 30(4):1113-9.
9. Blumenthal MN, Langefeld CD, Beaty TH, Bleecker ER,
Ober C, Lester L, et al. A genome-wide search for allergic response (atopy) genes in three ethnic groups: Collaborative Study on the Genetics of Asthma. Hum Genet 2003; 114(2):157–64.
10.Lachheb J, Chelbi H, Ammar J, Hamzaoui K, Hamzaoui
A. Promoter polymorphism of the IL-18 gene is associated with atopic asthma in Tunisian children. Int J Immunogenet 2008; 35(1):63-68.
11.Imboden M, Nicod L, Nieters A, Glaus E, Matyas G,
Bircher AJ, et al.The common G-allele of interleukin-18 single-nucleotide polymorphism is a genetic risk factor for atopic asthma. The SAPALDIA Cohort Study. Clin Exp Allergy 2006; 36(2):211-8.
12.Birbian N, Singh J, Jindal SK. Protective role of IL18
-137G/C polymorphism in a North Indian population with asthma: a pilot study. Cytokine 2013; 61(1):188-93.
13.Wu SQ, Liang W, Wang GL, Li LY, Wang DL, Chen C.
Polymorphisms of the IL-18 promoter and bronchial asthma. Mol Med Rep 2012; 6(6):1385-8.
14.Lee CC, Lin WY, Wan L, Tsai Y, Tsai CH, Huang CM,
22(1):39-44.
15.Shin HD, Kim LH, Park BL, Choi YH, Park HS, Hong
SJ, et al. Association of interleukin 18 (IL18) polymorphisms with specific IgE levels to mite allergens among asthmatic patients. Allergy 2005; 60(7):900-6.
16.Heinzmann A, Gerhold K, Ganter K, Kurz T,
Schuchmann L, Keitzer R, et al. Association study of
polymorphisms within interleukin-18 in juvenile
idiopathic arthritis and bronchial asthma. Allergy 2004 59(8):845-9.
17.Shaaban HH, Mohy AM, Abdel-Razek AR, Wahab AA.
Interleukin-18 -607C/A gene polymorphism in Egyptian asthmatic children. Mol Diagn Ther 2014; 18(4):427-34.
18.Yi Jingping, CHEN Xiaowen, LI Jianchun,Deng qiong,
Association study of interleukin-18 gene polymorphisms and asthma in Jiangxi province. Experimental and Laboratory Medicine 2013, 31(4):309-310.
19.Ying Ma, Bo Zhang, Ren-Kuan Tang, Yun Liu,
Guo-Guang Peng. Interleukin-18 promoter polymorphism and asthma risk: a meta-analysis. Mol Biol Rep 2012; 39(2):1371-6.
20.Harada M, Obara K, Hirota T, Yoshimoto T, Hitomi Y,
Sakashita Met al. A functional polymorphism in IL-18 is associated with severity of bronchial asthma. Am J Respir Crit Care Med 2009; 180(11):1048-55.
21.Higa S, Hirano T, Mayumi M, Hiraoka M, Ohshima Y,
Nambu M, et al. Association between interleukin-18 gene polymorphism 105A/C and asthma. Clin Exp Allergy 2003; 33(8):1097-1102.
22.Aker S, Bantis C, Reis P, Kuhr N, Schwandt C,
Grabensee B, et al. Influence of interleukin-6 G-174C gene polymorphism on coronary artery disease, cardiovascular complications and mortality in dialysis patients. Nephrol Dial Transplant 2009; 24(9):2847-2851.
23.Ma Y, Tang RK, Yang X, Peng GG, Liu Y, Wang XM, et
al. Lack of an association between interleukin-6 gene promoter polymorphisms (-174G/C, -572G/C) and ischemic heart disease and/or ischemic stroke: a meta-analysis. Hum Immunol 2011; 72(8):641-51.
24.Thakkinstian A, McEvoy M, Minelli C, Gibson P,
Hancox B, Duffy D, et al. Systematic review and meta-analysis of the association between {beta}2-adrenoceptor polymorphisms and asthma: a HuGE review. Am J Epidemiol 2005; 162(3):201-11.
25.Higgins JP, Thompson SG. Quantifying heterogeneity in
a meta-analysis. Stat Med 2002; 21(11):1539-58.
26.Higgins JP, Thompson SG, Deeks JJ, Altman DG.
Measuring inconsistency in meta-analyses. BMJ 2003,
327(7414):557-60.
27.Mantel N, Haenszel W. Statistical aspects of the analysis
of data from retrospective studies of disease. J Natl Cancer Inst 1959; 22(4):719-48.
28.Dersimonian R, Laird N. Meta-analysis in clinical trials.
Control Clin Trials. 1986; 7(3):177-86.
29.Egger M, Davey Smith G, Schneider M, Minder C. Bias
in meta-analysis detected by a simple, graphical test. BMJ 1997; 315(7109):629-34.
30.Begg CB, Mazumdar M. Operating characteristics of a
rank correlation test for publication bias. Biometrics 1994; 50(4):1088-101.
31.Tanaka H, Miyazaki N, Oashi K, Teramoto S, Shiratori
M, Hashimoto M, et al. IL-18 might reflect disease activity in mild and moderate asthma exacerbation. J Allergy Clin Immunol 2001; 107(2):331-336.
32.El-Mezzein RE, Matsumoto T, Nomiyama H, Miike T.