Sri Krishna International Research & Educational Consortium
The Journal of Sri Krishna Research & Educational Consortium
J O U R N A L O N B A N K I N G
F I N A N C I A L S E R V I C E S &
I N S U R A N C E R E S E A R C H
Internationally Indexed & Listed Referred e-Journal
PERFORMANCE MEASUREMENT
USING THE FRONTIER EFFICIENCY METHODOLOGY: A STUDY
OF INDIAN GENERAL INSURANCE SECTOR
DR. SUMNINDER KAUR BAWA*; NAVJEET KAUR**
*Assistant Professor, Department of Commerce and Business Management, Guru Nanak Dev University, Amritsar, Punjab.
**Research Fellow, Department of Commerce and Business Management, Guru Nanak Dev University, Amritsar, Punjab.
ABSTRACT
The wind of Liberalization, Globalization & Privatization has opened new vistas in the Indian insurance industry in the generation of intensely competitive environment. The present study compares 10 Indian General Companies comprising of 4 Public Sector Companies and 6 Private Sector Companies from the year 2002-03 to 2009-10 using the Data Envelopment Analysis for computing the Technical Efficiency, Pure Technical Efficiency and Scale Efficiency. The article uses the Claims incurred as the output and the Investment income as well as the Net premium income as the inputs to arrive at the efficiency level of both the sectors. It has been observed that among the public sector insurers National Insurance Company has been the most efficient company and New India Assurance Company has been the most inefficient company in most of the years under reference , whereas the private insurers have been depicting the increasing returns to scale over the years which has been a sign of the emergence of healthy competition in the Indian General Insurance market except the Bajaj General Insurance Company and ICICI General Insurance Company. It has also been reported that the overall technical efficiency results of general insurers have been showing an improvement over the period. On the other hand the sector wise performance analysis states that though the technical efficiency of the public sector insurers i.e.96 % has been more than that of the private sector companies i.e. 89 %., the improvement space and direction of the private sector has been reducing over the years.
KEYWORDS: Data Envelopment Analysis, Globalization, Liberalization,
Nationalization, Pure Technical Efficiency, Scale Efficiency, Technical Efficiency. ___________________________________________________________________________
INTRODUCTION
Human beings face lots of risks in their daily lives. Some of these lead to financial losses. Human don’t have any command on uncertainties and risk, it is in this context that they think about insurance. Insurance is a way of protecting against these financial losses. In the Dictionary of Business and Finance, Insurance is stated to mean, “a form of contract or agreement under which one party agrees in return for a consideration to pay an agreed amount of money to another party to make good for a loss, damage, or injury to something of value in which the insured has a pecuniary interest as a result of some uncertain event”. Insurance may be defined in broad terms as method of sharing of financial losses of a few, from a common fund formed out of contribution of the many, who are exposed to the same loss.
The insurance sector is one of the significant components in the financial sector. Insurance provides financial confidence and courage to face risks by the individuals and organizations through loss mitigation, thereby enabling to carry out commerce and entrepreneurial activities (Garg and Deepti) .The insurance industry as a financial service is considered as one of the important segment in an economy for its growth and development. This industry provides long term funds for the development of basic infrastructure. Not only does it serve the end of individuals, or of special group of individuals, it tends to pervade and to transform our modern society (Singh and Kumar). Insurance sector has emerged as most prominent sector in the financial sector services during the recent times particularly in the developing economies like India. The importance of insurance in the economic activities has been recognized for many years. In 1964, United Nations Conference on Trade Development (UNICTAD) pronounced”……..a sound national insurance and reinsurance market is an essential characteristic of economic growth” (Das).
The Indian Insurance Industry can be segmented into two markets:
Life insurance
General insurance
Insurance other than “Life Insurance” falls under the category of General Insurance. Sec2 (6b) of the Insurance Act 1938, defines General Insurance business. According to this “General Insurance business means fire, marine or miscellaneous Insurance whether carried separately or in combination”. The term General Insurance is used in Britain & other Commonwealth countries, elsewhere the equivalent term is Property-Casualty Insurance or Non-life Insurance.
ORGANIZATION OF THE STUDY
Sri Krishna International Research & Educational Consortium
SECTION 1
A.)HISTORICAL BACKGROUND OF GENERAL INSURANCE IN INDIA:
General insurance would appear to have developed with the industrial revolution in the west and consequent growth of seafaring trade and commerce in the 17th Century. It came to India from UK. In India, the General Insurance Business was transacted by British and other foreign insurance companies through their agencies. The first general insurance company viz, Triton Insurance Company Ltd, was established in Calcutta in 1850 whose shares were held mainly by the British. The important milestones in the General Insurance Business in India are:
TABLE NO 1 DEPICTING THE MILESTONES IN INDIAN GENERAL INSURANCE SECTOR OVER THE YEARS
Years Milestones
1907 The Indian Mercantile Insurance Limited set up, the first company to transact all classes of general insurance business.
1972 The general insurance business (nationalization) Act, 1972 nationalized the general insurance business in India.
1991 Beginning of economic liberalization.
1993 Detarrification of aviation, liability, personal accidents and health and Marine cargo.
1994 Detarrification of aviation, liability, personal accidents and health and Marine cargo.
1999 Insurance Regulatory and Development Authority (IRDA) bill passed in
Parliament.
2000 IRDA incorporated as statutory body to regulate and register private sector
insurance companies.
2005 De-tarrification of marine hull.
2007 De-tarrification of all general insurance products except of the auto third party liability segment.
(Source: Ernest and Young, 2008; Kannan and Thangavel, 2008)
Among the above mentioned milestones the prominent one which changed the Indian general insurance scenario are discussed as:
1972: NATIONALIZATION OF GENERAL INSURANCE BUSINESS: Keeping in view
National Insurance Company Ltd (NIC)- headquarter at Kolkata
Oriental Insurance Company Ltd (OIC)-headquarter at New Delhi
United India Insurance Company Ltd (UIIC)-headquarter at Chennai
New India Assurance Company Ltd (NIAC)-headquarter at Mumbai
With the General Insurance Corporation of India as the holding company.
1999: CREATION OF INSURANCE REGULATORY AND DEVELOPMENT
AUTHORITY: In Dec 1999 an Act (IRDA) was passed by the Parliament which received
presidential assent in Jan 2000.This Act provides for the establishment of the authority to
a. Protect the interest of the holders of insurance policies.
b. Regulate, promote and ensure orderly growth of insurance industry and for matters connected therewith or incidental thereto.
2000: LIBERALIZATION OF GENERAL INSURANCE SECTOR: General insurance
sector was opened for private insurers also. With the privatization of insurance sector and with the entrance of many players, the world of insurance served to have a cut throat competition with the private sector gaining an ever increasing edge over the public sector. After the nationalization (1972) and privatization (2000), there are 24 General Insurance Companies currently operating in India.
B.)CURRENT SCENARIO OF INDIAN NON-LIFE INSURANCE: AN INSTANT LOOK
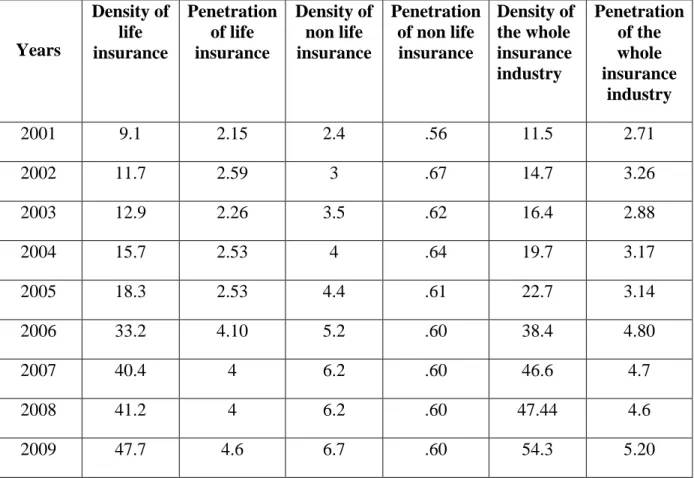
The opening up of insurance sector for competition offers ample opportunities to both existing as well as new players to penetrate into untapped areas and unexploited segments of population as presently both insurance density and penetration are at low level. The private players from India and abroad are well aware that very less portion of population has been covered by existing insurance companies which states that Indian insurance market has enough potential to exploit. The growing numbers of general insurance players have been depicted as:
TABLE NO. 2 DEPICTING THE INCREASE IN THE NUMBER OF BOTH PRIVATE AND PUBLIC COMPANIES
Year
Sector
2000 2001 2002 2003 2004 2005 2006 2007 2008 2009 2010
Private 3 6 8 8 8 8 9 10 15 15 18
Public 4 4 5 6 6 6 6 6 6 6 6
Sri Krishna International Research & Educational Consortium
The insurance sector India has come to a full circle from being an open competitive market to nationalization and back to a liberalized market again. Indian insurance industry has moved into a competitive environment with the arrival of private players in the market. The wind of Liberalization, Globalization & Privatization has opened new doors in the insurance industry in the generation of healthy competitive environment. Indian insurance business, which remained under developed with low levels of insurance penetration and insurance density has somewhat shown signs of improvement as compared to the previous years.
TABLE NO.3 SHOWS INSURANCE PENETRATION AND DENSITY IN INDIA OVER VARIOUS TIME PERIODS
Years Density of life insurance Penetration of life insurance Density of non life insurance Penetration of non life insurance Density of the whole insurance industry Penetration of the whole insurance industry
2001 9.1 2.15 2.4 .56 11.5 2.71
2002 11.7 2.59 3 .67 14.7 3.26
2003 12.9 2.26 3.5 .62 16.4 2.88
2004 15.7 2.53 4 .64 19.7 3.17
2005 18.3 2.53 4.4 .61 22.7 3.14
2006 33.2 4.10 5.2 .60 38.4 4.80
2007 40.4 4 6.2 .60 46.6 4.7
2008 41.2 4 6.2 .60 47.44 4.6
2009 47.7 4.6 6.7 .60 54.3 5.20
(Source: Swiss Re, Various Issues)
Insurance density is measured as ratio of premium (in US $) to total population.
Insurance penetration is measured as ratio of premium (in US $) to GDP (in US $).
SECTION 2: REVIEW OF LITERATURE
Various studies directly as well as indirectly related to the objectives have been reviewed. Some of these are as:
Sri Krishna International Research & Educational Consortium
companies of Iran. The results indicated significant difference in average Technical efficiency, Allocation and Economic efficiency of public and private insurance companies.
OBJECTIVES OF THE STUDY
The main objectives on which the study focuses upon are as follows:
1. To analyze the efficiency of general insurance companies.
2. To determine the improvement direction and improvement space for both public and private general insurers.
SECTION 3: RESEARCH METHODOLOGY ADOPTED
There are various methods to evaluate the efficiency of service sectors. Most commonly the method suitable for handling the issues and approaches involved with the service sector and also for the analysis of efficiency of this particular sector has been the Data Envelopment Analysis. Data Envelopment Analysis is a multi-factor productivity analysis model for measuring the relative efficiency of a homogeneous set of Decision Making Units (DMUs). The efficiency score in the presence of multiple input and output is defined as
Efficiency=Weighted Sum of Outputs/Weighted Sum of Inputs
DEA is a mathematical programming based technique to evaluate the relative performance of organizations. DEA makes it possible to identify efficient and inefficient units in a framework where results are considered in their particular context. In addition DEA also provides information that enables the comparison of each inefficient unit with its “peer group”, that is a group of inefficient units that are identical with the units under analysis. DEA gives weight of inputs and outputs leading to the calculated efficiency. The unit is efficient if the efficiency is equal to 1 and inefficient if it is less than 1. If represented graphically, for a given set of units, the efficient DMUs from the frontier that encloses the inefficient ones. Hence the name of the analysis is Data Envelopment Analysis. Thus the efficient units use its mix of inputs better than inefficient ones or the efficient units manage to produce more outputs using a given mix of inputs. An input oriented measure quantifies the input reduction, which is necessary for a DMU to become efficient, holding the output constant. Similarly an output oriented measure quantifies the necessary output expansion holding the input constant.
There have been a great variety of applications of DEA for use in evaluating the performances of many different kinds of entities engaged in many different activities in many different nations. These DEA applications have used DMUs of various forms to evaluate the performance of entities such as Hospitals, US Air force wings, Universities, Cities, Courts, Business firms and others, including the performance of countries, regions etc. A DMU is regarded as the entity responsible for converting inputs (resources, money etc) into outputs (sales, profits, certain performance measures etc) and whose performance is to be evaluated. In this study, a DMU refers to a General Insurance Company.
DEA is relative to the best performing DMU or DMUs. The most efficient DMU is assigned as efficiency score of unity or 100% and the performance of other DMUs vary between 0 and 100% relative to the best performance. The Initial DEA model, as originally presented in Charnes, Cooper and Rhodes {CCR} in 1978 was built on the earlier work of Farrel (1957).
In this paper efficiency is defined in terms of technical efficiency. Further only the measurement of technical efficiency is not enough, so measures of the technical efficiency both with Constant Returns to Scale (CRS) as well as with Variable Returns to Scale (VRS) have been used. The technical efficiency which is measured with VRS is also known as Pure Technical Efficiency. Besides this, scale efficiency has also been calculated for all the selected firms during the period under study.
PURE TECHNICAL EFFICIENCY: In pure technical efficiency, production line with
variable return to scale is used. From the view point of economics, this will release the restrictions of scale. Therefore, the inefficiency only lies in the factors such as productivity, resource allocation and management.
SCALE EFFICIENCY: In contrary to the case of pure technical efficiency, only the factor
of scale is effective here, while the factors of productivity, resource allocation and management are excluded. Scale Efficiency is measured by dividing Technical Efficiency with the Pure Technical Efficiency.
TECHNICAL EFFICIENCY: Technical efficiency can be regarded as the product of pure
technical efficiency and scale efficiency. It reflect the ability of the firm to obtain the maximum output from a given set of input or the efficiency with which inputs are transformed into output or just the output/input ratio.
DATABASE OF THE RESEARCH:
The present study is covering a period of 8 years from 2002-03 to 2009-2010. The base year is taken as 2002 i.e. the companies which are in General Insurance business since 2002 are forming a part of the study. The basic reason behind the selection of base year as 2002 lies in the fact that, this is the exclusive year in which maximum numbers of general insurance companies are operating in insurance industry. The 10 companies under the scope of study include Tata AIG General Insurance Company Limited, IFFCO Tokio General Insurance Company Limited, Reliance General Insurance Company Limited, Royal Sundram Alliance Insurance Company Limited, Bajaj Allianz General Insurance Company Limited, ICICI Lombard General Insurance Company Limited, United India Insurance company limited, Oriental Insurance Company Limited, New India Assurance Company Limited and National Insurance Company Limited. The study is completely based upon secondary data, which is mainly collected from the statistical year book of IRDA, annual reports of IRDA and other publication related with the insurance were used for the collection of certain facts and figures necessary for the achievement of the said objectives.
THE MODEL OF THE RESEARCH:
Sri Krishna International Research & Educational Consortium
MODEL VARIABLES: The model of this article includes two inputs and one output of
General Insurance Companies. On the basis of the literature the inputs and outputs have been taken. These inputs and outputs have been described and expressed as:
THE INPUTS
Net Premium Income (X1): We have taken net premium income as the first indicator of input.
Investment Income (X2): The second input taken has been the investment income as the second indicator of input.
THE OUTPUT
Claim incurred is one of the important financial indicator of any insurance company which directly affects the profitability position of the particular company. The efficiency of the insurance company lies in the fact as how well it is able to manage the claims out of its two major sources of earnings: investment income and the net premium income.
Finally, we have selected two indicator of input as net premium income and investment income; and one indicator of output as claims incurred, which is also in accordance with the assumption of DEA, that the number of Decisions Making Units should be three time of number of inputs and outputs. The approach used has been input oriented VRS model to calculate TE, PTE and SE. The main concern of the approach has been to produce the same level of output using the lesser inputs i.e. to reduce the wastages of the inputs if any.
EMPIRICAL ANALYSIS
A. COMPANY WISE ANALYSIS: An attempt has been made to find out individually
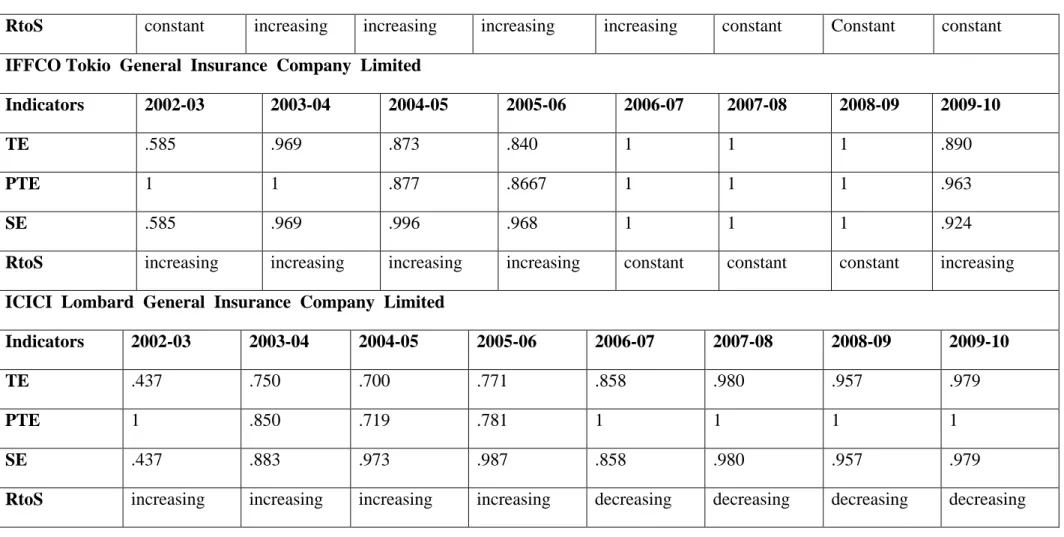
TABLE NO 4 EXAMINES THE COMPANY WISE ANALYSIS
New India Assurance Company Limited
Indicators 2002-03 2003-04 2004-05 2005-06 2006-07 2007-08 2008-09 2009-10
TE .958 .880 .860 .728 .908 .940 .901 1
PTE 1 1 1 1 1 1 1 1
SE .958 .880 .860 .728 .908 .940 .901 1
RtoS decreasing decreasing decreasing decreasing decreasing decreasing decreasing constant
Oriental Insurance Company Limited
Indicators 2002-03 2003-04 2004-05 2005-06 2006-07 2007-08 2008-09 2009-10
TE .952 .912 .938 .669 .975 1 1 .969
PTE .957 .912 .938 .672 .976 1 1 1
SE .995 .999 1 .995 .999 1 1 .969
RtoS decreasing constant constant increasing decreasing constant constant decreasing
National Insurance Company Limited
Indicators 2002-03 2003-04 2004-05 2005-06 2006-07 2007-08 2008-09 2009-10
PTE 1 1 1 1 1 1 1 .959
SE .992 1 1 1 1 1 1 .997
RtoS decreasing constant constant constant constant constant constant increasing
United India Insurance Company Limited
Indicators 2002-03 2003-04 2004-05 2005-06 2006-07 2007-08 2008-09 2009-10
TE 1 1 1 .743 1 .962 .758 .929
PTE 1 1 1 .747 1 .965 .768 .934
SE 1 1 1 .995 1 .997 .987 .995
RtoS constant constant constant increasing constant increasing increasing increasing
Royal Sundram Alliance General Insurance Company Limited
Indicators 2002-03 2003-04 2004-05 2005-06 2006-07 2007-08 2008-09 2009-10
TE .785 1 1 .906 .888 .888 .794 .811
PTE .959 1 1 1 1 1 1 1
SE .819 1 1 .906 .888 .888 .794 .811
RtoS increasing constant constant increasing increasing increasing increasing increasing
Indicators 2002-03 2003-04 2004-05 2005-06 2006-07 2007-08 2008-09 2009-10
TE 1 .983 .810 1 .895 .783 .880 .846
PTE 1 1 1 1 .977 .841 1 1
SE 1 .983 .810 1 .916 .930 .880 .846
RtoS constant decreasing decreasing constant decreasing decreasing decreasing decreasing
TATA AIG General Insurance Company Limited
Indicators 2002-03 2003-04 2004-05 2005-06 2006-07 2007-08 2008-09 2009-10
TE .786 .801 .795 .719 .781 .709 .769 .819
PTE 1 .808 .804 .775 .945 1 1 1
SE .786 .992 .988 .928 .827 .709 .769 .819
RtoS increasing increasing increasing increasing increasing increasing increasing increasing
Reliance General Insurance Company Limited
Indicators 2002-03 2003-04 2004-05 2005-06 2006-07 2007-08 2008-09 2009-10
TE 1 .803 .796 .657 .776 1 1 1
PTE 1 1 1 1 1 1 1 1
RtoS constant increasing increasing increasing increasing constant Constant constant
IFFCO Tokio General Insurance Company Limited
Indicators 2002-03 2003-04 2004-05 2005-06 2006-07 2007-08 2008-09 2009-10
TE .585 .969 .873 .840 1 1 1 .890
PTE 1 1 .877 .8667 1 1 1 .963
SE .585 .969 .996 .968 1 1 1 .924
RtoS increasing increasing increasing increasing constant constant constant increasing
ICICI Lombard General Insurance Company Limited
Indicators 2002-03 2003-04 2004-05 2005-06 2006-07 2007-08 2008-09 2009-10
TE .437 .750 .700 .771 .858 .980 .957 .979
PTE 1 .850 .719 .781 1 1 1 1
SE .437 .883 .973 .987 .858 .980 .957 .979
RtoS increasing increasing increasing increasing decreasing decreasing decreasing decreasing
are showing the decreasing returns to scales since the last four years. Among the private sector insurers Reliance General Insurance Company has been the most efficient as it is either been experiencing the constant returns or increasing returns to scale during the study period.
B. YEAR WISE ANALYSIS
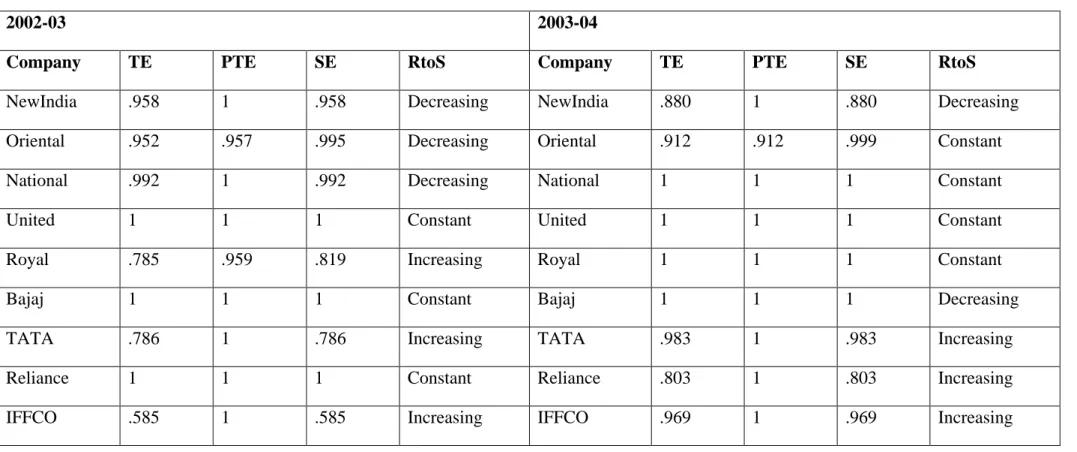
This has been done to find out the year wise efficiencies of various companies under consideration i.e. the effort has been made to find out the year in which the maximum numbers of companies lie on the frontier with efficiency score equal to 1 or no one company lie on the frontier.
TABLE NO.5 PRESENTS THE YEAR WISE ANALYSIS
2002-03 2003-04
Company TE PTE SE RtoS Company TE PTE SE RtoS
NewIndia .958 1 .958 Decreasing NewIndia .880 1 .880 Decreasing
Oriental .952 .957 .995 Decreasing Oriental .912 .912 .999 Constant
National .992 1 .992 Decreasing National 1 1 1 Constant
United 1 1 1 Constant United 1 1 1 Constant
Royal .785 .959 .819 Increasing Royal 1 1 1 Constant
Bajaj 1 1 1 Constant Bajaj 1 1 1 Decreasing
TATA .786 1 .786 Increasing TATA .983 1 .983 Increasing
Reliance 1 1 1 Constant Reliance .803 1 .803 Increasing
ICICI .437 1 .437 Increasing ICICI .750 .850 .883 Increasing
2004-05 2005-06
Company TE PTE SE RtoS Company TE PTE SE RtoS
NewIndia .860 1 .860 Decreasing NewIndia .728 1 .728 Decreasing
Oriental .938 .938 1 Constant Oriental .669 .672 .995 Increasing
National 1 1 1 Constant National 1 1 1 Constant
United 1 1 1 Constant United .743 .747 .995 Increasing
Royal 1 1 1 Constant Royal .906 1 .906 Increasing
Bajaj .810 1 .810 Decreasing Bajaj 1 1 1 Constant
TATA .795 .804 .988 Increasing TATA .719 .775 .928 Increasing
Reliance .796 1 .796 Increasing Reliance .657 1 .657 Increasing
IFFCO .873 .877 .996 Increasing IFFCO .840 .867 .968 Increasing
ICICI .700 .719 .973 Increasing ICICI .771 .781 .987 Increasing
2006-07 2007-08
Company TE PTE SE RtoS Company TE PTE SE RtoS
Oriental .975 .976 .999 Decreasing Oriental 1 1 1 Constant
National 1 1 1 Constant National 1 1 1 Constant
United 1 1 1 Constant United .962 .965 .997 Increasing
Royal .888 1 .888 Increasing Royal .888 1 .888 Increasing
Bajaj .895 .977 .916 Decreasing Bajaj .783 .841 .930 Decreasing
TATA .781 .945 .827 Increasing TATA .709 1 .709 Increasing
Reliance .776 1 .776 Increasing Reliance 1 1 1 Constant
IFFCO 1 1 1 Constant IFFCO 1 1 1 Constant
ICICI .858 1 .858 Decreasing ICICI .980 1 .980 Decreasing
2008-09 2009-10
Company TE PTE SE RtoS Company TE PTE SE RtoS
NewIndia .901 1 .901 Decreasing NewIndia 1 1 1 Constant
Oriental 1 1 1 Constant Oriental .969 1 .969 Decreasing
National 1 1 1 Constant National .956 .959 .997 Increasing
United .758 .768 .987 Increasing United .929 .934 .995 Increasing
Bajaj .880 1 .880 Decreasing Bajaj .846 1 .846 Decreasing
TATA .769 1 .769 Increasing TATA .819 1 .819 Increasing
Reliance 1 1 1 Constant Reliance 1 1 1 Constant
IFFCO 1 1 1 Constant IFFCO .890 .963 .924 Increasing
ICICI .957 1 .957 Decreasing ICICI .979 1 .979 Decreasing
Table No 5 reports that one or the two public sector general insurance companies have been on the frontier during all the years. National Insurance Company have been the most efficient firm among all as it has revealed the constant returns to scale in 6 years out of 8 years, followed by Oriental General Insurance Company and United General Insurance Company which have been the benchmarks in 4 years out of 8 years. It is worth noting that New India Assurance Company has been showing the decreasing returns to scale in 7 years out of 8 years. The results of the private sector states that Reliance General Insurance Company has been the most efficient among the private insurers as it has been on the frontier for 4 years out of 8 years, followed by IFFCO General Insurance Company, Bajaj General Insurance Company and Royal General Insurance Company who have joined the list of the bench markers for three, two and two years respectively during the study.
ANALYSIS OF MEAN OF TECHNICAL, PURE TECHNICAL AND SCALE EFFICIENCY
Analysis and interpretation of Mean of TE, PTE and SE
Sector Wise Overall
The analysis under this group has been done in two ways:
Sector Wise Analysis
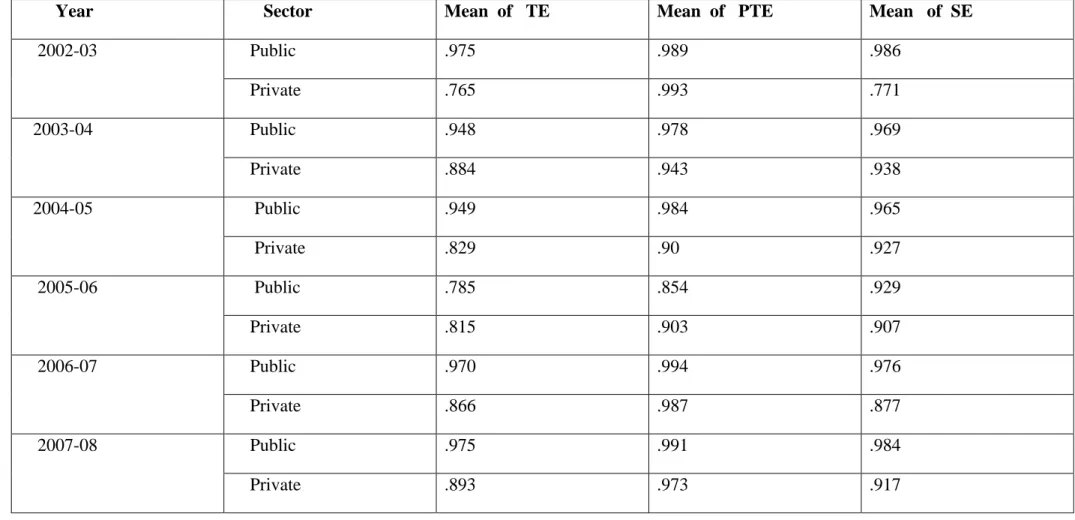
SECTOR WISE ANALYSIS: According to the background of the insurers in India it can be separated in two groups: 1) Public Sector Insurers; 2) Private Sector Insurers. In the sector wise analysis efforts has been made to evaluate the mean of technical efficiency, pure technical efficiency and scale efficiency of public sector as well as of private sector for the period under consideration.
TABLE NO. 6 ANALYZES THE SECTOR WISE EFFICIENCY OF THE INSURERS
Year Sector Mean of TE Mean of PTE Mean of SE
2002-03 Public .975 .989 .986
Private .765 .993 .771
2003-04 Public .948 .978 .969
Private .884 .943 .938
2004-05 Public .949 .984 .965
Private .829 .90 .927
2005-06 Public .785 .854 .929
Private .815 .903 .907
2006-07 Public .970 .994 .976
Private .866 .987 .877
2007-08 Public .975 .991 .984
2008-09 Public .914 .942 .972
Private .90 1 .90
2009-10 Public .963 .973 .990
Private .890 .993 .896
Table No. 6 deals with the mean TE, mean PTE and mean SE. The mean TE of public sector has been showing the falling trends till 2005-06, which reached to .975 in 2007-08 and finally it has been recorded at .963 in 2009-10. The mean TE of private sector has been .765 in 2002-03 and has reached at .890 in 2009-10, which depicts the increasing trends. The mean of PTE of public sector has been .989 in 2002-03 and has reduced to .973 in 2009-10. Analyzing the mean PTE of private sector it could be said that the mean of PTE of this very sector has been .993 in 2002-03, shown the mixed trends in the mean time and again reached at the same level in 2009-10. The analyses of SE has been depicting mixed trends and finally marked at the increased value of .990 in 2009-10 as compared to the base year. The private sector has also been showing the mixed trends and it has increased over the years compared to the base year. From the above table it could be concluded that the public sector general insurers should give more attention on the improvement in all the of the efficiencies because due to the increased competition their position is gradually taken by the private sector, which should be taken as an alarming sign by the public sector and should pay more emphasis on being productive and profitable by reducing the wastages.
OVERALL ANALYSIS: The overall analysis of the insurers (including both private and public) would depict the overall picture of the general
insurance industry as a whole.
TABLE NO.7 DEALS WITH THE OVERALL ANALYSIS OF THE INSURERS
Years Insurers Mean of TE Mean of PTE Mean of SE
2002-03 All Insurers .850 .992 .857
2004-05 All Insurers .877 .934 .942
2005-06 All Insurers .803 .884 .917
2006-07 All Insurers .908 .990 .917
2007-08 All Insurers .926 .981 .944
2008-09 All Insurers .906 .977 .929
2009-10 All Insurers .920 .986 .934
Table No.7 presents the analysis of the efficiency of the insurers as the whole industry. The overall mean of the TE has been revealing the mixed trends whereas comparing the current year with the base year it has increased from .850 to .920. The mean of PTE shows that there has been a fall till 2005-06 and it increased later on and has been reported at .986 in the current year, whereas comparing it with the base year it could be said that it has decreased from .992 to .986. The result of the overall mean of the SE has been gradually increasing over the years and has reached to .943 in 2009-10 from .857 in 2002-03. Thus the insurers should give due consideration to avail the economies of PTE i.e. managerial efficiencies in order to cater the untapped potential by increasing the penetration level as it is much low as compared to the world.
SCOPE OF IMPROVEMENT SPACE AND IMPROVEMENT DIRECTION FOR GENERAL INSURERS:
TABLE NO 8 SHOWS THE IMPROVEMENT SPACE AND IMPROVEMENT DIRECTION (FIGURES IN %)
Companies 2002-03 2003-04 2004-05 2005-06 2006-07 2007-08 2008-09 2009-10
New India 4.2 12 14 27.2 9.2 6 9.9 0
Oriental 4.8 8.8 6.2 33.1 2.5 0 0 3.1
National 0.8 0 0 0 0 0 0 4.4
United 0 0 0 25.7 0 3.8 24.2 7.1
Royal 21.5 0 0 9.4 11.2 11.2 20.6 18.9
Bajaj 0 1.7 19 0 10.5 21.7 12 15.4
TATA 21.4 19.9 20.5 28.1 21.9 29.1 23.1 18.1
Reliance 0 19.7 20.4 34.3 22.4 0 0 0
IFFCO 41.5 3.1 12.7 16 0 0 0 11
ICICI 56.3 25 30 22.9 14.2 2 4.3 2.1
General Insurance Company it has been increasing comparing the base year with the latest year i.e. 2009-10 which gives them an indication that it should follow the philosophy and workings of the best practicing firms if it wants to remain in the market for the long run.
DESCRIPTIVE STATISTICS OF THE INPUTS AND OUTPUTS USED:
Table No 9-16 depicts the descriptive statistics of the inputs and outputs taken for the study from the year 2002-03 to 2009-10. The figures are in lakhs.
TABLE NO 9 SHOWS THE DESCRIPTIVE STATISTICS OF THE GENERAL INSURERS FOR THE YEAR 2002-03
Statistics Net Premium Income Claims Incurred Investment Income
Max 351641 269951 88106
Min 1927 1776 1278
Std Dev 127258.5 101876.7 33489.68
Average 101885.7 79819.4 26318.2
TABLE NO 10 SHOWS THE DESCRIPTIVE STATISTICS OF THE GENERAL INSURERS FOR THE YEAR 2003-04
Statistics Net Premium Income Claims Incurred Investment Income
Max 363495 271358 126679
Min 3454 2374 1502
Std Dev 132386.5 106097.5 50271.17
TABLE NO 11 SHOWS THE DESCRIPTIVE STATISTICS OF THE GENERAL INSURERS FOR THE YEAR 2004-05
Statistics Net Premium Income Claims Incurred Investment Income
Max 389511 290498 149253
Min 6196 3836 1345
Std Dev 138500.5 113574.4 57745.56
Average 126762.4 98532.7 44924.5
TABLE NO 12 SHOWS THE DESCRIPTIVE STATISTICS OF THE GENERAL INSURERS FOR THE YEAR 2005-06
Statistics Net Premium Income Claims Incurred Investment Income
Max 404082 363201 208294
Min 5554 3444 1503
Std Dev 131619.7 132261.5 75698.4
TABLE NO 13 SHOWS THE DESCRIPTIVE STATISTICS OF THE GENERAL INSURERS FOR THE YEAR 2006-07
Statistics Net Premium Income Claims Incurred Investment Income
Max 475177 364361 225507
Min 38955 3444 3195
Std Dev 146285.5 132499.1 78164.32
Average 173971.7 119810.1 61689
TABLE NO 14 SHOWS THE DESCRIPTIVE STATISTICS OF THE GENERAL INSURERS FOR THE YEAR 2007-08
Statistics Net Premium Income Claims Incurred Investment Income
Max 491428 417748 234619
Min 52801 24695 4802
Std Dev 140966.9 133398.7 81589.95
TABLE NO 15 SHOWS THE DESCRIPTIVE STATISTICS OF THE GENERAL INSURERS FOR THE YEAR 2008-09
Statistics Net Premium Income Claims Incurred Investment Income
Max 550031 467187 167686
Min 58749 35567 7172
Std Dev 159541.1 144136.8 57252.37
Average 235635.5 192189.4 57794.6
TABLE NO 16 SHOWS THE DESCRIPTIVE STATISTICS OF THE GENERAL INSURERS FOR THE YEAR 2009-10
Statistics Net Premium Income Claims Incurred Investment Income
Max 600263 513245 214082
Min 58000 39637 9008
Std Dev 181908.7 156528 76840.41
CONCLUSION
The paper has been an endeavor to evaluate the performance of the Indian General Insurance Sector. It uses the a panel data set of 10 General Insurance Companies over the financial period 2002-03 to 2009-10 in order to analyze the Technical Efficiency, Pure Technical Efficiency and Scale Efficiency by applying DEA. The analysis has been done by developing a model which involves Claims incurred as the output and Investment income and Net Premium income as the inputs. Among the public sector insurers National Insurance Company has been the most efficient company for most of the years under reference and New India Assurance Company has been the most inefficient among all the insurers as it has been showing the decreasing returns to scale in 7 years out of 8 years. Whereas the private insurers have started depicting the increasing returns to scale over the years which have been a sign of the emergence of healthy competition, except Bajaj General Insurance Company and ICICI General Insurance Company. Both these Companies have been mostly showing the decreasing returns to scale whereas the rest of the Private Insurers have not been showing the decreasing returns to scale. It has also been observed that the overall technical efficiency results of general insurers have been showing an improvement during the study period. On the other hand sector wise performance analysis states that technical efficiency of the public sector insurers has been more than that of the private sector companies. On comparison of the technical efficiency of both the sectors, it has been reported that though the technical efficiency of public sector is more than that of the private sector, the improvement space and direction of the private sector is decreasing which describes that competition would enhance efficiency through increased resource mobilization.
REFERENCES
Barros, Barroso and Borges. (2005), “Evaluating the Efficiency and Productivity of Insurance Companies with a Malmquist Index : A case study of Portugal”, Geneva Papers on Risk and Insurance, Vol. 30, No. 2, pp. 244-267.
Das, S.C. (2009) “The relationship between Insurance sector development and economic growth: Empirical evidence from India”, Invertis Journal of Management, Vol. 1, No.1, pp.35-42.
Davutyan and Klumpes. (2008), “Consolidation and Efficiency in the major European Insurance markets: A non discretionary Inputs Approach”, Working Paper.
Delhausse, B., Fecher, F., Perelman, S. and Pestieau, P. (1995) “Measuring Productive Performance in the Non-Life Insurance Industry: The Case of French and Belgian Markets”, Tijdschrift voor Economie en Management, Vol No. 40,pp. 47–69.
Diacon, S. (2001), “The efficiency of UK General Insurance Companies”, CRIS (Centre for Risk and Insurance Studies) Discussion paper series-2001.3 The University of Nottingham, http://www.nottingham.ac.uk/business/cris/papers/2001-03.pdf assessed on 2.5.2010.
Sri Krishna International Research & Educational Consortium
Ernest and Young.,(2008), “Indian insurance industry: the task
ahead”,http://aiii.googlegroups.com/attach/2e92a5fa99c08ddd/Insurance+Report assessed on 28-6-2011.
Fenn, Vencappa, Diacon, Klumpes and Brien. (2008), “Market Structure and Efficiency of European Insurance Companies: A Stochastic Frontier Analysis” , Journal of Banking and Finance, Vol. 32, No. 1, pp. 86-100.
Garg,M. and Deepti.(2008), “ Financial Performance Analysis of General Insurers in India” , Management and Labour Studies Journal , Vol. 33, No.3, pp.432-451.
Hussels, S. and Ward, D. R. (2006), “The Impact of Deregulation on the German and UK Life Insurance Markets: An Analysis of Efficiency and Productivity between 1991–2002”, Working Paper, Cranfield Research Paper Series (4).
Kannan and Thangavel.,(2008), “ Overview of Indian insurance sector”, Academic open internet journal , vol.22.
Klumpes, P. J. M. (2007), “Consolidation and Efficiency in the Major European Insurance Markets”, Working Paper, Imperial College, London.
Owusu, Dontwi, Seidu, Abudulai and Sebil.(2010) “ Technical Efficiencies of Ghanaian General Insurers”, American Journal of Social and Management Studies, Vol.1, No.1,pp. 75-87.
Saad and Idris. (2011), “Efficiency of Life Insurance Companies in Malaysia and Brunei: A Comparative Analysis”, International Journal of Humanities and Social Science, Vol. 1, No.3, pp.111-122.
Saeidy, P. and Kazemipour, S. (2011), “Compare the Performance of Private and Public Insurance Companies in Using Data Envelopment Analysis”, World Applied Sciences Journal, Vol. 13, No.5, pp.988-992.
Singh,I.and Kumar,A.(2005), “ Insurance sector reforms: changing Indian scenario,” Punjab Journal of Business Studies, Vol.1, No.1, pp.26-36.
Sinha, R.(2007), “Productivity and Efficiency of Indian General Insurance Industry,” Journal of Risk and Insurance, Vol.4 , No.2, April, pp.33-43.
Worthington, Andrew and Hurley, E.(2002), “Cost efficiency in Australia General Insurers: A Non-Parametric Approach,” British Accounting Review, Vol.34,No.1,pp 89-108.
ANNUAL REPORTS USED
Annual reports of IRDA from 2002-03 till 209-10.