R E S E A R C H
Open Access
Imaging-based clusters in former smokers
of the COPD cohort associate with clinical
characteristics: the SubPopulations and
intermediate outcome measures in COPD
study (SPIROMICS)
Babak Haghighi
1,2†, Sanghun Choi
3†, Jiwoong Choi
1,2, Eric A. Hoffman
4,5,6, Alejandro P. Comellas
6,
John D. Newell Jr
4, Chang Hyun Lee
4,7, R. Graham Barr
8, Eugene Bleecker
9, Christopher B. Cooper
10,
David Couper
11, Mei Lan Han
12, Nadia N. Hansel
13, Richard E. Kanner
14, Ella A. Kazerooni
15, Eric A. C. Kleerup
16,
Fernando J. Martinez
17, Wanda O
’
Neal
18, Robert Paine III
19, Stephen I. Rennard
20,21, Benjamin M. Smith
22,23,
Prescott G. Woodruff
24and Ching-Long Lin
1,2,4,5,25*Abstract
Background:Quantitative computed tomographic (QCT) imaging-based metrics enable to quantify smoking induced
disease alterations and to identify imaging-based clusters for current smokers. We aimed to derive clinically meaningful sub-groups of former smokers using dimensional reduction and clustering methods to develop a new way of COPD phenotyping.
Methods:An imaging-based cluster analysis was performed for 406 former smokers with a comprehensive set of imaging metrics including 75 imaging-based metrics. They consisted of structural and functional variables at 10 segmental and 5 lobar locations. The structural variables included lung shape, branching angle, airway-circularity, airway-wall-thickness, airway diameter; the functional variables included regional ventilation, emphysema percentage, functional small airway disease percentage, Jacobian (volume change), anisotropic deformation index (directional preference in volume change), and tissue fractions at inspiration and expiration.
Results:We derived four distinct imaging-based clusters as possible phenotypes with the sizes of 100, 80, 141, and 85, respectively. Cluster 1 subjects were asymptomatic and showed relatively normal airway structure and lung function except airway wall thickening and moderate emphysema. Cluster 2 subjects populated with obese females showed an increase of tissue fraction at inspiration, minimal emphysema, and the lowest progression rate of emphysema. Cluster 3 subjects populated with older males showed small airway narrowing and a decreased tissue fraction at expiration, both indicating air-trapping. Cluster 4 subjects populated with lean males were likely to be severe COPD subjects showing the highest progression rate of emphysema.
(Continued on next page)
© The Author(s). 2019Open Access This article is distributed under the terms of the Creative Commons Attribution 4.0 International License (http://creativecommons.org/licenses/by/4.0/), which permits unrestricted use, distribution, and reproduction in any medium, provided you give appropriate credit to the original author(s) and the source, provide a link to the Creative Commons license, and indicate if changes were made. The Creative Commons Public Domain Dedication waiver (http://creativecommons.org/publicdomain/zero/1.0/) applies to the data made available in this article, unless otherwise stated.
* Correspondence:[email protected]
†Babak Haghighi and Sanghun Choi contributed equally to this work.
1Department of Mechanical Engineering, University of Iowa, Iowa City, Iowa,
USA
2IIHR-Hydroscience & Engineering, University of Iowa, Iowa City, Iowa, USA
(Continued from previous page)
Conclusions:QCT imaging-based metrics for former smokers allow for the derivation of statistically stable clusters associated with unique clinical characteristics. This approach helps better categorization of COPD sub-populations; suggesting possible quantitative structural and functional phenotypes.
Keywords:COPD, Emphysema, Functional small airway disease, Former smokers, Imaging-based cluster analysis
Background
Chronic obstructive pulmonary disease (COPD) is the third leading cause of death in the United States [1] and is identified by airflow limitation and/or obstruc-tion. The severity of COPD is assessed by forced expiratory volume in 1 s (FEV1%) predicted values at
post bronchodilator [2]. The pulmonary function test
(PFT)-based FEV1 and forced vital capacity (FVC)
values are highly recommended to assess the global alteration of lung, but they do not correlate well with
symptoms [3]. In addition, PFTs do not reveal local
structural and functional alterations, which are essen-tial in examining the heterogeneity of COPD pheno-types. Thus, the ability to quantify these alterations at multiple scales during COPD progression is necessary to characterize COPD phenotypes.
A multicenter study of COPD, i.e., Subpopulations and Intermediate Outcomes in COPD Study
(SPIRO-MICS) [2] acquired QCT scans at total lung capacity
(TLC) and residual volume (RV) [4]. This is an
integral part of the multicenter study to find structural and functional phenotypes. A recent advance of quan-titative medical imaging and data analysis techniques allows for derivation of QCT imaging-based metrics, leading to identification of statistically stable clusters/ phenotypes. For instance, using only QCT imaging-based variables, Choi et al. [5] derived clinically mean-ingful asthmatic sub-groups, being potentially useful in developing clusters-specific treatments.
Further-more, Haghighi et al. [6] expanded the QCT
imaging-based clustering approach to identify homogenous clusters within current smokers from SPIROMICS. In this study, we hypothesize that QCT-based imaging metrics could be used to identify distinct COPD former smoker sub-groups with clinically meaningful charac-teristics, subsequently adding insights to the previous study of current smokers [6]. Shaker et al. [7] and Zach et al. [8] reported that former smokers had significantly higher % low-attenuation areas (%LAAs) on inspiration and expiration CT scans (for emphysema and air trap-ping measures) than current smokers. This is possibly due to parenchymal inflammation in current smokers serving to mask CT-based indices relative to former smokers [6, 7]. Therefore, we divided the subjects into former and current smokers to independently assess
phenotypes between these two groups and report on the former smokers in this work.
With the aid of machine learning techniques, QCT imaging-based metrics have been used to find homoge-neous sub-groups of COPD subjects. As an example, Bodduluri et al. [9] have employed image registration-based metrics to discriminate COPD subjects from non-COPD subjects. The study demonstrated the potential of
registration-based variables to characterize COPD
phenotypes, but this study was limited in supervised learning. In regards to unsupervised learning methods, there have been several efforts to identify COPD sub-groups, but they employed either clinical data-only or a mix of clinical and CT data together [10–12] as we focus
on imaging-only parameters to identify clusters.
Although it would be possible to add clinical/physio-logical/biological measures into our cluster analysis, we used only imaging-based features to focus features of airway structure and lung function. Once established, our clusters were evaluated for their clinical, physio-logical, or biological measures. The associations between imaging-only clusters and the non-imaging phenotypes provide a validation of the ability of imaging metrics to characterize clinically meaningful phenotypes. Choi et al. [5] pioneered the use of unsupervised cluster analysis using CT image data acquired by the Severe Asthma Re-search Program (SARP) to identify four asthmatic clus-ters. Their approach accounted for site and inter-subject variations, enabling an analysis of large data sets acquired by multiple centers. Furthermore, Choi et al. [13] successfully identified imaging-based structural and functional features that differentiate asthmatics and COPD patients with chronic functional alteration.
compared the cluster membership of former smokers in this study with that of current smokers presented in our previous study [6].
Methods
Human subject data and QCT imaging
We analyzed a total of 758 SPIROMICS subjects con-taining an extensive set of biomarkers. In our analysis, we hypothesized that smoking status may have effects on CT measures of former and current smokers [7, 8]. The hypothesis was further consolidated by performing a combined analysis and finding that a mix of both groups cannot provide adequate cluster stability. Hence, we excluded current smokers, so that a total of 406 for-mers smokers remained. The healthy never smokers without COPD were considered as healthy controls and were not included in the clustering analysis. PFTs were performed for all subjects pre- and post- bronchodilator,
and CT was performed post-bronchodilator. Table 1
shows the demographic and PFT measures based on each stratum. Former smokers with post-bronchodilator FEV1/FVC > 0.7 were grouped in stratum 2, and former
smokers in strata 3 and 4 had post-bronchodilator FEV1/FVC < 0.7, with FEV1> 50% in stratum 3 and
FEV1< 50% in stratum 4, respectively [2].
Two QCT scans at TLC and RV were acquired by multiple imaging centers in the NIH-funded
SPIRO-MICS multicenter research study [4]. The CT imaging
protocols were approved by each center’s institutional review boards (IRB). All QCT scans were obtained with post-bronchodilator. They were segmented with an auto-mated commercial airway/lung segmentation software (Apollo 2.0, VIDA Diagnostics), and registered with a non-rigid mass-preserving imaging registration tech-nique [15,16].
Derivation of QCT imaging-based metrics
A total of 75 multiscale imaging-based variables were extracted to derive principal components (Fig. 1). The segmental variables included bifurcation angle (θ), air-way circularity (Cr), wall thickness (WT) and hydraulic diameter (Dh), where each variable indicated alteration of skeletal structure, alteration of airway shape, wall thickening and luminal narrowing, respectively. The
sizes of WT and Dh were normalized by tracheal WT
and average diameter (Dave) predicted from healthy sub-jects [5], being denoted by WT* and Dh*, to eliminate inter-subject variability due to age, sex, and height. The four segmental variables were extracted from ten local regions to reflect characteristics of regional alterations.
Table 1Demography, baseline (Pre-bronchodilator) and maximal (Post-bronchodilator) pulmonary function tests for 105 Stratum 1 (healthy), 119 Stratum 2, 184 Stratum 3 and 103 Stratum 4 subjects
Stratum 1 (Healthy) Stratum 2 Stratum 3 Stratum 4 Pvalue
N= 69 N= 119 N= 184 N= 103
Demography
Age, yrs 58.6
(10.5)
65.1 (7.5)
69.1 (6.4)
65.2 (7.5)
< 0.0001
BMI, kg/m2 28.4
(5.2)
29.5 (4.8)
28.4 (4.6)
27.0 (4.7)
< 0.0001
Sex, (Male/Female %) 42/58 51.3/48.7 62.5/37.5 57.3/42.7 = 0.02
Race, Caucasian/ African American/ Other (%) 62.3/26.1/ 11.6 81.5/12.6/ 5.9 88.0 /7.1/ 4.9 85.4 /9.7/ 4.9 < 0.0001
Baseline lung functiona
FEV1% predicted 98
(13)
91 (14)
67 (16)
28 (8)
< 0.0001
FVC % predicted 98
(11)
94 (13)
91 (16)
67 (15)
< 0.0001
FEV1/FVC × 100 78
(6)
74 (6)
55 (9)
32 (9)
< 0.0001
Maximal lung function
b
FEV1% predicted 102
(12)
97 (14)
76 (15)
34 (10)
< 0.0001
FVC % predicted 98
(11)
95 (13)
99 (15)
76 (17)
< 0.0001
FEV1/FVC × 100 81
(6)
78 (5)
57 (8)
34 (9)
< 0.0001
Values expressed as mean (SD) or number (%). Kruskal-Wallis and chi-square tests were performed for continuous and categorical variables
a
Baseline (Pre-bronchodilator) values with greater than six hours withhold of bronchodilators.b
A detailed derivation of the above structural variables can be found in reference [17].
We further derived both strain-based and density-based functional metrics with the aid of image registration that matched two QCT images at TLC and RV. The strain-based variables included fractional air volume change (ΔVairF), the determinant of Jacobian (Jacobian), and
aniso-tropic deformation index (ADI). These are estimates of re-gional ventilation, local volume change, and preferential local lung deformation respectively [18, 19]. Next, the density-based functional metrics included functional small airway disease percentage (fSAD%) and emphysema percentage (Emph%) to characterize the portions of small airway narrowing/closure and emphysematous lung, re-spectively. This approach was devised to dissociate emphy-sematous region from air-trapping region, previously proposed by Galban et al. [20]. In order to eliminate inter-site variation, we employed a fraction-based fSAD% and Emph% using 90 and 98.5% air-fraction as the threshold, instead of using the density threshold of−856 and−950, respectively [21]. We further added two more imaging-based metrics that measure tissue fraction [13,22] at TLC
and RV (βtissueTLCandβtissueRV). The tissue fractions
meas-ure the portion of tissue volume in each voxel. These are supplementary metrics for Emph% and fSAD%, because
βtissueTLCdecreases if tissue destruction is captured andβ tis-sueRVdecreases if air fraction increases due to air-trapping.
In addition, we included global imaging-based metrics such as the ratio of apical-basal distance over ventral-dorsal distance at TLC (lung shape), the ratio of air-volume changes in upper lobes to those in middle and lower lobes between TLC and RV (U/(M + L)|v), fSAD%, Emph%, β tis-sueTLC and βtissueRV, Jacobian and ADI in the whole lung.
Overall, there were 32 local/segmental structural variables, 35 lobar structural variables and 8 global structural variables.
Cluster and statistical analysis
Raw imaging data were scaled with standard scaler, and a principal component analysis was performed to derive linearly uncorrelated variables, so-called principal com-ponents (PCs). To obtain an optimal number of PCs, a parallel analysis [23] with random uncorrelated data was adopted. The analysis led to the number of 7 as an opti-mal choice of PCs (Additional file1: Figure S1).
Fig. 1An expanded set of imaging-based metrics including emphysema percentage, tissue fraction at TLC and RV.aInspirational image-based local structures:θ, Cr, WT*, and Dh*.bExpiration image-based global and lobar function: AirT%.cInspiration image-based global and lobar
Using the 7 derived PCs, to find the optimal clustering method and number, we then assessed internal properties including connectivity, average Silhouette width and Dunn indices [24] for three different clustering methods, i.e., hierarchical, K-means, and Gaussian finite mixture model-based methods. Connectivity, average Silhouette width and Dunn indices measure the inverse ofithnearest neigh-bors which is not assigned to the same cluster, how tightly grouped all the points in the cluster are, and the ratio between the minimal inter-cluster distance to maximal intra-cluster distance, respectively. Thus smaller connect-ivity and larger Silhouette width and Dunn index indicate better clustering properties. First, K-means method was found to be a good clustering method for current data based on connectivity, and average Silhouette
width (Additional file 2: Figure S2a). Dunn criteria
then suggested that the number of 4 is an optimal choice in using K-means. To further test stability of the clustering membership, a nonparametric bootstrap analysis was performed with 200 bootstrapped data sets. The mean of Jaccard similarity coefficients, de-fined by the size of intersection divided by the size of the union between clusters [25], was computed to find the optimal cluster number and clustering approach (Additional file2: Figure S2b).
Kruskal-Wallis and chi-square tests were performed to compare differences of continuous and categorical vari-ables, respectively. The reportedPvalues were significant, if any one group is statistically different from one group or more. We then performed association tests of imaging-based clusters with demographic and clinical variables to investigate the clinical relevance of current clusters.
Results
Structural and functional features of imaging-based clusters
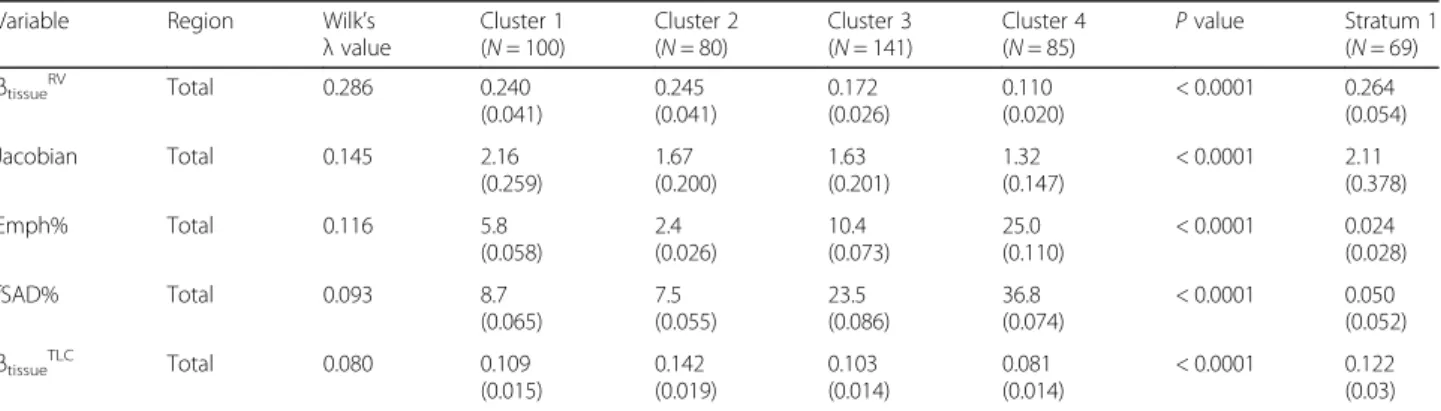
Cluster analysis identified four stable [6] imaging-based clusters with the sizes of 100, 80, 141 and 85, respectively (Table 2, and Fig. 2). Five major variables with higher
Wilk’sλvalues which best describe the four clusters were selected with a stepwise forward variable selection tech-nique using Wilk’sλcriterion [26]. Note that the clusters were differentiated predominantly with whole lung (total)
parenchymal metrics including βtissue at RV and TLC,
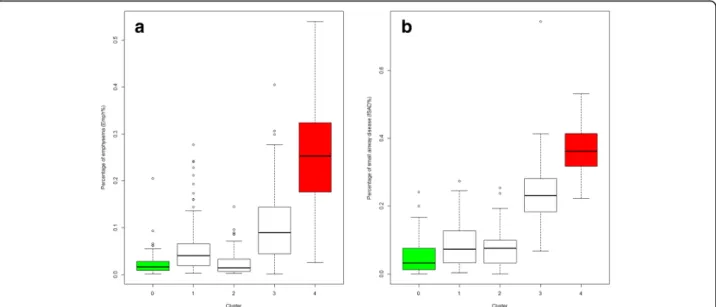
Jacobian, Emph% and fSAD%. Overall whole lung Emph% and fSAD% increased with increasing cluster number. It was noted that Emph% and fSAD% in Cluster 2 fell within the similar range with healthy subjects (Fig.3).
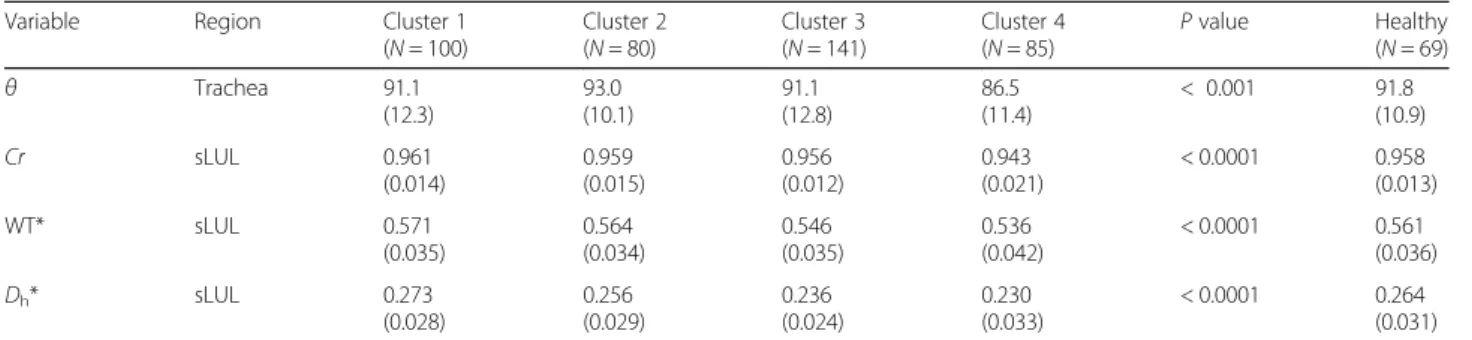
Structural alterations in segmental airways were also captured between clusters (Table3). Tracheal bifurcation angle (θ) and circularity (Cr) measured in the sLUL were significantly reduced in Cluster 4. Cluster 1 was character-ized by airway wall thickening (WT*↑), whereas Clusters 3 and 4 were demonstrated by airway wall thinning (WT*↓) and airway narrowing (Dh*↓). As summarized in Fig. 2, clusters were characterized by airway wall thickening-dominance (Cluster 1), increased tissue fraction at TLC with marginally increased emphysema (Cluster 2), prox-imal and peripheral airway narrowing (Cluster 3), and severe alterations of tracheal bifurcation angle (θ) and air-way shape (Cr) on proximal airways as well as peripheral alterations (Cluster 4).
Associations of imaging-based clusters with clinical features
Clusters 1 and 2 were mostly populated in GOLD 0, 1 and 2 along with a lower BODE index, while Cluster 4 was mostly populated with GOLD 3 and 4 (stratum 4) with the highest BODE index (Table 4). Cluster 2 showed the highest BMI (obese) among all clusters. Clusters 1 and 2 demonstrated similar post-bronchodilator FEV1/FVC values, but Cluster 2 had lower FEV1%predicted and FVC %predicted values compared with Cluster 1. Cluster 3 had significantly lower FEV1%predicted value and FEV1/FVC, along with preserved FVC value, whereas Cluster 4 had the lowest FEV1 and FVC % predicted values, along with the lowest FEV1/FVC.
Table 2Major imaging-based features selected by Wilk’sλvalue of a stepwise forward variable selection method in four imaging-based clusters and healthy subjects (stratum 1)
Variable Region Wilk’s
λvalue
Cluster 1 (N= 100)
Cluster 2 (N= 80)
Cluster 3 (N= 141)
Cluster 4 (N= 85)
Pvalue Stratum 1
(N= 69) βtissueRV Total 0.286 0.240
(0.041)
0.245 (0.041)
0.172 (0.026)
0.110 (0.020)
< 0.0001 0.264 (0.054)
Jacobian Total 0.145 2.16
(0.259)
1.67 (0.200)
1.63 (0.201)
1.32 (0.147)
< 0.0001 2.11 (0.378)
Emph% Total 0.116 5.8
(0.058)
2.4 (0.026)
10.4 (0.073)
25.0 (0.110)
< 0.0001 0.024 (0.028)
fSAD% Total 0.093 8.7
(0.065)
7.5 (0.055)
23.5 (0.086)
36.8 (0.074)
< 0.0001 0.050 (0.052) βtissueTLC Total 0.080 0.109
(0.015)
0.142 (0.019)
0.103 (0.014)
0.081 (0.014)
< 0.0001 0.122 (0.03)
The smoking pack-years were significantly greater in Clusters 3 and 4 than those of Clusters 1 and 2 (Table5). Cluster 4 showed higher associations with pulmonary/ vascular condition, and chronic bronchitis, emphysema, and COPD diagnosed at baseline across all clusters. Shortness of breath during sleep was increased in Clusters 2 and 4. Fathers and mothers of subjects in Cluster 4 were likely to have COPD. The WBC counts
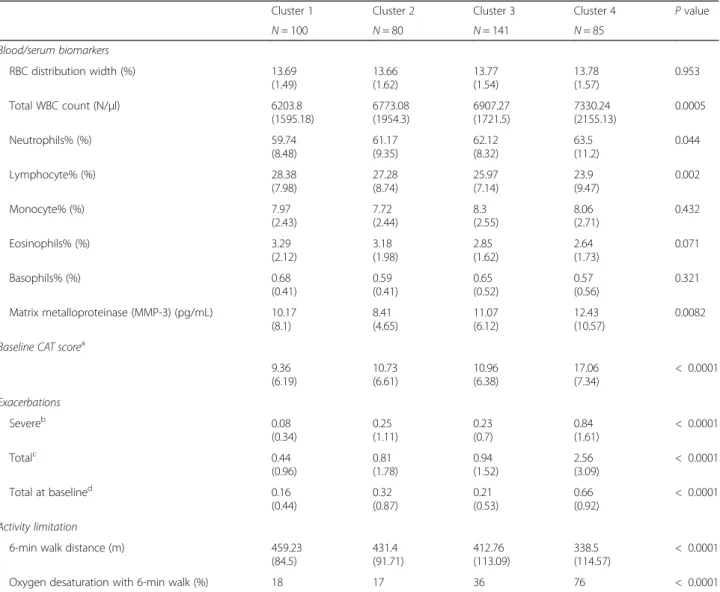
were increased in Clusters 2–4, with increased neutro-phils (Table 6). Lymphocytes were reduced in Cluster 4. The proteolytic enzymes of matrix-metalloproteinases (MMPs) were reduced especially in Cluster 2. Based on the lowest CAT score and exacerbation, Cluster 1 subjects were likely asymptomatic (CAT< 10) former smokers with the lowest exacerbation across all clusters. In contrast, Cluster 4 showed the highest CAT score
Fig. 2A summary of imaging and clinical characteristics between clusters
with the lowest 6-min walk distance along with severe oxygen desaturation.
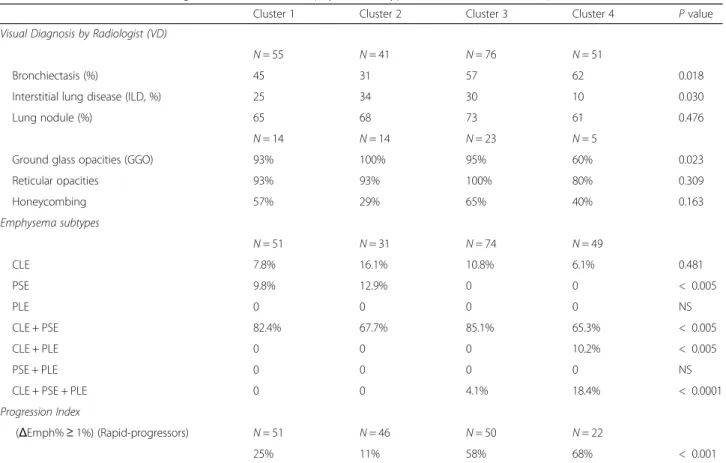
We further associated the clusters with visual diag-nostic assessments including COPD subtypes (CLE: Centrilobular; PSE: Paraseptal; PLE: Panlobular em-physema) as well as interstitial lung disease (ILD) by an experienced thoracic radiologist at the University
of Iowa (Table 7) because these subtypes might be
associated with airway abnormalities [27]. Cluster 4 was less likely related to ILD and had a significant in-crease of PLE. Subjects with PLE were not observed in Clusters 1 and 2. We analyzed longitudinal data of 169 available subjects among the current cohort of former smokers to quantify change of Emph%, i.e., emphysema progression index (ΔEmph%) between baseline and one-year follow-up.ΔEmph% is computed as the percentage of
Table 3Segmental airway features at specific regions
Variable Region Cluster 1
(N= 100)
Cluster 2 (N= 80)
Cluster 3 (N= 141)
Cluster 4 (N= 85)
Pvalue Healthy
(N= 69)
θ Trachea 91.1
(12.3) 93.0 (10.1) 91.1 (12.8) 86.5 (11.4)
< 0.001 91.8
(10.9)
Cr sLUL 0.961
(0.014) 0.959 (0.015) 0.956 (0.012) 0.943 (0.021)
< 0.0001 0.958 (0.013)
WT* sLUL 0.571
(0.035) 0.564 (0.034) 0.546 (0.035) 0.536 (0.042)
< 0.0001 0.561 (0.036)
Dh* sLUL 0.273
(0.028) 0.256 (0.029) 0.236 (0.024) 0.230 (0.033)
< 0.0001 0.264 (0.031)
Cr, WT*, andDh* were only presented at sLUL, but overall trends between clusters were consistent in different locations
Table 4Demography, baseline (pre-bronchodilator) and maximal (post-bronchodilator) PFTs, in four imaging-based clusters
Cluster 1 Cluster 2 Cluster 3 Cluster 4 Pvalue
N= 100 N= 80 N= 141 N= 85
Demography
GOLD (%) (0/1/2/3/4) 62/23/14/1/0 57/20/20/2/0 6/24/51/16/3 2/0/12/46/40 < 0.0001
Strata (%) (2/3/4) 62/37/1 57/40/2 6/74/19 2/12/86 < 0.0001
BODE index 0.28
(0.61) 0.60 (1.12) 1.31 (1.78) 3.99 (2.00) < 0.0001
Sex (Female %) 32 64 34 41 0.00015
Race (White/African-American/Other) 88/6/6 75/20/5 91/4/5 84/12/5 0.0088
Age (yrs.) 64.91
(7.11) 66.59 (7.92) 69.37 (5.94) 65.67 (7.92) < 0.0001
BMI (kg/m2) 28.67
(4.43) 30.76 (4.55) 28.49 (4.6) 25.68 (4.44) < 0.0001
PFT Baseline lung functiona
FEV1% predicted 88
(18) 79 (16) 59 (20) 31 (15) < 0.0001
FVC % predicted 97
(14) 88 (14) 85 (18) 71 (19) < 0.0001
FEV1/FVC × 100 68
(10) 68 (9) 51 (11) 32 (10) < 0.0001
PFT Maximal lung functionb
FEV1% predicted 95
(17) 86 (16) 68 (19) 37 (17) < 0.0001
FVC % predicted 101
(14) 91 (14) 94 (17) 80 (20) < 0.0001
FEV1/FVC × 100 72
(10) 71 (9) 53 (11) 34 (12) < 0.0001
Data presented as number (%) or mean (SD)
a
Pre-bronchodilator values
b
voxels within the lung less than −950 HU and assesses
the extend of emphysema (ΔEmph%≥1% andΔEmph% ±
0.5% are considered as rapid-progressors and non-progressors, respectively) [28]. ΔEmph was marginal in Cluster 2 (Table 7), whereas it was significantly higher in Cluster 4.
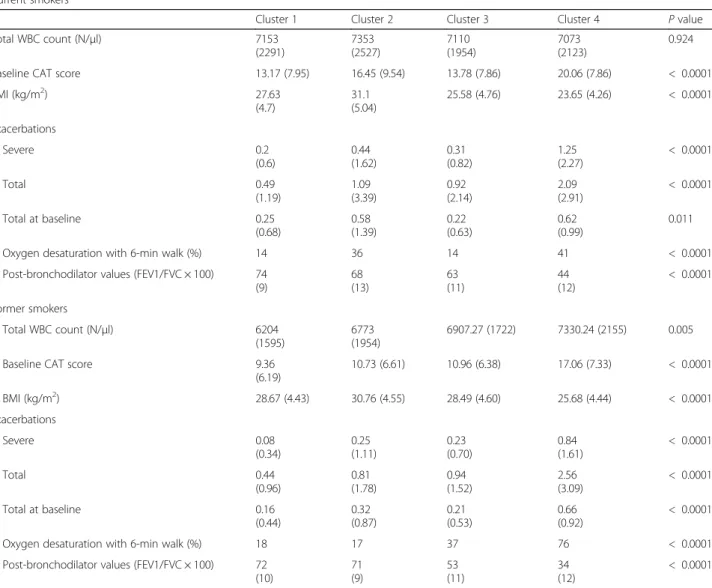
Furthermore, we compared two different clusters-grouping derived from current smokers [6] and former smokers, respectively (Table 8). Overall CAT score and exacerbation histories of current smokers were greater than those of former smokers. WBC counts were not differentiable in current smokers-derived clusters be-cause all clusters showed large numbers of WBC count. On the other hand, WBC count of former smokers-derived Cluster 1 was the smallest and it was increased as increasing the cluster membership of former smokers. On the contrary to the finding of WBC counts, former smokers demonstrated greater Emph and fSAD% than current smokers, based on kernel density estimation (KDE) plots (Fig. 4). The dispersed density distribution of current smokers may indicate the masking effect of CT-based measures of emphysema and small airway
disease, compared to former smokers [7]. The Emph%
and fSAD% of former smokers (Table 2) were especially increased in Clusters 3 and 4, as compared with coun-terparts of current smokers [6].
Decision tree analysis
We performed a decision tree analysis to construct a simple predictive model (Additional file3: Figure S3) to classify former smokers. The data set was shuffled randomly into training (n= 324) and test sets (n= 82) and the accuracy was assessed on the test set. The model comprising 5 discriminant variables resulted in accuracy of 81%. These variables were βtissueRV (Total), Jacobian
(Total),βtissueTLC(Total),Dh* (RMB) and ADI (Total).
We further evaluated an association between current and former smoker clusters by assessing the membership of former smokers in the decision tree of current smokers [6] and vice versa. The classification accuracy for both cases was about 0.62 based on the confusion matrices (Additional file4: Table S1). It can give an assessment for possible overlap between clusters of these two cohorts.
Discussion
In this study, we applied an unsupervised clustering method with an expanded set of imaging-based variables to former COPD smokers collected in the multicenter study of SPIROMICS. Four homogeneous clusters were derived within a former-smoker population, exhibiting distinct phenotypic characteristics and strong associations with clin-ically relevant COPD biomarkers. The imaging-based clus-ters can provide more information than the conventional
Table 5Associations of symptoms and disease histories with cluster membership
Cluster 1 Cluster 2 Cluster 3 Cluster 4 Pvalue
N= 100 N= 80 N= 141 N= 85
Symptoms and disease History
Smoking pack-years at baseline 48.09
(22.27)
48.21 (25.3)
57.64 (27.4)
54.44 (22.9)
0.001
History of pulmonary/vascular condition (%) 24 18 21 39 0.0056
Chronic Bronchitis (%) 10 18 19 31 0.005
Emphysema (%) 28 24 45 76 < 0.0001
COPD diagnosed at baseline (%) 40 34 64 88 < 0.0001
Chronic bronchitis diagnosed at baseline (%) 11 5 16 19 0.061
Asthma (%) 12 20 19 23 0.285
Wheezing and whistling in chest (%) 46 50 59 59 0.167
Wheezing age (yrs.) (%) 60 67 78 68 0.19
Sleep Apnea at baseline (%) 28 29 15 17 0.106
Shortness of breath during sleep (%) 6 17 7 17 0.012
Coronary artery disease 6 12 15 7 0.101
Diabetes (%) 12 19 11 14 0.452
Heart attack (%) 1 5 6 10 0.08
Congestive heart failure (%) 1 2 3 2 0.81
Genetic effect
Father had COPD (%) 15 14 22 33 0.006
PFT-based classification of COPD, such as stratum and GOLD criteria, because they explain structural and func-tional alterations at lobar and segmental levels. We also in-cluded parenchymal metrics including Emph%, fSAD%, tissue fractions at TLC and RV as well as segmental-level structural metrics including wall thickness and diameter of airway branches. The imaging and clinical phenotypes based on the clusters could be explained as follows.
Features of respective clusters
The cluster memberships can suggest possible pheno-types with distinct characteristic correlated with relevant clinical/biomarker measures for former COPD smoker.
Cluster 1: asymptomatic resistant smokers with preserved pulmonary function
Cluster 1 showed preserved pulmonary function (FEV1/ FVC = 0.72) at post bronchodilator and was mostly popu-lated in GOLD stages 0 and 1. This cluster had a relatively low Emph% and fSAD% with structural and functional characteristics close to those of healthy controls. BODE index, exacerbation histories and WBC count of this clus-ter were relatively lower compared with other clusclus-ters. These characteristics along with CAT< 10 and the lowest exacerbation among all clusters suggests that Cluster 1 be-longs to asymptomatic resistant smokers. Cluster 1 im-aging metrics were very close to those of healthy subjects. Airway wall thickening was the only abnormality in this
Table 6Characteristics of biomarkers in four imaging-based clusters
Cluster 1 Cluster 2 Cluster 3 Cluster 4 Pvalue
N= 100 N= 80 N= 141 N= 85
Blood/serum biomarkers
RBC distribution width (%) 13.69
(1.49) 13.66 (1.62) 13.77 (1.54) 13.78 (1.57) 0.953
Total WBC count (N/μl) 6203.8
(1595.18) 6773.08 (1954.3) 6907.27 (1721.5) 7330.24 (2155.13) 0.0005
Neutrophils% (%) 59.74
(8.48) 61.17 (9.35) 62.12 (8.32) 63.5 (11.2) 0.044
Lymphocyte% (%) 28.38
(7.98) 27.28 (8.74) 25.97 (7.14) 23.9 (9.47) 0.002
Monocyte% (%) 7.97
(2.43) 7.72 (2.44) 8.3 (2.55) 8.06 (2.71) 0.432
Eosinophils% (%) 3.29
(2.12) 3.18 (1.98) 2.85 (1.62) 2.64 (1.73) 0.071
Basophils% (%) 0.68
(0.41) 0.59 (0.41) 0.65 (0.52) 0.57 (0.56) 0.321
Matrix metalloproteinase (MMP-3) (pg/mL) 10.17 (8.1) 8.41 (4.65) 11.07 (6.12) 12.43 (10.57) 0.0082
Baseline CAT scorea
9.36 (6.19) 10.73 (6.61) 10.96 (6.38) 17.06 (7.34) < 0.0001 Exacerbations
Severeb 0.08
(0.34) 0.25 (1.11) 0.23 (0.7) 0.84 (1.61) < 0.0001
Totalc 0.44
(0.96) 0.81 (1.78) 0.94 (1.52) 2.56 (3.09) < 0.0001
Total at baselined 0.16
(0.44) 0.32 (0.87) 0.21 (0.53) 0.66 (0.92) < 0.0001 Activity limitation
6-min walk distance (m) 459.23
(84.5) 431.4 (91.71) 412.76 (113.09) 338.5 (114.57) < 0.0001
Oxygen desaturation with 6-min walk (%) 18 17 36 76 < 0.0001
Kruskal-Wallis and chi-square tests were performed for continuous and categorical variables, respectively, and theirPvalues were reported
a
CAT score range from 0 to 40, with higher scores indicating greater severity symptoms
b
Total count of exacerbations requiring ED visit or hospitalization since entering the study
c
Total count of exacerbations since entering the study
d
cluster. A large population study, Multi-Ethnic Study of Atherosclerosis (MESA) [29], reported that long-term smoking may contribute to airway wall thickening prior to the development of more severe imaging features of COPD.
Cluster 2: obese female individuals with preserved lung function and marginal emphysema
Cluster 2 with the highest BMI and over-representation of women indicated clinical and epidemiological importance as reported by Castaldi et al. [10] and Martinez et al. [30]. Castaldi et al. [10] derived four clusters with 10,192 subjects from COPDGene using several imaging-based metrics, e.g., Emph%, upper/lower ratio of Emph%, gas trapping, and PFT results acquired by a feature selection method. Note that our Cluster 2 is aligned with Cluster 2 of Castaldi et al. [10] in high BMI, African-American and women-dominance. Cluster 2 showed the preserved pul-monary function (FEV/FVC = 0.71) close to Cluster 1, but the CAT score and exacerbation of this cluster was greater than that of Cluster 1. This group showed a noticeable in-crease of tissue fraction at TLC, and a dein-crease of emphy-sema index among clusters. This cluster included more
CLE-only type while showing the lowestΔEmph% among
clusters. This finding is of interest because most studies showed that development of CLE is associated with severe abnormalities of the small airways, e.g. wall thickening. Thus, CLE may be more related to air-borne risk factors that cause airway inflammatory processes [27]. Cluster 2 also showed the lowest value of MMPs among clusters. Ostridge et al. [31] investigated the association between specific pulmonary MMPs and emphysema as these enzymes degrade the extracellular matrix and have been identified as potentially important in the development of emphysema [31].
Cluster 3: older male individuals with increasing fSAD and emphysema
Unlike Clusters 1 and 2, Cluster 3 demonstrated a significant decrease of FEV1/FVC and FEV1% predicted values, but their FVC % predicted value remained in the normal range. This cluster was mostly populated in GOLD stages 2 and 3 with a significant increase in BODE index. From this cluster, Emph% and fSAD% in parenchy-mal regions were significantly increased, being similar with Cluster 4. Thus, this cluster showing airway
Table 7Associations of visual diagnostics (VD) and of emphysema subtypes with cluster membership
Cluster 1 Cluster 2 Cluster 3 Cluster 4 Pvalue
Visual Diagnosis by Radiologist (VD)
N= 55 N= 41 N= 76 N= 51
Bronchiectasis (%) 45 31 57 62 0.018
Interstitial lung disease (ILD, %) 25 34 30 10 0.030
Lung nodule (%) 65 68 73 61 0.476
N= 14 N= 14 N= 23 N= 5
Ground glass opacities (GGO) 93% 100% 95% 60% 0.023
Reticular opacities 93% 93% 100% 80% 0.309
Honeycombing 57% 29% 65% 40% 0.163
Emphysema subtypes
N= 51 N= 31 N= 74 N= 49
CLE 7.8% 16.1% 10.8% 6.1% 0.481
PSE 9.8% 12.9% 0 0 < 0.005
PLE 0 0 0 0 NS
CLE + PSE 82.4% 67.7% 85.1% 65.3% < 0.005
CLE + PLE 0 0 0 10.2% < 0.005
PSE + PLE 0 0 0 0 NS
CLE + PSE + PLE 0 0 4.1% 18.4% < 0.0001
Progression Index
(ΔEmph%≥1%) (Rapid-progressors) N= 51 N= 46 N= 50 N= 22
25% 11% 58% 68% < 0.001
Kruskal-Wallis and chi-square tests were performed for continuous and categorical variables, respectively, and theirPvalues were reported
Kruskal-Wallis and chi-square tests were performed for continuous and categorical variables, respectively. Five hundred ninety-nine SPIROMICS subjects were used for progression index (169 former smokers were available)
Table 8Comparison of major clinical and biomarkers between current and former smokers
Current smokers
Cluster 1 Cluster 2 Cluster 3 Cluster 4 Pvalue
Total WBC count (N/μl) 7153
(2291)
7353 (2527)
7110 (1954)
7073 (2123)
0.924
Baseline CAT score 13.17 (7.95) 16.45 (9.54) 13.78 (7.86) 20.06 (7.86) < 0.0001
BMI (kg/m2) 27.63
(4.7)
31.1 (5.04)
25.58 (4.76) 23.65 (4.26) < 0.0001
Exacerbations
Severe 0.2
(0.6)
0.44 (1.62)
0.31 (0.82)
1.25 (2.27)
< 0.0001
Total 0.49
(1.19)
1.09 (3.39)
0.92 (2.14)
2.09 (2.91)
< 0.0001
Total at baseline 0.25
(0.68)
0.58 (1.39)
0.22 (0.63)
0.62 (0.99)
0.011
Oxygen desaturation with 6-min walk (%) 14 36 14 41 < 0.0001
Post-bronchodilator values (FEV1/FVC × 100) 74 (9)
68 (13)
63 (11)
44 (12)
< 0.0001
Former smokers
Total WBC count (N/μl) 6204
(1595)
6773 (1954)
6907.27 (1722) 7330.24 (2155) 0.005
Baseline CAT score 9.36
(6.19)
10.73 (6.61) 10.96 (6.38) 17.06 (7.33) < 0.0001
BMI (kg/m2) 28.67 (4.43) 30.76 (4.55) 28.49 (4.60) 25.68 (4.44) < 0.0001
Exacerbations
Severe 0.08
(0.34)
0.25 (1.11)
0.23 (0.70)
0.84 (1.61)
< 0.0001
Total 0.44
(0.96)
0.81 (1.78)
0.94 (1.52)
2.56 (3.09)
< 0.0001
Total at baseline 0.16
(0.44)
0.32 (0.87)
0.21 (0.53)
0.66 (0.92)
< 0.0001
Oxygen desaturation with 6-min walk (%) 18 17 37 76 < 0.0001
Post-bronchodilator values (FEV1/FVC × 100) 72 (10)
71 (9)
53 (11)
34 (12)
< 0.0001
Kruskal-Wallis and chi-square tests were performed for continuous and categorical variables, respectively, and theirPvalues were reported
narrowing without airway wall thinning, and normal circularity and skeletal structure (airway geometry) would be categorized as an intermediate cluster between less se-vere stage (Cluster 1) and more sese-vere stage of COPD (Cluster 4).
Cluster 4: severe emphysema and fSAD individuals with severe structural alterations
This cluster showed the highest Emph%, fSAD%, BODE index, WBC count and CAT score along with the lowest FEV1/FVC among all clusters. These characteristics along with structural and functional variables indicated that Cluster 4 belongs to severe symptomatic COPD subjects.
The pattern of decreasing Dh* with increasing fSAD%
(non-emphysematous air trapping) indicates severely narrowed status of both proximal and distal airways. In addition to airway narrowing, this group actually contains most of the significant structural and functional alter-ations. It is especially noted that prominent airway wall thinning and alteration of airway geometry change were only observed in this cluster. Assuming that this cluster is the most severe COPD group, alterations of airway features including airway wall thinning (WT*), elliptic airway shape (Cr), and change of airway geometry (θ) may occur at the end stage of COPD.
Dominance of PLE with diffuse destruction in Cluster 4 along with its highest progression index among all clusters might be related to blood-borne mechanism ra-ther than the possible air-borne mechanism in Cluster 2. These finding shows the possibility of two different pathogenetic mechanisms among subjects. In addition, Koo et al. [32] studied WBC count as a biomarker and their associations with the severity of the disease. WBC count in former smokers has an increasing pattern from Cluster 1 to Cluster 4 (Table 6) along with increasing CAT score and decreasing FEV1/FVC.
With previously analyzed current smokers [6], the com-parison for important clinical and biomarker measures be-tween former and current smokers are shown in Table 8. Overall, exacerbation has increasing pattern between clus-ters of former smokers with Cluster 1 and Cluster 4 with the lowest and highest, respectively. Cluster 2 for both current and former smokers has increased exacerbation compared to clusters 1 and 3 and might be related to the highest tissue fraction and possible inflammation in Cluster 2.
WBC count was lower in former smokers possibly due to the effect of smoking on the WBC [6], which was also significantly elevated as increasing cluster membership. This result indicates that WBC count can serve as an important risk factor such as inflammation especially in former smokers. Furthermore, the CAT score and ex-acerbation histories were significantly higher in current smokers than in former smokers. An increase in
inflammatory markers in current smokers relative to former smokers was contradictory to imaging-based
fea-tures such as Emph% and fSAD% (Fig.4). The smoking
status could affect parenchymal inflammation, leading to
an increase of CT density [6, 7]. Thus Emph% and
fSAD% could be underestimated, if patients are on smok-ing. This confounding effect prevents from applying a clustering algorithm for former and current smokers due to the low Jaccard index (< 0.7).
To assess a possible overlap between current and former smokers, we used the trained decision tree on current smokers to classify former smokers and vice versa; the clas-sification accuracy for both cases was about 0.62 (the con-fusion matrices are reported in Additional file4: Table S1). This result indicates that two clustering analyses between former and current smokers can be further used to investi-gate the difference in phenotypic characteristics of these cohorts. The impact of smoking status on cluster member-ship requires further investigation with larger cohorts as well as with longitudinal data to inspect disease progression and membership transition over time.
Conclusions
We performed a cross-sectional study to derive four unique imaging-based clusters in former smokers with COPD. The current cluster analysis can be used in con-junction with our previously reported cluster analyses in current smokers with COPD to assess the differences in smoking status (former vs current) in the COPD popula-tion and explore possible different phenotypes between these two groups.
Additional files
Additional file 1: Figure S1.A scree plot: eigenvalues (magnitude
of variances) according to the number of principal components for determining the optimal number of components. (DOCX 65 kb)
Additional file 2: Figure S2.(a) Internal properties in different
clustering methods to find the best clustering approaches as well as the optimal number of clusters; (b) Bootstrapping stability analysis between K-means and hierarchical clustering with 4 or 5 numbers of clusters. (DOCX 58 kb)
Additional file 3: Figure S3.Predicting imaged-based cluster using only
5 important variables. Variables areβtissueRV(Total), Jacobian (Total),βtissueTLC
(Total),Dh* (RMB) and ADI (Total) with 81% accuracy. (DOCX 59 kb)
Additional file 4: Table S1.The confusion matrices to assess the
possible overlap between current and former smoker clusters. Values are presented as the number of subjects (%). (DOCX 15 kb)
Abbreviations
ADI:Anisotropic deformation index; BMI: Body mass index; BronInt: Right intermediate bronchus;Cr: Airway luminal circularity;Dh: Hydraulic luminal
diameter; Emph%: Emphysema percentage; FEV1: Forced expiratory volume
analysis; PFT: Pulmonary function test; QCT: Quantitative computed tomography; RLL: Right lower lobe; RMB: Right main bronchus; RML: Right middle lobe; RUL: Right upper lobe; RV: Residual volume; sLLL: Sub-grouped left lower lobe with branches of LB6, and LB8 to LB10; sLUL: Sub-grouped left upper lobe with branches of LB1 to LB5; SPIROMICS: Subpopulations and intermediate outcome measures in COPD study; sRLL: Sub-grouped right lower lobe with branches of RB6 to RB10; sRML: Sub-grouped right middle lobe with branches of RB4 to RB5; sRUL: Sub-grouped right upper lobe with branches of RB1 to RB3; TLC: Total lung capacity; TriLLB: Trifurcation of left lower lobe; U/(M + L)|v: The ratio of air volume changes in upper lobes to those in middle and lower lobes; WA%: Airway wall area percentage, i.e., the ratio of wall area to total area; WBC: White blood cell; WT: Airway wall thickness;βtissue, RV: Tissue fraction at RV;βtissue, TLC: Tissue fraction at TLC; ΔVairF: Lobar fraction of air volume change between TLC and RV;
θ: Bifurcation angle between two daughter branches
Acknowledgements
The authors thank the SPIROMICS participants and participating physicians, investigators and staff for making this research possible. More information about the study and how to access SPIROMICS data is atwww.spiromics.org. We would like to acknowledge the following current and former
investigators of the SPIROMICS sites and reading centers: Neil E Alexis, PhD; Wayne H Anderson, PhD; Igor Barjaktarevic, MD, PhD; R Graham Barr, MD, DrPH; Eugene R Bleecker, MD; Richard C Boucher, MD; Russell P Bowler, MD, PhD; Elizabeth E Carretta, MPH; Stephanie A Christenson, MD; Alejandro P Comellas, MD; Christopher B Cooper, MD, PhD; David J Couper, PhD; Gerard J Criner, MD; Ronald G Crystal, MD; Jeffrey L Curtis, MD; Claire M Doerschuk, MD; Mark T Dransfield, MD; Christine M Freeman, PhD; MeiLan K Han, MD, MS; Nadia N Hansel, MD, MPH; Annette T Hastie, PhD; Eric A Hoffman, PhD; Robert J Kaner, MD; Richard E Kanner, MD; Eric C Kleerup, MD; Jerry A Krishnan, MD, PhD; Lisa M LaVange, PhD; Stephen C Lazarus, MD; Fernando J Martinez, MD, MS; Deborah A Meyers, PhD; Wendy C Moore, MD; John D Newell Jr., MD; Laura Paulin, MD, MHS; Stephen Peters, MD, PhD; Cheryl Pirozzi, MD; Elizabeth C Oelsner, MD, MPH; Wanda K O’Neal, PhD; Victor E Ortega, MD, PhD; Robert Paine, III, MD; Nirupama Putcha, MD, MHS; Sanjeev Raman, MBBS, MD; Stephen I. Rennard, MD; Donald P Tashkin, MD;; J Michael Wells, MD; Robert A Wise, MD; and Prescott G Woodruff, MD, MPH. The project officers from the Lung Division of the National Heart, Lung, and Blood Institute were Lisa Postow, PhD, and Thomas Croxton, PhD, MD.
Authors’contributions
Co-First/Equal authorship for BH and SC Conception and design: BH, SC; acquisition of data: BH, SC, EAH, APC, JDN, RGB, EB, CBC, DC, MH, NNH, REK, EAK, ECK, FJM, WO, SIR, BMS, PGW, CLL; analysis and interpretation of data: all authors; drafting the article or revising it critically for important intellectual content: BH, SC, JC, EAH, CLL; final approval of the version to be published: all authors.
Funding
Supports for this study were provided, in part, by NIH grants U01-HL114494, R01-HL112986 and S10-RR022421, and by Basic Science Research Program through the National Research Foundation of Korea (NRF) funded by the Ministry of Education (NRF-2017R1D1A1B03034157) and by the Korea Ministry of Environment (MOE) as the Environmental Health Action Program (RE201806039). SPIROMICS was supported by contracts from the NIH/NHLBI (HHSN268200900013C,
HHSN268200900014C, HHSN268200900015C, HHSN268200900016C, HHSN268200900017C, HHSN268200900018C, HHSN268200900019C, HHSN268200900020C), and supplemented by contributions made through the Foundation for the NIH and the COPD Foundation from AstraZeneca/MedImmune; Bayer; Bellerophon Therapeutics; Boehringer-Ingelheim Pharmaceuticals, Inc..; Chiesi Farmaceutici S.p.A.; Forest Research Institute, Inc.; GlaxoSmithKline; Grifols Therapeutics, Inc.; Ikaria, Inc.; Nycomed GmbH; Takeda Pharmaceutical Company; Novartis Pharmaceuticals Corporation; ProterixBio; Regeneron Pharmaceuticals, Inc.; Sanofi; and Sunovion.
Availability of data and materials
Not applicable.
Ethics approval and consent to participate
Ethics and consent were approved by SPIROMICS committee.
Consent for publication
The paper was approved by SPIROMICS publications and presentation committee.
Competing interests
The authors declare that they have no competing interests.
Author details
1Department of Mechanical Engineering, University of Iowa, Iowa City, Iowa,
USA.2IIHR-Hydroscience & Engineering, University of Iowa, Iowa City, Iowa, USA.3School of Mechanical Engineering, Kyungpook National University,
Daegu, Republic of Korea.4Department of Radiology, University of Iowa, Iowa City, Iowa, USA.5Department of Biomedical Engineering, University of
Iowa, Iowa City, Iowa, USA.6Department of Internal Medicine, University of Iowa, Iowa City, Iowa, USA.7Department of Radiology, College of Medicine,
Seoul National University, Seoul, Republic of Korea.8Department of Epidemiology, Mailman School of Public Health, Columbia University Medical School, New York, NY, USA.9Department of Medicine, The University of Arizona, Tucson, AZ, USA.10Department of Physiology, UCLA, Los Angeles,
CA, USA.11Department of Biostatistics, University of North Carolina, Chapel Hill, NC, USA.12Department of Internal Medicine, University of Michigan, Ann
Arbor, MI, USA.13School of Medicine, Johns Hopkins, Baltimore, MD, USA.
14School of Medicine, University of Utah, Salt Lake City, UT, USA. 15
Department of Radiology, University of Michigan, Ann Arbor, MI, USA.
16Department of Medicine, UCLA, Los Angeles, CA, USA.17Department of
Medicine, Weill Cornell Medical Center, New York, NY, USA.18School of Medicine, University of North Carolina, Chapel Hill, NC, USA.19School of
Medicine, University of Utah, Salt Lake City, UT, USA.20Department of Internal Medicine, University of Nebraska College of Medicine, Omaha, NE, USA.21Clinical Discovery Unit, AstraZeneca, Cambridge, UK.22Department of Medicine, College of Physicians and Surgeons, Columbia University, New York, NY 10032, USA.23McGill University Health Center Research Institute, Montreal, Canada.24School of Medicine, UCSF, San Francisco, CA, USA. 25
2406 Seamans Center for the Engineering Art and Science, Iowa City, Iowa 52242, USA.
Received: 19 February 2019 Accepted: 2 July 2019
References
1. Miniño AM, Murphy SL, Xu J, Kochanek KD. Deaths: final data for 2008. Natl Vital Stat Rep Cent Dis Control Prev Natl Cent Health Stat Natl Vital Stat Syst. 2011;59:1–126.
2. Couper D, LaVange LM, Han M, Barr RG, Bleecker E, Hoffman EA, Kanner R, Kleerup E, Martinez FJ, Woodruff PG, Rennard S, SPIROMICS Research Group. Design of the Subpopulations and Intermediate Outcomes in COPD study (SPIROMICS). Thorax. 2014;69:491–4.
3. Agusti A, Calverley PMA, Celli B, Coxson HO, Edwards LD, Lomas DA, MacNee W, Miller BE, Rennard S, Silverman EK, Tal-Singer R, Wouters E, Yates JC, Vestbo J. Evaluation of COPD longitudinally to identify predictive surrogate endpoints (ECLIPSE) investigators. Characterisation of COPD heterogeneity in the ECLIPSE cohort. Respir Res. 2010;11:122.
4. Sieren JP, Newell JD, Barr RG, Bleecker ER, Burnette N, Carretta EE, Couper D, Goldin J, Guo J, Han MK, Hansel NN, Kanner RE, Kazerooni EA, Martinez FJ, Rennard S, Woodruff PG, Hoffman EA. SPIROMICS protocol for multicenter quantitative computed tomography to phenotype the lungs. Am J Respir Crit Care Med. 2016;194:794–806.
5. Choi S, Hoffman EA, Wenzel SE, Castro M, Fain S, Jarjour N, Schiebler ML, Chen K, Lin C-L, Heart N. Lung and blood Institute’s severe asthma research program. Quantitative computed tomographic imaging-based clustering differentiates asthmatic subgroups with distinctive clinical phenotypes. J Allergy Clin Immunol. 2017;140:690–700.e8.
6. Haghighi B, Choi S, Choi J, Hoffman EA, Comellas AP, Newell JD, Graham Barr R, Bleecker E, Cooper CB, Couper D, Han ML, Hansel NN, Kanner RE, Kazerooni EA, Kleerup EAC, Martinez FJ, O’Neal W, Rennard SI, Woodruff PG, Lin C-L. Imaging-based clusters in current smokers of the COPD cohort associate with clinical characteristics: the SubPopulations and Intermediate Outcome Measures in COPD Study (SPIROMICS). Respir Res. 2018;19:178. 7. Shaker SB, Stavngaard T, Laursen LC, Stoel BC, Dirksen A. Rapid fall in lung
8. Zach JA, Williams A, Jou S-S, Yagihashi K, Everett D, Hokanson JE, Stinson D, Lynch DA, COPDGene Investigators. Current smoking status is associated with lower quantitative CT measures of emphysema and gas trapping. J Thorac Imaging. 2016;31:29–36.
9. Bodduluri S, Newell JD, Hoffman EA, Reinhardt JM. Registration-based lung mechanical analysis of chronic obstructive pulmonary disease (COPD) using a supervised machine learning framework. Acad Radiol. 2013;20:527–36.
10. Castaldi PJ, Dy J, Ross J, Chang Y, Washko GR, Curran-Everett D, Williams A, Lynch DA, Make BJ, Crapo JD, Bowler RP, Regan EA, Hokanson JE, Kinney GL, Han MK, Soler X, Ramsdell JW, Barr RG, Foreman M, van Beek E, Casaburi R, Criner GJ, Lutz SM, Rennard SI, Santorico S, Sciurba FC, DeMeo DL, Hersh CP, Silverman EK, et al. Cluster analysis in the COPDGene study identifies subtypes of smokers with distinct patterns of airway disease and emphysema. Thorax. 2014;69:415–22.
11. Burgel P-R, Roche N, Paillasseur J-L, Tillie-Leblond I, Chanez P, Escamilla R, Court-Fortune I, Perez T, Carré P, Caillaud D. Clinical COPD phenotypes identified by cluster analysis: validation with mortality. Eur Respir J. 2012;40: 495–6.
12. Castaldi PJ, Benet M, Petersen H, Rafaels N, Finigan J, Paoletti M, Marike Boezen H, Vonk JM, Bowler R, Pistolesi M, Puhan MA, Anto J, Wauters E, Lambrechts D, Janssens W, Bigazzi F, Camiciottoli G, Cho MH, Hersh CP, Barnes K, Rennard S, Boorgula MP, Dy J, Hansel NN, Crapo JD, Tesfaigzi Y, Agusti A, Silverman EK, Garcia-Aymerich J. Do COPD subtypes really exist? COPD heterogeneity and clustering in 10 independent cohorts. Thorax. 2017;72:998–1006.
13. Choi S, Haghighi B, Choi J, Hoffman EA, Comellas AP, Newell JD, Wenzel SE, Castro M, Fain SB, Jarjour NN, Schiebler ML, Barr RG, Han MK, Bleecker ER, Cooper CB, Couper D, Hansel N, Kanner RE, Kazerooni EA, Kleerup EAC, Martinez FJ, O’Neal WK, Woodruff PG, Lin C-L. Differentiation of quantitative CT imaging phenotypes in asthma versus COPD. BMJ Open Respir Res. 2017;4:e000252.
14. Pauwels RA, Buist AS, Calverley PMA, Jenkins CR, Hurd SS. Global strategy for the diagnosis, management, and prevention of chronic obstructive pulmonary disease. Am J Respir Crit Care Med. 2001;163:1256–76. 15. Haghighi B, D Ellingwood N, Yin Y, Hoffman EA, Lin C-L. A GPU-based
symmetric non-rigid image registration method in human lung. Med Biol Eng Comput. 2018;56:355–71.
16. Yin Y, Hoffman EA, Lin C-L. Mass preserving nonrigid registration of CT lung images using cubic B-spline. Med Phys. 2009;36:4213–22.
17. Choi S, Hoffman EA, Wenzel SE, Castro M, Fain SB, Jarjour NN, Schiebler ML, Chen K, Lin C-L. Quantitative assessment of multiscale structural and functional alterations in asthmatic populations. J Appl Physiol Bethesda Md. 2015;118:1286–98.
18. Jahani N, Choi S, Choi J, Haghighi B, Hoffman EA, Comellas AP, Kline JN, Lin C-L. A four-dimensional computed tomography comparison of healthy and asthmatic human lungs. J Biomech. 2017;56:102–10.
19. Choi S, Hoffman EA, Wenzel SE, Tawhai MH, Yin Y, Castro M, Lin C-L. Registration-based assessment of regional lung function via volumetric CT images of normal subjects vs. severe asthmatics. J Appl Physiol Bethesda Md. 2013;115:730–42.
20. Galbán CJ, Han MK, Boes JL, Chughtai KA, Meyer CR, Johnson TD, Galbán S, Rehemtulla A, Kazerooni EA, Martinez FJ, Ross BD. Computed tomography-based biomarker provides unique signature for diagnosis of COPD phenotypes and disease progression. Nat Med. 2012;18:1711–5. 21. Choi S, Hoffman EA, Wenzel SE, Castro M, Lin C-L. Improved CT-based
estimate of pulmonary gas trapping accounting for scanner and lung-volume variations in a multicenter asthmatic study. J Appl Physiol. 2014;117:593–603.
22. Hoffman EA. Effect of body orientation on regional lung expansion: a computed tomographic approach. J Appl Physiol Bethesda Md. 1985; 59:468–80.
23. Ledesma RD. Determining the number of factors to retain in EFA : an easy-to-use computer program for carrying out parallel analysis; 2007. 24. Brock G, Pihur V, Datta S, Datta S. clValid: an R package for cluster validation.
J Stat Softw. 2008;25:1–22.
25. Hennig C. Cluster-wise assessment of cluster stability. Comput Stat Data Anal. 2007;52:258–71.
26. Baier D, Decker R, Schmidt-Thieme L. Data Analysis and Decision Support. Berlin Heidelberg: Springer-Verlag; 2005.www.springer.com/us/book/978354 0260073.
27. Cosio Piqueras MG, Cosio MG. Disease of the airways in chronic obstructive pulmonary disease. Eur Respir J Suppl. 2001;34:41s–9s.
28. Dougherty T. Quantitative computed tomography based measures of vascular dysfunction for identifying COPD phenotypes and subphenotypes. Theses Diss. 2016.https://ir.uiowa.edu/etd/2069.
29. Donohue KM, Hoffman EA, Baumhauer H, Guo J, Budoff M, Austin JHM, Kalhan R, Kawut S, Tracy R, Barr RG. Cigarette smoking and airway wall thickness on CT scan in a multi-ethnic cohort: the MESA lung study. Respir Med. 2012;106:1655–64.
30. Martinez FJ, Curtis JL, Sciurba F, Mumford J, Giardino ND, Weinmann G, Kazerooni E, Murray S, Criner GJ, Sin DD, Hogg J, Ries AL, Han M, Fishman AP, Make B, Hoffman EA, Mohsenifar Z, Wise R, National Emphysema Treatment Trial Research Group. Sex differences in severe pulmonary emphysema. Am J Respir Crit Care Med. 2007;176:243–52.
31. Ostridge K, Williams N, Kim V, Harden S, Bourne S, Coombs NA, Elkington PT, Estepar RSJ, Washko G, Staples KJ, Wilkinson TMA. Distinct emphysema subtypes defined by quantitative CT analysis are associated with specific pulmonary matrix metalloproteinases. Respir Res. 2016;17:92.
32. Koo H-K, Kang HK, Song P, Park HK, Lee S-S, Jung H. Systemic white blood cell count as a biomarker associated with severity of chronic obstructive lung disease. Tuberc Respir Dis. 2017;80:304–10.
Publisher’s Note