Stable URL: https://arcc-journal.org/index.php/arccjournal/article/view/1059 10.17831/enq:arcc.v16i1.1059
Corresponding Author: [email protected]
Published by the Architectural Research Centers Consortium under the
2019
volume 16 | issue 2 SPECIAL EDITION:
URBAN DATA ASSEMBLAGE
Analysis and Simulation of Dynamic Vision in the City:
A Computer-Aided Cinematic Approach
Fang Xu
Abstract
This paper proposes a computer-aided Dynamic Visual Research and Design Protocol for environmental designers to analyze humans’ dynamic visual experiences in the city and to simulate dynamic vision in the design process. The Protocol recommends using action cameras to collect massive dynamic visual data from participants’ first-person perspectives. It prescribes a computer-aided visual analysis approach to produce cinematic charts and storyboards, which further afford descriptive narratives for aesthetic assessment and discussion. Employing real-time 3D
simulation technologies, the Protocol enables the simulation of people’s dynamic vision in designed urban environments to support evaluation in design. Detailed contents and merits of the Protocol were demonstrated by its application in the Urbanscape Studio, a community participatory design course based at Watertown, South Dakota.
Keywords: Dynamic Vision, Visual Data Analysis, Cinematic Analysis, Simulation, Evaluation
Introduction
Kevin Lynch and his associates have argued that
understanding humans’ vision in motion is important
for architectural and urban designers (Lynch and Hack 1984, Lynch 1984, Lynch, Banerjee, and Southworth 1990). However, substantive research concerning dynamic vision has been scant aside from two precedents from the 1960s. Contemporary design literature contains few empirical research studies investigating dynamic visual experiences in the built environment, let alone practical utilization of dynamic visual research in architectural or urban design.
In 1961, Gordon Cullen published The Concise Townscape, a pioneering work elaborating how the urban space could accommodate pedestrians with enjoyable walking and seeing experiences as they move through the city. With free-hand sketches and photographs, Cullen documented and storyboarded
pedestrians’ eye-level views. He expressively described urban design aesthetics that would enrich the dynamic visual forms experienced by pedestrians. Cullen claimed that designing for favorable dynamic
visual experiences in the city entailed an “art of relationship” of urban elements such as buildings,
moving balance” (Appleyard, Lynch, and Myer 1964a, 25).
Integrating the studies of environmental cognition and aesthetic evaluation, Cullen and Appleyard et al.
laid the foundations for understanding humans’
dynamic visual experiences in urban settings. Their groundbreaking works shared a few theoretical perspectives despite idiosyncratic methods:
(1) Dynamic vision, whether the observer be on foot or in the vehicle, has an aesthetic
relevance and modifies humans’ evaluation
of the environment.
(2) Dynamic vision derives from the ecological process by which an observer moves within a temporal-spatial setting. Therefore, it is a multi-faceted, holistic phenomenon incorporating salient human, spatial, and
temporal dimensions.
(3) Researchers and designers need to study the visual forms of first-person, sequential views to describe and understand dynamic vision.
For decades, these fundamental understandings have remained the most prominent, influencing many design researchers concerned with dynamic visual qualities (see Banerjee and Loukaitou-Sideris 2011, Watson, Plattus, and Shibley 2003, Bacon 1967). In recent years, visual experiences in the city have drawn refreshed research attention as evidenced by studies of visual gaze in real or simulated urban spaces (see Wong et al. 2012, Simpson 2018). However, research studies analyzing and evaluating real-world dynamic visual experiences remain scarce. In principle, researchers since Cullen unanimously recognized the multi-dimensionality of dynamic visual phenomena, but meager existing research methods for gathering, transforming, displaying, and
environments and for simulating the implications of designed environments upon dynamic visual experiences in digital space. To advance Cullen and
Appleyard’s explorations, the proposed Dynamic
Visual Research and Design Protocol capitalizes on digital technologies in visual data collection, processing, analysis, simulation, and design integration. It introduces computer-aided cinematic analysis to unravel the intricate relationships between the human, temporal, and spatial factors underlying dynamic visual forms. It can generate qualitative narratives for adequately describing and comparing complex dynamic visually experiences. Its application will bestow the following capabilities to environmental researchers and designers:
(1) Provide an integrated dynamic visual research and design workflow that is affordable, trustworthy, transferrable, and field operable.
(2) Collect and process massive dynamic visual data with coherent and accountable computer-aided data analysis procedures.
(3) Characterize dynamic visual qualities as experienced through visualizing and qualitatively transforming quantitative analysis results for peer checking and communication with non-designer actors involved in architectural and urban development projects.
(4) Simulate dynamic vision in the virtual
environment to augment appraisal of “user
performance” and to conduct pre -occupancy evaluation of end-users’ spatial
The Protocol sponsors a comprehensive research-based and user-centered design process that fuses environmental research, simulation-based design evaluation, and user participation, making pleasant dynamic visual experiences a significant and attainable design objective in practice.
DYNAMIC VISUAL DATA COLLECTION
In a broader, cross-disciplinary context of empirical research, there has been an ongoing transition toward a broader use of visual data. During the past decades, more research studies in anthropology and sociology have involved visual data (Banks 2007, Harper 2012, Berry 2012). The field of person-environment research reflects a similar trend given the growing visual data collection techniques such as tracking, mapping, photographing, and filming (Gehl and Svarre 2013a, Gifford 2016).
In general, environmental researchers have employed observational methods (e.g. Jacobs 1993, Gehl 2010, Gehl and Svarre 2013b, Whyte 1980) or
self-reports (e.g. Lynch 1960, 1982) to garner visual data. However, neither method is suitable for dynamic visual data collection. Observational methods cannot directly capture the sequential, eye-level views from the first-person perspective, and self-reports are ineffective in generating visual data. Lacking proper data collection methods, early dynamic visual researchers had to improvise. Cullen recorded his personal dynamic visual experiences through photographs and sketches, making himself a
“researcher participant.” Appleyard et al. simulated drivers’ dynamic views using camera recorders
installed on moving vehicles. These measurement instruments, while being novel at the time, were inadequate and limited research quality.
Recently, technological advancements in wearable recording apparatuses (e.g., GoPro cameras, Snapchat glasses, and Tobii eye-tracking glasses) have enabled affordable, consistent, and efficient first-person visual data collection (see Simpson et al. 2018, Simpson 2018, Chalfen 2014, Brown, Dilley, and Marshall 2008). These devices not only reliably record
research participants’ immersive visual experiences,
1 For example, the unit price of Tobii glasses is over $10,000 as of 2019.
2 Cullen defined place in a significantly different way from the mainstream uses of the term in the
but they also capture nuance in sequential views
contingent to participants’ bodily, head, or even eye
movements. These crucial details were absent in
Cullen’s sketches/photographs or Appleyard’s film
recordings from cameras fastened to the vehicle.
The proposed Dynamic Visual Research and Design Protocol adopts head-mountable action cameras as data collection means considering both data quality and cost-effectiveness. GoPro cameras, especially the GoPro Session series, are lightweight and comfortable to wear, exerting minimal physical
inference with the research participant’s normal
bodily and head movements. Compared with camera glasses, head-mounted recording devices capture dynamic views that are slightly off the real sightline, but they produce better video quality in varying lighting conditions, which frequently occur as one moves between well-lit and shaded areas when walking in a city. Eye-tracking glasses collect more dynamic visual data by unveiling foci of visual attention supplemental to the first-person dynamic views, but they are prohibitively expensive1 and financially infeasible for regular use in research and design projects.
DYNAMIC VISUAL DATA ANALYSIS
Cullen and Appleyard et al. constructed different theoretical models to elaborate the interrelated human, spatial, and temporal dimensions of dynamic vision. In light of these models, they distilled various dynamic visual data into sequential visual forms for further analyses and evaluations.
Referring to first-person sequential views, or serial vision, Cullen examined the category of optics,
namely the patterns of “existing views” and “emerging views” that constitute a walking person’s visual impression of a town’s scenery (1961). The study of optics highlighted aesthetic significance of
sequential views in terms of “the drama of juxtaposition” and “visual impacts.” Cullen also
recognized the categories of place and content. Place
refers to the spatial relationship between the observer and the surrounding space.2Content means
“the fabric of the town” that comprised physical
interactive relationship between human, space, and time(1964b, 1964a). To study these procedures, they invented and employed a suite of visual analysis tools with an iconography inspired by Lynch’s work on
urban imageability (see Lynch 1960). A cinematic storyboarding of visual progression, transition, or overall organization carried out the study of sequential visual forms as the product of discrete cognitive procedures.
The proposed Dynamic Visual Research and Design
Protocol espouses Cullen’s conceptual framework of
dynamic vision, focusing on the formal construction of visual sequences instead of the underlying cognitive processes. The central research application of the Protocol is to comprehensibly describe the temporal distribution and relationships of different sequential views. Moreover, the Protocol assumes that two constantly varying person-environment conditions
predicted one’s sequential views, the spatial
relationship between the observer and the
surrounding environment (i.e. Cullen’s place) and the
environment’s physical appearances as perceived by the observer (i.e. Cullen’s content). Therefore, the
Protocol aims to assess the contribution of spatial relationships and physical appearances toward the dynamic visual form.
To analyze sequential visual forms, the Protocol exploits a cinematic analysis strategy comparable to
Appleyard et al.’s diagrammatic approach but
significantly reinforced by digital technologies. Historically, cinematic analysis in varied forms reflected the interaction between cinematic arts and spatial design as commercial cinema matured after
3 For example, computer algorithms are available for automatically tracking movement trajectory of pedestrians and vehicles in video data (Zaki and Sayed
transformation, interpretation, comparison, and evaluation.
UTILIZATION OF DYNAMIC VISUAL RESEARCH
There has long been an “implementation gap”
between empirical design research and the actual design process (Sommer 1997). For dynamic visual research, utilizing empirical research findings in the cyclical decision-making process of formal generation and evaluation depends on the development of design simulation approaches.
Traditionally, the transfer of environmental design knowledge to architectural and planning professionals relies on academic channels such as peer-reviewed publications, conferences, workshops, and lectures. Academics predominantly dominate these knowledge dissemination platforms, which therefore often endorse lab-conditioned methods that lack field operability. For example, Appleyard and Craik established the Environmental Simulation Laboratory at Berkeley to simulate dynamic vision with analogy means including model-scopes, motion picture cameras, and realistic scale models (Bosselmann 1993, 1984, Appleyard and Craik 1974). Cullen made similar efforts for dynamic simulations of urban environment (Russell 1992). These analog methods were developed in specialized research centers and hence not cost-effective for wide adoption in common design firms. Applying these methods also required sophisticated research backgrounds that ordinary architectural designers do not possess.
Recently, growing studies in dynamic visualization have exhibited practical tools that simulate the dynamic visual implications of designed environments in digital space (Stamps 2016, Mullins 2006). Integrating computer-aided cinematic analysis with the latest real-time 3D simulation technologies, the proposed Dynamic Visual Research and Design Protocol can accurately simulate end-users’ dynamic
vision for straightforward evaluation of alternate design proposals, helping to disseminate dynamic visual research knowledge to planning or architectural professionals.
APPLYING THE DYNAMIC VISUAL RESEARCH AND DESIGN PROTOCOL
The Urbanscape Studio
A recent community participatory urban design course applied the Dynamic Visual Research and Design Protocol, demonstrating its contents and instrumental values. During the fall semester of 2018 (August 30th – December 4th, 2018), the author created and instructed the Urbanscape Studio for 3rd -year architectural students at South Dakota State University. As part of a multi-year Public Works
course series, the Urbanscape Studio embodied the
Department of Architecture’s commitment to
promoting Public Interest Design (PID) through an
active “learning by doing” approach that engages and elicits people’s “experiential knowledge” to inform
design decisions (see Moore 2017, Bell and Wakeford 2008, Bell 2004).
The Studio met realistic urban research and design needs arising from a South Dakota community. Located in the eastern rural area of the state, Watertown has a modest population of around 22,000. Downtown Watertown spreads for eight blocks hinged by two intersecting commercial streets. For the past 20 years, residents of Watertown have
been talking about a revitalization plan for the city’s
historic downtown, which boasts of over 60 buildings recognized by the National Register of Historic Places. Since 2017, Watertown municipality has assigned public resources for planning and executing changes
4 Mixed methods research is defined by Johnson and
Onwuegbuzie as “the class of research where the
researcher mixes or combines quantitative and qualitative research techniques, methods, approaches,
concepts or language in a single study.” (Johnson and Onwuegbuzie 2004, 17). A mixed-method design
to improve the downtown’s pedestrian
environments, pursuing environmental qualities that would make downtown Watertown a place where residents gather.
The Urbanscape Studio researched pedestrians’
dynamic vision in downtown Watertown and to develop responsive urban design concepts. It incorporated an eight-week research project that collected and analyzed dynamic visual data and a five-week design project that conceived new urban forms to induce enjoyable dynamic visual experiences. According to the Protocol, the research project implemented exploratory case study research with a mixed-method4 research design. The research team gathered, refined, and managed visual data along with supplemental spatial and verbal data organized in multiple cases. As an inductive, empirical inquiry for investing a phenomenon within its real-life context, the case study strategy identifies cases about the complex dynamics with which it intersects (Stake 1995, Yin 2003b, Stake 2005, Miles and Huberman 1994). The case or basic unit of analysis for the research project of the Urbanscape Studio was
defined as “a meaningful dynamic visual form that a Watertown resident would experience during walks of his or her daily or weekly routines”. Each case was a
unique assembly of visual, spatial, and verbal semantic data. Encompassing contexts for these cases, which were virtually inseparable from the
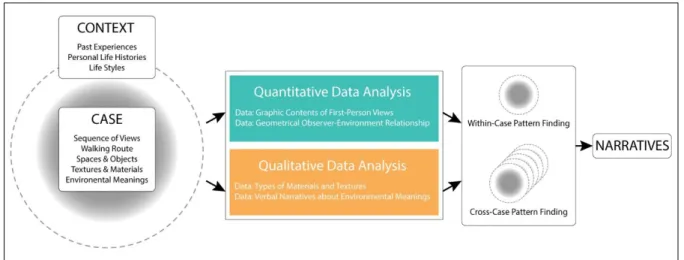
cases, included residents’ habitual modes of person -environment interactions in downtown Watertown due to their personal life histories, socio-economic roles, and lifestyles. For data analysis, concurrent quantitative and qualitative phases were undertaken, where qualitative thematic analysis of material textures and verbal data complemented quantitative analysis of visual and spatial data for constructing expanded descriptions about the multi-dimensional dynamic visual phenomena (Figure 1). The final research reports mixed and integrated outcomes of both types of data analyses to construct narrative accounts explicating thematic patterns in the visual forms, which may be further examined qualitatively.
Data Collection and Processing
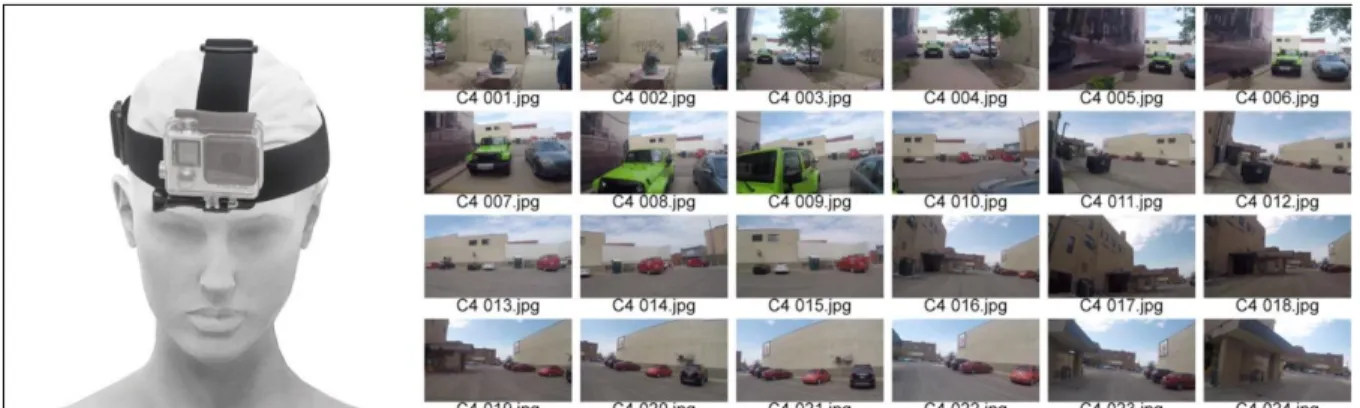
Six Watertown residents volunteered to participated in the Urbanscape Studio5 for first-person dynamic visual data collection and analysis. All of them are permanent residents who work or live in or approximate to the downtown. Accompanied by the research team, these participating residents reconstructed brief walks that they frequently take within the downtown area on a daily or weekly basis. As they walked, the head-mounted GoPro cameras they wore collected visual data by filming videos that approximated their dynamic first-person views at resolutions of 1920x1080 with a field of view (FOV) of about 120 degrees.6 These participants also narrated their feelings and knowledge about environmental meanings, disclosing environmental meanings of different places and artifacts along their walking routes. Field notes were used to gather these verbal
data during the participants’ walks. The video
recordings and corresponding field notes, along with supplemental observational and archival data such as site photos and downtown maps, constituted six discrete research cases. The research team also identified and discovered contextual information associated with these cases through informal conversations with research participants before and
5 All six voluntary research participants (two males and four females) are residents of Watertown for more than 30 years. Their ages range from 35 to 60.
6 The research project used three types of GoPro cameras with slightly different horizontal fields of view
after the walks. They collected some additional data through interviews with a local historian.
The original video recordings were 5 to 7 minutes long at 30 frames per second. Collectively, they revealed
that participating residents’ walking routes wove
through multiple streets and alleyways in the more developed eastern part of the downtown area. These videos were further trimmed down to be shorter than 4 minutes to include only outdoor walks recorded in the best video quality. To extract sequential views,
Free Video to JPG ConverterTM was used, a video
conversion software program, to sample static frames from videos at a fixed interval of two seconds. The two-second interval translates to a walking distance of approximately three yards (about 2.74 meters) in reality. For each video recording, a sequence of 100-120 2D views was sampled (Figure 2). This sampling interval was adopted conveniently for visual data collection in order to obtain an adequate grouping of 2D views that represent the entire dynamic visual form. A more fine-grained image sampling interval (e.g., one second or less) would generate many almost identical views and unnecessarily increase the workload for data analysis. It may also include extraneous views resulting from brief and repetitive head movements that are not
(FOVs) at resolutions of 1920x1080: 122.64 degrees for Hero 4 Session cameras and 118.9 degrees for Hero 5 and Hero 5 Session cameras. Both well simulates
humans’ binocular FOV of 114 degrees (Howard and Rogers 1995).
essential for understanding the overall aesthetics of dynamic vision.7 A longer sampling interval, by comparison, may have important, characteristic views truncated.
Computer-Aided Cinematic Analysis
To varying extents, the extracted sequential views were similar to or distinct from each other. Some immediately adjacent views were alike as they contained many recurrent visual contents; others were different because considerable visual contents abruptly emerged or disappeared. View-to-view transitions, therefore, appeared to be gradual or dramatic. The ordering patterns of view-to-view
7 For example, there may be a remarkable but short-lived repetition of several sequential views as a
changes distributed over time, as both Cullen and Appleyard et al. accented, are essential for describing and evaluating sequential visual forms.
To measure view-to-view differences among sequential views, ImageDiffTM was utilized, an image
comparison software program. Originally developed for professional photographers to categorize shots by subject, ImageDiffTM is ideal for comparing sequential
views. Its image comparison algorithm can detect clusters of pixels in similar configurations regardless of their positions in images. Recognizing pixel clusters of recurrent visual contents, ImageDiffTM gives
quantitative assessments of image differences
pedestrian quickly turns her head back and forth to check traffic before crossing a street.
Figure 2. Data collection device and sequential views extracted from a first-person video recording (Case04). ("ProMounts GoPro Head Strap." accessed 10/24/2019. https://www.northmiamidivers.com/products/promounts-gopro-head-strap (left) and author (right)).
according to the percentage of distinct pixel clusters between two images (Figure 3).8
With ImageDiffTM, the visual difference could be
quantified between every single view and the immediately preceding view in a visual sequence. They documented the outcomes in Microsoft Excel and generated simple quantitative analysis reports with descriptive statistics (mean, median, standard deviation, and quartiles) and histograms. The statistical analyses profiled the overall conditions of view-to-view differences within research cases. Some cases included more gradual and gentle view transitions with average and median view-to-view differences below 50%, and the histogram showed a heavy lower tail, while others introduced more intense view changes. Next, categorized sequential views were categorized into three brackets: key views, quasi-key views, and ordinary views. The categorization procedure used ad-hoc bracketing
8 The comparison algorithm of ImageDiffTM is still
pixel-based but it shows some characteristics of object-pixel-based change detection techniques, the unit of analysis of which is an image object of rich information including texture, shape, and spatial relation- ships with neighboring objects. Compared to pure pixel-based and statistics-oriented approaches, object-based
techniques better simulate humans’ visual perception
and are increasingly employed in the field of remoting sensing and that of image recognition (Hussain et al. 2013, Canty 2019).
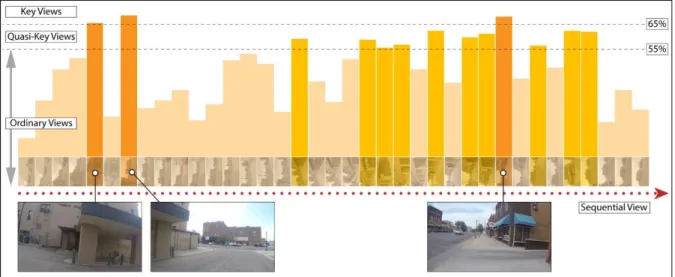
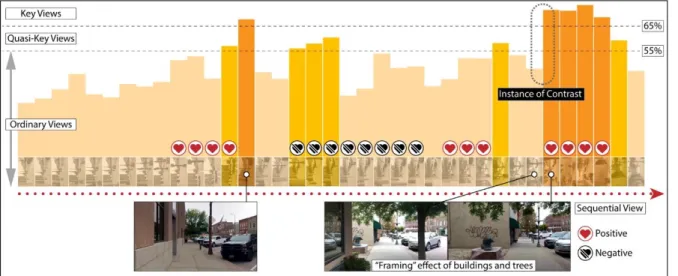
thresholds developed after cross-case comparisons: key views were those 65% different from their preceding views; ordinary views contained less than 55% view-to-view change; quasi-key views were the remaining intermediate ones.9
The Protocol assumes that key views introduce considerable view-to-view adaption and hence
indicate “jerks or revelations” (Cullen 2003, 1961)
that would arouse “strong impressions” or demarcate “climaxes” in the visual experience (Appleyard, Lynch, and Myer 1964a, Appleyard, Lynch, and Myer 1964b). Clustered bar charts were then created that visualized the temporal distribution of key, quasi-key, and ordinary views. They further modified these charts in Adobe Illustrator to produce timeline-based
Charts ofView Differences (Figure 4).
The Protocol also requires identifying variations in spatial relationships and physical appearances, the
9 These bracketing thresholds were conveniently adopted by the Urbanscape Studio to transform quantitative image comparison values into qualitative categories of key views, quasi-key views, and ordinary views. Using different thresholds does not change the quantitative comparison results but rather alters the amount of key views that the consequent cinematic analysis focuses on.
Figure 4. Part of a Chart of View Differences showing the distribution of key views in the timeline (Case 04). (Author’s
two fundamental contributing categories of sequential views. From these, Charts of Spatial Relationship Variations and Charts of Thematic Appearance Variations were produced through visual studies that synthesized data about the walking route, downtown street plans, building geometries, and types of materials and textures in sequential views.
Echoing Cullen’s concept of place, spatial relationship refers to how a moving observer is positioned in a visually perceivable space, manifesting the geometrical reciprocity between the observer and the surrounding spatial environment. Therefore spatial relationship varies if the observer changes her location in the same space (e.g., walking from the border of a square to its center), the observer changes her visual orientation (e.g. turning to look at retail storefronts instead of the street vista), or the observer is situated in a different space definition (e.g., entering the overhung area of an awning). In principle, spatial relationship corresponds to part of an ever-changing 3D isovist that is within the
observer’s instantaneous field of view.10 To measure such a 3D isovist component, the Protocol recommends retrieving information about four basic quantitative variables: (1) viewing orientation or the direction of the forward sightline, (2) height of the visible space, (3) depth of the visible space along the direction of forward sightline, and (4) width of the visible space in the cross direction of forward sightline. A distinct spatial relationship means a unique combination of these variables. Following the Protocol, a timeline-based Charts of Spatial Relationship Variations was generated. With 2D isovist graphs representing the altering spatial relationships, these charts showcased the spaces as experienced, accenting prominent changes in observer-environment relationships such as changing edges and boundaries, disparity in scale, or spatial expansiveness in contrast with enclosure.
Regarding physical appearances or the category of
contentby Cullen’s definition, the Protocol requests
tracking thematic material textures in visual sequences. These thematic physical appearances
10 An isovist means the space visible from a given vantage point (Benedikt 1979, Batty 2001). A complete 3D isovist includes the entire space that is visible for all possible viewing orientations of the observer (see Fisher-Gewirtzman, Burt, and Tzamir 2003, Yang, Putra, and Li 2007, Lu et al. 2019). Dynamic visual research
repeatedly occur over time, indicating prevailing environmental elements. As part of the Urbanscape Studio research project, a decision was made to categorize and document the visibility of the sky as a thematic physical material to profile changes in physical appearance. This process was a qualitative categorization and pattern finding of graphic data. Some parts of the team also charted the visibility of dominant building materials.
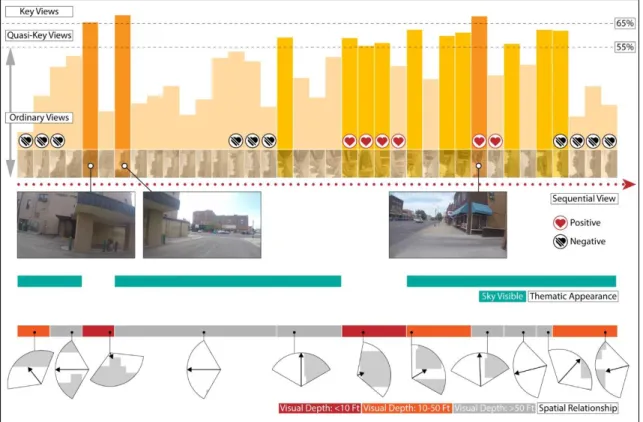
The research team conducted rudimentary qualitative content analyses of their field notes to disclose thematic positive and negative environmental meanings that the research participants assigned to buildings or other environmental elements they encountered along their walking routes. These findings were combined with Charts of View Differences, Charts of Spatial Relationship Variations, and Charts of Thematic Appearance Variations, to produce Comprehensive Storyboards for all six cases of dynamic visual experiences (Figure 5). Comprehensive Storyboards
diagrammatically present the temporal composition, transition, and articulation of first-person views, visually perceived spaces, thematic physical appearances, as well as environmental evaluative meanings. Synthesizing quantitative and qualitative data analysis outcomes, these Storyboards
epitomized the complicatedly “entangled” human, spatial, and temporal dimensions of pedestrians’
dynamic visual experiences: sequential views were generated in the ecological process whereby pedestrians meaningfully interacted with their surrounding spaces and objects through intentional bodily motions and head gestures.
Interpretation and Aesthetic Evaluation of Dynamic Visual Qualities
Through constant within-case and cross-case comparisons as required by the case study paradigm (Miles and Huberman 1994, Stake 2005, Yin 2003a), an attempt was made to interpret the Comprehensive Storyboards to identify thematic patterns of different dynamic visual experiences. Research participants joined to facilitate this qualitative transformation of
only concerns the portion of 3D isovist that falls into a
mixed-method data analysis results. The resulting narrative data can accommodate further examination and comparison of empirical research findings from different sites.
Some visual formal themes started to surface in this process. Key views in a visual sequence accounted for those rare, impressive moments of abrupt visual transitions. Key views sometimes appeared adjacent to ordinary views, signifying dramatic view changes standing out of the context. In other times, quasi-key views heralded key views. That means a few consecutive views showed progressively more difference from one another. Also, the temporal distance between individual or clustered key views
varied significantly. The “wavelength” of key view
occurrence was fleeting or prolonged, suggesting that strong visual impressions came into being at a fast or slow pace. Key views could appear to be somewhat evenly spaced out in the timeline, concentrated on one end, or scattered in a seemingly random manner.
That variation tells key views’ changing rhythmic patterns. Studying Comprehensive Storyboards, evidence was also identified to where key views occurred on pedestrians walking routes and what
constituted the significant visual content differences in these views. Key view could come up because the spatial relationship dramatically altered, or the overall material appearance of the environment became distinct. Engaging these formal themes in dynamic vision, researchers or designers concerned with dynamic vision can build a narrative account with a set of qualitative attributes to portray dynamic visual forms. Specifically, the Protocol introduces four qualitative attributes in the descriptive narratives:
contrast, tempo, rhythm, and timing:
(1) Contrast measures how the impressive, distinct views stand out from the rest of the sequential views. A visual sequence has a high level of contrast if key views immediately follow ordinary views, rendering a drama of sensational visual impacts, while a low contrast level implies graduality in the sequential visual form. In the Urbanscape Studio, all six cases of dynamic visual experiences demonstrated instances of contrast over occasions such as the pedestrian turned around a street corner
or rapidly changed her sightline to look into/away from a building facade (Figure 6).
(2) Tempo describes the frequency of powerful visual impressions. The time intervals between key views measure tempo. In the
Urbanscape Studio, some cases’
Comprehensive Storyboards showed
streams of successive key views in the timeline. These clustered key views manifest rapid tempos of significant view changes occurring as frequently as every two seconds. There were also cases showing relatively slow tempos with individual key views being apart for over 20 seconds. Four out of six cases featured mixtures of fast and slow tempos.
(3) Rhythm outlines the overall temporal composition of sequential views and determines if they display any periodical pattern. Key views and quasi-key views in a visual sequence may emerge in one or several regular intervals, giving a rhythmic characteristic. The sequential visual form appears structured with abundant traits of rhythm or becomes free-from if no obvious rhythm is present. Some cases in the Urbanscape Studio demonstrated rhythmic qualities as key views or clustered key views appeared periodically when the pedestrian reached street or alley connections.
(4) Timing illustrates the construction of key views. While other qualitative attributes mainly interpret Charts of View Differences, the attribute of timing focuses on the relationship between all three constitutive charts of the Comprehensive Storyboards. Studying the Comprehensive Storyboards of all six research cases, the team identified when and where key views took place. They found that sometimes, the occurrence of key views corresponded with profound changes in the spatial relationship or physical appearance. Yet there were also occasions where these variations were independent of each other.
The qualitative transformation of the graphic Storyboards in terms of contrast, tempo, rhythm, and timing informed aesthetic evaluations of dynamic visual experiences. Although the Urbanscape Studio involved just six participating residents and their recorded walking experiences revealed a very small fraction of all possible sequential visual forms in downtown Watertown, several outstanding aesthetic issues were identified and these design implications were explored together with participating Watertown residents:
(1) Contrast Issue:
Greater contrast in a sequential visual form gives an unambivalent sense of motion or location change in the urban environment. For the visual data collected in the
Therefore, people may prefer greater contrast in dynamic vision for the enhancement of valuable environmental meanings. However, if contrast unnecessarily accents trivial or uninviting urban elements, then designers shall modify the built environment to help dampen or even eliminate such unfavorable instances of contrast. In general, a pleasant dynamic visual experience should contain a mixture of key views that emerge with and without contrast. Comparatively, a graceful melody tends to have clear, high-pitched notes accompanied by mellow crescendos.
(2) Tempo and Rhythm Issue:
Extreme tempos may spawn “a sense of oppression or boredom,” and therefore, some argued that the ideal should be “an optimal range” of time intervals (Appleyard,
experiences. In the Urbanscape Studio group, some members believed that reaching street intersections should define a dominating rhythm of key views and
“overshadow” other “distractions” between
intersections, such that pedestrians can better appreciate the distinct identities and historical values of these street intersections. But other research members
and residents found some “deviations” from
a rigid, overarching rhythmic pattern could also generate attraction, especially when the
“deviations” were induced by visual contacts with “valued objects” associated with
positive environmental meanings, such as an artistic sculpture or a visually pleasant and informative commercial sign. Henceforth, the rhythm issue discussion naturally shifted to the discussion of the timing issue.
Figure 7.An instance of contrast introduced by the “framing” effect of trees and buildings (Case 06).
(3) Timing Issue:
Good timing means key views focus on favored places or objects in the urban environment, and these key views coincide with orchestrated variations in the spatial relationship and physical appearance (Figure
8). This definition draws on Appleyard et al.’s
argument that the most powerful experiences would occur when space, motion, and meaning reinforce each other (1964a). In the Urbanscape Studio, the aesthetic assessment and discussion about timing turned out to be the most productive and design relevant. Compared with other attributes for describing dynamic vision, timing was less conditional upon certain human factors, for example, the
pedestrian’s walking speed or habitual head
movements. Design for preferable timing qualities means accommodating concurrency of visual, spatial, physical appearance changes at preferred locations.
Adapting geometrical forms or materiality could embellish dynamic visual experiences with better timing qualities in a walk.
Dynamic Visual Simulation and Evaluation-in-Design
During the research stage of the Urbanscape Studio project, team members engaged the complexity of dynamic visual phenomena by processing massive data in varied formats with both quantitative and qualitative analytic techniques and by synthesizing findings in narratives about thematic dynamic visual patterns. As these narratives were presented to Watertown residents and an attempt to discuss aesthetic issues pursued, the research team discovered more tacit and delicate aspects of dynamic vision, especially those about personal life histories behind the environmental meanings of buildings, storefronts, trees, and sculptures in downtown Watertown. Exposure to the contextual information of research data stimulated the team to reach the following understandings before they advanced to the design stage for devising
Figure 8. An instance of good timing: concurrency of visual, spatial, and physical appearance changes at a pocket park attributed with positive environmental meanings (Case 06). (Author’s modification of the original work by Rebecca
four qualitative attributes of dynamic vision confirm the indirect but traceable effect of the physical environment. Good urban design can improve dynamic vision for many alternate walking and seeing behaviors, while random or hackneyed design limits
pedestrians’ ability to pursue enjoyable dynamic visual experiences.
(3) There are no universal or disinterested aesthetic standards for dynamic visual qualities. Researchers and designers need to participate in the dialogue with everyday users to establish contingent, contextualized, and value-laden dynamic
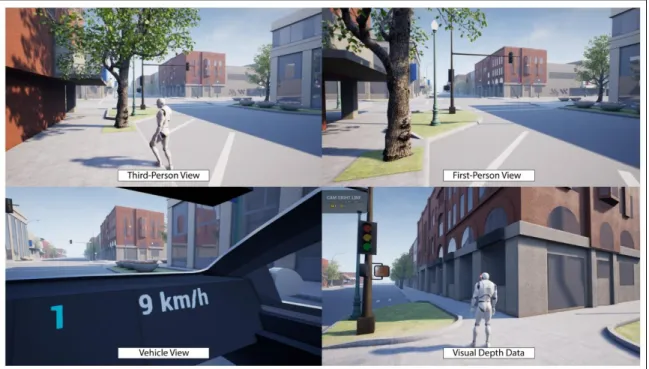
decision-making. The research team built a real-time design simulation program with Unreal Engine 4, a game engine for developing high-quality interactive 3D environments. The simulation program furnished a digital replica of downtown Watertown that had all streets, sidewalks, buildings, and major environmental elements visualized with photorealistic 3D graphics. Users of the program can control a humanoid character to walk around in the fully visualized downtown area, yielding simulated dynamic views (Figure 9). The program also provides functionalities of human behavioral simulation, daylight simulation, building massing operations, and visual depth measurement. It is an intuitive 3D
concept design tool optimized for architectural formal studies.
The evaluation-in-design method featuring digital simulation significantly improved productivity and
11 Research participants from Watertown were not able to join the research team in the design simulation and
knowledge development as the research team experimented with alternate design proposals in the simulated urban environment, even though the simulation disregarded subjective environmental meaning.11 They reconstructed real walking routes in
evaluation process due to scheduling difficulties in the Urbanscape Studio. Therefore, there was a discrepancy
implications of urban infill projects and developed formal massing schemes that could induce satisfactory dynamic visual experiences. The
simulation program’s massing functionality can
between those who evaluated design (students as designers) and those who were the end users of the designed environment (Watertown residents), a situation that Pre-Occupancy Evaluation using simulative methods should avoid (Shin et al. 2017). Therefore, the analysis of simulated data did not
as many walking occasions as possible. Aesthetic issues of contrast and timing arose as the main design concerns in the cyclic conception-simulation-evaluation loop of that regulated design process (Figure 11).
include any qualitative subjective environmental meanings. Technically, the Protocol encourages the participations of end users in design evaluation.
CONCLUSION & DISCUSSION
Theoretical and Methodological Relevance
Positing a non-fragmental understanding of humans’
behavioral and cognitive relations with the environment, the proposed Dynamic Visual Research and Design Protocol advocates the so-called
“transactional worldview” for studying environment -behavior relations (EBR) (Altman and Rogoff 1987). Application of the Protocol propels an ongoing theoretical migration in social and environmental research whereby holistic, person-in-environment conceptual frameworks are supplanting conventional
“subjectivist” or “objectivist” research models (see Norman 1993, Rappaport 1998, Case and Jawitz 2004, Schliemann 1998, Richardson et al. 2008).
Since the 1980s, empirical research studies of complex person-environment phenomena have increasingly reflected a paradigmatic shift toward the so-called situativity theory (Greeno and Moore 1993, Carello 1993). Developed in the ecological tradition of James J. Gibson., situativity theory considers the cognitive agent and the environment mutually defined entities of one and the same ecological system (Gibson 1966, 1979, Gibson, Reed, and Jones 1982, Greeno 1994, Reed 1988). Situativity theory has been introduced in environmental psychology, sociology, ecology, education, and the intersections of these fields to engage research subjects in a manner imbued with holism and multi-dimensionality (e.g. Turvey and Shaw 1995, Smith and Conrey 2010, Oyserman 2011, Heft 2001, Barsalou 2008).
Dynamic visual experiences are holistic phenomena, the investigation of which resides in the expanding territory of situativity theory. Stemming from the constant interaction between the observer in motion and the surrounding physical environment, dynamic vision manifests reciprocal person-environment relationships. In line with the situativity theory, the Protocol collects and analyzes first-person visual forms, intending to delineate the contingent
situations where a mobile observer is “entangled”
with a unique segment of the visual environment that corresponds to the observer’s active walking and
seeing behaviors. Each sequential view encapsulates an ephemeral, about-to-change person-in-environment situation conditioned by broader temporal-spatial settings. On the other hand, the Protocol understates the data that measure objective physical attributes or subjective dispositions in
disconnection, for example, characteristics of urban elements described from a fixed and detached perspective. Exercising the Protocol should advance holistic research and design strategies in architecture and urban planning.
For most urban researchers and designers, it is an
unfamiliar action to examine humans’ dynamic visual
experiences that subsume a plethora of facts. Dynamic visual data are multi-faceted and considerably more complicated than common design research data such as architectural languages, scales, proportions, materiality, density, and demographics. There is also a deficiency of standard methodologies for visual data analysis. Classic quantitative methods or word-based qualitative methods prescribe no normative procedures with which to deal with visual data (Prosser 1998). With the aid of digital automation, the Protocol embodies several methodological innovations necessary for dynamic visual research and its incorporation in the design process.
First, the Protocol introduces efficient and reliable first-person visual data collection methods that contribute to raising the overall research quality. Dynamic visual research inherently solicits a fusion of observational methods and self-reports to yield immersive visual data. Conventional observational methods collect data from a detached, third-person perspective (Sussman 2016, Paterson, Bottorff, and Hewat 2003), while a self-report approach relies on
the research participant to serve as the researcher’s
surrogate and record his or her perception or behaviors (Farbstein, Wener, and McCunn 2016, Hurlburt and Heavey 2001). In terms of research biases, observation reflects the researcher's subjectivity, and self-reports reflect research
participants’ individuality. Though Cullen and
Appleyard et al. attempted to merge these two methods in their studies, technological limits prevented them from minimizing human bias in data collection. The use of wearable recording devices in the Protocol can purge extraneous subjective influences from researchers or participants, ensuring that data collection occurs in an unprejudiced way. This methodological advantage translates to elevated research qualities as research results will be more credible and dependable (Sussman 2016, Bryman, Becker, and Sempik 2008, Lincoln and Guba 1985).
confirmability and transferability (see Mårtensson et al. 2016, Groat and Wang 2002, Marshall and Rossman 2006), encouraging adoption of the Protocol in diverse dynamic visual research and design projects.
Finally, the Protocol offers a practical design workflow to bridge the cleavage between empirical research and design activities. The Protocol is devised to be field-operable and friendly to designers with limited or no research expertise. Its logistic requirements are minimal: there is no demand for specialized lab-grade equipment or professional data analysis software. The simulation program used in the Urbanscape Studio does take sophisticated visual scripting skills to build, but there are some readymade real-time dynamic visualization tools (e.g., Enscape, Twinmotion) that can fulfill its main functions.12 The Protocol also requires few prerequisite research skills. Instead, designers can develop their research capabilities when they utilize the Protocol to gain emergent research findings of real-world dynamic visual data. Through the cinematic storyboarding approach, the Protocol enables designers to unearth covert patterns in dynamic visual simulation for design evaluation. Thus, the Protocol enlightens designers about opportunities and constraints regarding dynamic vision. The simulation-based evaluation-in-design process diminishes the role distinction between researchers and designers.
12 Both Enscape and Twinmotion are widely used real-time architectural visualization programs. They can simulate some types of dynamic visual experiences by producing 3D-walkthrough animations.
humans’ visual perception in the 3D environment.
This assumption is pivotal as it justifies the collection and analysis of 2D sequential views as research data. Alternately speaking, the legitimacy and coherence of the Protocol are dependent upon the extent to which we accept 2D dynamic views captured by action cameras and compared by computer algorithms as true indicators of dynamic vision.
Since the 1960s, environmental psychologists have been debating how images on 2D retinas establish
humans’ perception of 3D spaces and objects (see Gibson 1979, Cornsweet 1970, Gogel 1963). Many mysteries still cloud the exact mechanism whereby human eyes process external stimuli and transfer articulated sensual inputs to the mind. However, it is now a common observation that human vision absorbs more information from the environment than any single video recording device can do (Gordon 2004, French 2016). The 2D visual sequences recorded by action cameras leave out a range of integral components of visual perception, for example, the stereoscopic sense of spatial depth, the tracking of moving objects at different speeds, and the dynamic exposure adaptation to environmental lighting. These overlooked components could modify
people’s dynamic visual experiences. For the
Urbanscape Studio, some of these visual components were not significant because of special environmental conditions during the field research13 , which may not be available in other research projects. The sole use
of 2D visual data also restricts the Protocol’s
effectiveness to study view-to-view differences. While combining multiple algorithms for image comparison may help enhance research credibility and dependability, the omission of 3D depth information from 2D images may still distort comparison results. The study of simulated dynamic visual forms showed that changes in spatial relationships were not always as readily acknowledged as changes in physical appearances by the pixel-based comparison program (Figure 12).
Another major restriction derives from the Protocol’s
emphasis on the temporal and formal characteristics of dynamic vision. Although the production of
Comprehensive Storyboards involved qualitative data analysis regarding environmental meanings, the final narratives as descriptive accounts predominantly characterize the temporal composition of sequential visual forms. Environmental meanings were also absent in the simulation program that the team utilized for design studies. It is worth noting that melodic patterns of sequential views alone cannot guarantee satisfactory dynamic visual experiences. People also expect to see spaces and objects with positive meanings. A pedestrian would have a terrible time walking and seeing when strolling down the streets of a ghost town, a place with ill-maintenance and unhygienic conditions, or a city teemed with buildings lacking architectural value. Cinematic analyses following the Protocol cannot divulge negative environmental meanings.
Finally, the Protocol does not engage other sensual data vis-à-vis acoustic, olfactory, and tactile qualities. Research has found that multiple human senses are
intertwined and collectively affect humans’
environmental evaluation (Rivlin 1984, Henshaw 2012). There are occasions that non-visual senses are intimately linked with and substantially impact dynamic visual experiences. For example, a leisure walk on a beach may appear to be quite monotonous in terms of its cinematic qualities: tempo is extremely slow, and contrast barely exists. However, beach walking is a holistic, multi-sensual experience. The dynamic visual experience is enmeshed with and reinforced by multiple acoustic and tactile sensations: soothing waves periodically crashing on the beach, rhythmic pitching sounds from gliding seagulls, and the warm, soft sand slipping up around feet and even in between toes. Traveling in urban environments is also multi-sensual. While the current form of the Protocol focuses on the visual aspect, vision may not be the most dominant or decisive ingredient in walking and seeing experiences.
Future Research Directions
Kevin Lynch once lamented that urban design still
“aims to make an object … according to the will of a gifted professional”, but “true city design—dealing directly with the ongoing sensed environment of the city, in collaboration with the people who sense it— hardly exists today ”(Lynch, Banerjee, and Southworth 1990, 254). The Protocol is posed to be a systematic approach to understand and improve
humans’ dynamical vision in city environments, and therefore it endeavors to achieve Lynch’s expectation
for urban design. Recognizing the Protocol’s
advantages and limitations, the author predicts three future research directions in terms of digital
motivating more design professionals to regard visual design qualities as a vital design objective and to perform simulation-based design evaluation.
The current data analysis procedure, as stated in the Protocol, uses multiple software programs in separation. Although each program can efficiently execute a defined visual data processing or
future real-time 3D simulation programs to be able to export more types of simulation data than screen recordings. If designers can access real-time simulation data about visible spaces such as view orientations and depths, they could efficiently generate multiple Charts of Spatial Relationships to expedite the production of comprehensive cinematic storyboards.
The Protocol’s design simulation methods also need
continual upgrades to effect tangible changes in everyday design activities. Historical analog simulation methods exposed a necessity of obtaining and utilizing visual depth data to alleviate the limit of 2D images in simulating bifocal view field of the human eyes (Bosselmann 1993). The Protocol’s
introduction of digital simulation makes it feasible to obtain first-person views along with the synchronized depth information as Unreal Engine can ably generate visual depth data in graphic and numeric formats
(Figure 13). Yet the Protocol’s cinematic
storyboarding procedure should get some revision to better incorporate these data in data analysis. Another possible simulation development would be leveraging state-of-the-art digital technologies to simulate multiple human senses14. Multi-sensual design simulation will help designers to properly interpret dynamic visual research findings by contextualizing dynamic vision in the complete, multi-sensual process of person-environment transactions. Simulation and involvement of non-visual sensual data in design will promote the long acclaimed human-centered designs that mobilize all five senses and meets delicate human needs (Frampton 1983, Lynch, Banerjee, and Southworth 1990). The Dynamic Visual Research and Design Protocol should evolve to be an integral portion of the multi-sensory design agenda, which has been pursued by industrial designers but remains somewhat unfamiliar to the designers of the built environment.
The extensive use of data visualization in the analysis, presentation, and utilization of research data speaks to the significance of the Protocol for user participation and public engagement. Data visualization has been an influential trend transforming the landscape of contemporary quantitative and qualitative investigations (Verdinelli and Scagnoli 2013). For design researchers concerned with community participation in the planning and design process, visualized presentations lubricate the communication between professionals and laypersons (Sanoff 1991, Abendroth and Bell 2016, Al-Kodmany 1999). In the Urbanscape Studio project, cinematic storyboards that synthesized eye-level views, analytic graphs, and descriptive diagrams eased dialogues between the design team members
14 Unreal Engine can already simulate stereo acoustic experiences, precisely duplicating real world sound behaviors such as reflection, diffraction, and
and Watertown residents, empowering the locals with no design backgrounds to talk about elusive visual experiential qualities.
Perhaps the computerized research-simulation nexus will eventually trigger a paradigmatic shift toward genuine user-centered design. Design theorists have recognized the user as an active and creative factor in design (Hill 2003, 1998, Cupers 2013), and the design industry has witnessed the social and economic changes that demand greater involvement of users in design (Nicol and Pilling 2000). There has also been a decades-long tradition of public-interest design and participatory design initiatives in Europe and America (Sanoff 1978, 2000, Sanoff and Toker 2003, Dell'Era and Landoni 2014, Bell and Wakeford 2008) sharing a general aspiration to include populations traditionally underserved by architects and to significantly engage end-users in design. However, the predominant business model at present is still designer-centered, with end-users’ influence being negligible in the
design and construction process. This condition is due to many real-world challenges, such as the mounting cost to gather, translate, and process user inputs, the difficulty of communicating with users, and the use of conventional design and representation tools that repeatedly cement a designer-centered mindset. Widespread integration of dynamic visual research in practical design activities, if accomplished soon, will help remove some of these hindrances. Computational methods for design research and simulation will inspire designers to see and
experience from the user’s perspective, therefore
rejuvenating their understanding of the relationship between humans and the built environment.
World views in psychology: Trait, interactional, organismic, and transactional perspectives." In
Handbook of environmental psychology, edited by Daniel Stokols and Irwin Altman, 7-40. New York: Wiley.
Appleyard, D., and K H Craik. 1974. "The Berkeley Environmental Simulation Project: its use in environmental impact assessment." In Environmental impact assessment: Guidelines and Commentary, edited by T. G. Dickert and Downey K. R., 121-125. Berkeley: University of California Extension. https://doi.org/10.1002/ncr.4100511020
Appleyard, Donald, Kevin Lynch, and John R Myer. 1964a. The view from the road. Cambridge: Published for the Joint Center for Urban Studies of the Massachusetts Institute of Technology and Harvard University by the M. I. T. Press, Massachusetts Institute of Technology.
Appleyard, Donald, Kevin Lynch, and John R Myer. 1964b. The view from the road. Cambridge: The MIT Press.
Bacon, Edmund N. 1967. Design of cities. London,: Thames & Hudson.
Banerjee, Tridib, and Anastasia Loukaitou-Sideris. 2011. Companion to Urban design. London ; New York: Routledge. https://doi.org/10.1111/j.1467-9787.2012.00784_9.x
Banks, Marcus. 2007. "The place of visual data in social research a brief history." In Using visual data in qualitative research, edited by Marcus Banks. Thousand Oaks, California: SAGE Publications.
Barsalou, Lawrence W. 2008. "Grounded cognition."
Annual Review of Psychology 59 (1):617-645.
and isovist fields." Environment and Planning B 6:47-65. https://doi.org/10.1068/b060047
Berry, David M. 2012. Understanding digital humanities. Houndmills, Basingstoke, Hampshire ; New York: Palgrave Macmillan.
Bosselmann, Peter. 1984. "The Berkeley Environmental Simulation Laboratory: A 12 Year Anniversary." Berkeley Planning Journal 1 (1):150-160. https://doi.org/10.5070/bp31113219
Bosselmann, Peter. 1993. "Dynamic Simulations of Urban Environments." In Environmental Simulation, edited by Stokols D., 279-302. Boston, MA: Springer. https://doi.org/10.1007/978-1-4899-1140-7_11
Brown, Katrina Myrvang, Rachel Dilley, and Keith Marshall. 2008. "Using a Head-Mounted Video Camera to Understand Social Worlds and Experiences." Sociological Research Online 13 (6):1-10. doi: (6):1-10.5153/sro.1818.
Bryman, Alan, Saul Becker, and Joe Sempik. 2008. "Quality Criteria for Quantitative, Qualitative and Mixed Methods Research: A View from Social Policy."
International Journal of Social Research Methodology
11 (4):261-276. doi: 10.1080/13645570701401644.
Canter, David. 1977. The Psychology of Place. London Architectural Press.
Canty, Morton John. 2019. Image analysis, classification and change detection in remote sensing : with algorithms for Python. New York: Taylor & Francis Group.
https://doi.org/10.1201/9780429464348
Routledge.
https://doi.org/10.1177/147447409600300109
Case, J., and J. Jawitz. 2004. "Using situated cognition theory in researching student experience of the Workplace." Journal of Research in Science Teaching
41 (5):415-431. https://doi.org/10.1002/tea.20013
Chalfen, Richard. 2014. "‘Your panopticon or mine?’ Incorporating wearable technology’s Glass and GoPro
into visual social science." Visual Studies 29 (3):299-310. doi: 10.1080/1472586X.2014.941547.
Cornsweet, Tom N. 1970. Visual perception. New York: New York, Academic Press.
Cullen, Gordon. 1961. The concise townscape. New York,: Reinhold Pub. Corp.
Cullen, Gordon. 2003. "Introduction to townscape." In Time-saver standards for urban design, edited by Donald Watson, Alan J. Plattus and Robert G. Shibley. New York: McGraw-Hill.
Cupers, Kenny, ed. 2013. Use matters: An alternative history of architecture. London; New York: Routledge.
Dell'Era, C., and P. Landoni. 2014. "Living Lab: A Methodology between User-Centred Design and Participatory Design." Creativity and Innovation Management 23 (2):137-154.
https://doi.org/10.1111/caim.12061
Farbstein, Jay, Richard E. Wener, and Lindsay J. McCunn. 2016. "Planning the Built Environment: Programming." In Research methods for environmental psychology, edited by Robert Gifford, 221-248. West Sussex, UK: Wiley Blackwell. https://doi.org/10.1002/9781119162124.ch12
Fisher-Gewirtzman, Dafna. 2014. "3D LOS Visibility
Analysis Model: Incorporating
Quantitative/Qualitative Aspects in Urban Environments." In Geodesign by Integrating Design and Geospatial Sciences, edited by Danbi J. Lee, Eduardo Dias and Henk J. Scholten, 219-236. New York: Springer. https://doi.org/10.1007/978-3-319-08299-8_14
Fisher-Gewirtzman, Dafna, Michael Burt, and Yigal Tzamir. 2003. "A 3-D Visual Method for Comparative Evaluation of Dense Built-up Environments."
Environment and Planning B: Planning and Design 30 (4):575-587. doi: 10.1068/b2941.
Frampton, Kenneth. 1983. "Towards a Critical Regionalism: Six points for an architecture of resistance." In The Anti-aesthetic : essays on postmodern culture, edited by Hal Foster, xvi, 159 p. Port Townsend, Wash.: Bay Press.
French, Robert. 2016. "Apparent Distortions in Photography and the Geometry of Visual Space."
Topoi 35 (2):523-529. doi: 10.1007/s11245-015-9316-5.
Gehl, Jan. 2010. Cities for people. Washington, DC: Island Press. https://doi.org/10.5822/978-1-61091-525-0_3
Gehl, Jan, and Birgitte Svarre. 2013a. "Counting, Mapping, Tracking and Other Tools." In How to study public life, edited by Jan Gehl and Birgitte Svarre, 21-80. Washington, DC: Island Press.
Gehl, Jan, and Birgitte Svarre. 2013b. How to study public life. Washington, DC: Island Press. text.
Gibson, James J. 1966. The Senses Considered as Perceptual Systems. Boston: Houghton Mifflin.
Gibson, James J. 1979. The Ecological Approach to Visual Perception. Boston: Houghton Mifflin.
Gibson, James J., Edward Reed, and Rebecca Jones. 1982. Reasons for Realism: Selected Essays of James J. Gibson, Resources for ecological psychology. Hillsdale, N.J.: L. Erlbaum.
https://doi.org/10.2307/1575202
Gifford, Robert. 2016. "Introduction." In Research methods for environmental psychology, 1-8. West Sussex, UK: Wiley Blackwell.
Gogel, Walter C. 1963. The visual perception of spatial extent. Edited by Institute Civil Aeromedical Research. Oklahoma City, Okla.: Oklahoma City, Okla. : Federal Aviation Agency, Civil Aeromedical Research
Institute, Aeronautical Center.
https://doi.org/10.1037/e440062004-001
Gordon, Ian E. 2004. Theories of visual perception. Edited by Inc NetLibrary. New York: Psychology Press.
Greeno, James G. 1994. "Gibson's affordances."
Psychological Review 101 (2):7p.
https://doi.org/10.1207/s15516709cog1701_3
Hill, Jonathan. 1998. Occupying architecture : between the architect and the user. London ; New York: Routledge.
Hill, Jonathan. 2003. Actions of Architecture: Architects and Creative Users. London ; New York: Routledge.
Howard, Ian P., and Brian J. Rogers. 1995. Binocular vision and stereopsis, Oxford psychology series. New York: Oxford University Press.
Hurlburt, Russell T., and Christopher L. Heavey. 2001. "Telling what we know: describing inner experience."
Trends in Cognitive Sciences 5 (9):400-403. https://doi.org/10.1016/s1364-6613(00)01724-1
Hussain, Masroor, Dongmei Chen, Angela Cheng, Hui Wei, and David Stanley. 2013. "Change detection from remotely sensed images: From pixel-based to object-based approaches." ISPRS Journal of Photogrammetry and Remote Sensing 80 (C):91-106. doi: 10.1016/j.isprsjprs.2013.03.006.
Jacobs, Allan B. 1993. Great streets. Cambridge, Mass.: MIT Press.
Johnson, R. B., and A. J. Onwuegbuzie. 2004. "Mixed Methods Research: A Research Paradigm Whose Time Has Come." Educational Researcher 33 (7):14-26. https://doi.org/10.3102/0013189x033007014
Lincoln, Yvonna S., and Egon Guba. 1985. "Establishing Trustworthiness." In Naturalistic Inquiry, edited by Yvonna S. Lincoln and Egon Guba. Beverly Hills, CA: SAGE Publications. https://doi.org/10.1177/1077800408325258
Lu, Yi, Zhonghua Gou, Yu Ye, and Qiang Sheng. 2019. "Three-dimensional visibility graph analysis and its application." Environment and Planning B: Urban
Mass.: MIT Press.
Lynch, Kevin, and Gary Hack. 1984. "Visual Form." In
Site planning, 54-87. Cambridge, Mass.: MIT Press.
Marshall, Catherine, and Gretchen B. Rossman. 2006.
Designing Qualitative Research. 4th ed. Thousand Oaks, CA: Sage Publications.
Mårtensson, Pär, Uno Fors, Sven-Bertil Wallin, Udo Zander, and Gunnar H. Nilsson. 2016. "Evaluating research: A multidisciplinary approach to assessing research practice and quality." Research Policy 45 (3):593-603.
https://doi.org/10.1016/j.respol.2015.11.009.
Miles, Matthew B., and A. Michael Huberman. 1994.
Qualitative Data Analysis: An Expanded Sourcebook
2nd ed. Thousand Oaks, CA: Sage Publications.
Moore, Steven A. 2017. "Knowledge, Education, Power and Production: Public Interest Design in North America." Journal of Architectural Education 71 (1):46-55.
https://doi.org/10.1080/10464883.2017.1260921
Mullins, M. 2006. "Interpretation of simulations in interactive VR environments: Depth perception in cave and panorama." Journal of Architectural and Planning Research 23 (4):328-340.
Nicol, David, and Simon Pilling. 2000. "Section 1: Communication: developing sensitivity to the nedds of users and clients." In Changing architectural education : towards a new professionalism, edited by David Nicol and Simon Pilling, 41-116. London ; New York: E & FN Spon.