Performance of the inFLUenza
Patient-Reported Outcome (FLU-PRO) diary in
patients with influenza-like illness (ILI)
John H. Powers, III1*, Elizabeth D. Bacci2, Nancy K. Leidy3, Jiat-Ling Poon3, Sonja Stringer3, Matthew J. Memoli4, Alison Han4, Mary P. Fairchok5,6,7, Christian Coles6,7, Jackie Owens6,7, Wei-Ju Chen6,7, John C. Arnold8, Patrick J. Danaher9, Tahaniyat Lalani7,10, Timothy H. Burgess6,11, Eugene V. Millar6,7, Michelande Ridore12, Andre´s Herna´ndez13,
Patricia Rodrı´guez-Zulueta14, Hilda Ortega-Gallegos15, Arturo Galindo-Fraga15, Guillermo M. Ruiz-Palacios15, Sarah Pett16,17,18,19,20, William Fischer17,21, Daniel Gillor17,22,
Laura Moreno Macias17,23, Anna DuVal24, Richard Rothman24, Andrea Dugas24, M. Lourdes Guerrero15
1 Clinical Research Directorate/Clinical Monitoring Research Program, Leidos Biomedical Research, Inc., NCI Campus at Frederick, Frederick, MD, United States of America, 2 Evidera Evidence, Value & Access by PPD, Seattle, WA, United States of America, 3 Evidera Evidence, Value & Access by PPD, Bethesda, MD, United States of America, 4 National Institutes of Allergy and Infectious Diseases, NIH, Bethesda, MD, United States of America, 5 Madigan Army Medical Center, Fort Lewis, WA, United States of America, 6 Infectious Disease Clinical Research Program, Department of Preventive Medicine and Biostatistics, Uniformed Services University, Bethesda, MD, United States of America, 7 Henry M. Jackson Foundation for the Advancement of Military Medicine, Rockville, MD, United States of America, 8 Naval Medical Center, San Diego, CA, United States of America, 9 Defense Institute for Medical Operations, San Antonio, TX, United States of America, 10 Naval Medical Center, Portsmouth, VA, United States of America, 11 Walter Reed National Military Medical Center, Bethesda, MD, United States of America, 12 Children’s National Medical Center, Washington, DC, United States of America, 13 Instituto Nacional de Enfermedades Infecciosas, Mexico City, Mexico, 14 Hospital General Dr. Manuel Gea Gonza´lez, Mexico City, Mexico, 15 Instituto Nacional de Ciencias Me´dicas y Nutricio´n Salvador Zubira´n, Mexico City, Mexico, 16 UCL, London, United Kingdom, 17 INSIGHT Influenza Study Groups, Rochester, MN, United States of America, 18 Institute of Clinical Trials and Methodology, University College, London, United Kingdom, 19 Institute for Global Health, University College, London, United Kingdom, 20 Kirby Institute, University of New South Wales, Kensington, Australia, 21 University of North Carolina, Chapel Hill, NC, United States of America, 22 University of Cologne, Cologne, Germany, 23 Hospital General de Agudos JM Ramos Mejia, Buenos Aires, Argentina, 24 Johns Hopkins University School of Medicine, Baltimore, MD, United States of America
Abstract
Background
The inFLUenza Patient Reported Outcome (FLU-PRO) measure is a daily diary assessing signs/symptoms of influenza across six body systems: Nose, Throat, Eyes, Chest/Respira-tory, Gastrointestinal, Body/Systemic, developed and tested in adults with influenza.
Objectives
This study tested the reliability, validity, and responsiveness of FLU-PRO scores in adults with influenza-like illness (ILI).
Methods
Data from the prospective, observational study used to develop and test the FLU-PRO in influenza virus positive patients were analyzed. Adults (18 years) presenting with influenza
a1111111111 a1111111111 a1111111111 a1111111111 a1111111111
OPEN ACCESS
Citation: Powers JH, III, Bacci ED, Leidy NK, Poon
J-L, Stringer S, Memoli MJ, et al. (2018) Performance of the inFLUenza Patient-Reported Outcome (FLU-PRO) diary in patients with influenza-like illness (ILI). PLoS ONE 13(3): e0194180.https://doi.org/10.1371/journal. pone.0194180
Editor: Justin R. Ortiz, University of Washington,
UNITED STATES
Received: September 1, 2017
Accepted: February 26, 2018
Published: March 22, 2018
Copyright: This is an open access article, free of all
copyright, and may be freely reproduced, distributed, transmitted, modified, built upon, or otherwise used by anyone for any lawful purpose. The work is made available under theCreative
Commons CC0public domain dedication.
Data Availability Statement: All relevant data are
within the paper and its Supporting Information files.
Funding: This project has been funded in whole or
symptoms in outpatient settings in the US, UK, Mexico, and South America were enrolled, tested for influenza virus, and asked to complete the 37-item draft FLU-PRO daily for up to 14-days. Analyses were performed on data from patients testing negative. Reliability of the final, 32-item FLU-PRO was estimated using Cronbach’s alpha (α; Day 1) and intraclass correlation coefficients (ICC; 2-day reproducibility). Convergent and known-groups validity were assessed using patient global assessments of influenza severity (PGA). Patient report of return to usual health was used to assess responsiveness (Day 1–7).
Results
The analytical sample included 220 ILI patients (mean age = 39.3, 64.1% female, 88.6% white). Sixty-one (28%) were hospitalized at some point in their illness. Internal consistency reliability (α) of FLU-PRO Total score was 0.90 and ranged from 0.72–0.86 for domain scores. Reproducibility (Day 1–2) was 0.64 for Total, ranging from 0.46–0.78 for domain scores. Day 1 FLU-PRO scores correlated (0.30) with the PGA (except Gastrointestinal) and were significantly different across PGA severity groups (Total: F = 81.7, p<0.001; sub-scales: F = 6.9–62.2; p<0.01). Mean score improvements Day 1–7 were significantly greater in patients reporting return to usual health compared with those who did not (p<0.05, Total and subscales, except Gastrointestinal and Eyes).
Conclusions
Results suggest FLU-PRO scores are reliable, valid, and responsive in adults with influ-enza-like illness.
Introduction
Influenza (flu) is characterized by an array of symptoms, including chills, cough, sore throat, runny or stuffy nose, fatigue, muscle/body aches, and potentially diarrhea and vomiting, with symptoms ranging in severity and duration [1]. In the absence of known influenza virus, this constellation of symptoms can be caused by a variety of other viruses and is often diagnosed as influenza-like ill-ness (ILI) [2]. While most patients recover from ILI, the symptoms can negatively impact daily activities and functioning. Symptoms of ILI often closely approximate influenza symptoms such that the two previously have been indistinguishable. Therefore, a symptom measure useful in influ-enza may also be useful for evaluating the presence and severity of symptoms of ILI.
The InFLUenza Patient-Reported Outcome (FLU-PRO) measure was designed to evaluate the presence, severity, and duration of influenza symptoms in clinical trials. Developed using good research practices for scale development methods [3–5], including those recommended by the US Food and Drug Administration (FDA) [6], this 32-item daily diary offers a compre-hensive evaluation of symptoms commonly experienced by patients with influenza that can be completed in5 minutes. While other measures of influenza symptom severity exist, such as the Flu-iiQ [7] and the Canadian Acute Respiratory Illness and Flu Scale (CARIFS) [8], these measures do not assess the full range of symptoms associated with varied strains of influenza and identified as important to the patients themselves [9]. Additionally, the CARIFS was devel-oped for use in children, while the FLU-PRO was develdevel-oped for studies of adults and children, with content validity shown in both groups [9]. Previous research demonstrated that the FLU-PRO is reliable, valid, and responsive to change in hospitalized and non-hospitalized adults with laboratory-confirmed influenza [10]. The purpose of these analyses was to test the
or policies of the Department of Health and Human Services, nor does mention of trade names, commercial products, or organizations imply endorsement by the U.S. Government. This study was supported by the Infectious Disease Clinical Research Program (IDCRP), a Department of Defense (DoD) program executed through the Uniformed Services University of the Health Sciences (USUHS). This project has been funded in whole, or in part, with federal funds from the National Institute of Allergy and Infectious Diseases, National Institutes of Health (NIH), under Inter-Agency Agreement (#64019). ED Bacci, NK Leidy, JL Poon, and S Stringer, are salaried employees of Evidera Evidence, Value & Access by PPD (Evidera). Evidera received funding (in whole or in part with federal funds) from the National Cancer Institute, National Institutes of Health, under Contract No. HHSN261200800001E, to conduct the study and develop this manuscript. JH Powers is an employee of Leidos Biomedical Research under a Federally Funded Research and Development Contract (FFRDC) between Leidos and the National Institutes of Health. Leidos (JHP) and Evidera (EDB, NKL, JLP, SS) provided support in the form of salaries for the above noted authors, but did not have any additional role in the study design, data collection and analysis, decision to publish, or preparation of the manuscript. The specific roles of these authors are articulated in the ‘author contributions’ section. S Pett has received funding from the Medical Research Council, UK.
Competing interests: ED Bacci, NK Leidy, JL Poon,
reliability, validity, and responsiveness of FLU-PRO scores in patients with influenza symp-toms and testing negative for the influenza virus.
Materials and methods
Study design
Data from the prospective, observational FLU-PRO development study conducted with informed consent, under the National Institute of Allergy and Infectious Diseases institutional review board approval, and in accordance with the Declaration of Helsinki, were used in these analyses. Methods and results of the primary analyses in those with laboratory-confirmed influenza are reported elsewhere [10].
Briefly, adults18 years of age seeking medical care for acute influenza symptoms at partic-ipating clinics in the US (16 sites; English-speaking), Argentina (two sites; Spanish-speaking), United Kingdom (one site; English-speaking), and Mexico (three sites; Spanish-speaking) were recruited during clinic visits. An elevated body temperature of 100˚F [37.8˚C] or greater was not an enrollment requirement. All study participants were tested for influenza using rapid influenza diagnostic tests (RIDTs), including polymerase chain reaction, rapid antigen test, and/or viral culture by nasal or nasopharyngeal swab. The performance of the FLU-PRO in those testing positive are presented elsewhere [10]. Data from subjects testing negative for the influenza virus were included in the current analysis.
In addition to the influenza diagnostic test, consented patients completed assessments of sociodemographic and clinical characteristics at baseline and a daily diary for 14 days that included the 37-item draft FLU-PRO symptom diary and nine additional questions used for FLU-PRO validation. At the Mexico site, the diary was completed via telephone interview with data entered directly into a web-based portal by the interviewer. Patients in 16 US sites, one UK site, and one Argentina site completed the survey either via interviewer-administration or self-administration via a web-based system using the subject’s personal web-enabled device.
Compliance with ethical standards
The studies were conducted in accordance with the Declaration of Helsinki, and the National Institute of Allergy and Infectious Diseases ethics committee/institutional review board requirements, and good clinical practice guidelines. Informed consent was obtained from all individual participants included in the study.
Instruments: Patient-reported Outcomes (PROs)
InFLUenza Patient-Reported Outcome (FLU-PRO). The final FLU-PRO questionnaire instructed respondents to rate the severity of 32 influenza symptoms over the past 24 hours. The presence and severity of influenza signs and symptoms are assessed across six body sys-tems affected by influenza: Nose (4 isys-tems), Throat (3 isys-tems), Eyes (3 isys-tems), Chest/Respiratory (7 items), Gastrointestinal (4 items), and Body/Systemic (11 items). A total score quantifies symptoms overall. Respondents are asked to rate each sign or symptom on a 5-point ordinal severity scale, with higher scores indicating a more severe sign or symptom. The questionnaire was developed for self-report or interviewer-administration, with slight differences in the instructions applicable for each administration.
Patient Global Assessments (PGA). The Patient Global Rating of Flu Severity is a single item to assess participants’ overall influenza symptom severity. Participants were asked to rate severity on the following scale: 0 (“No flu symptoms today”), 1 (“Mild”), 2 (“Moderate”), 3 (“Severe”), and 4 (“Very severe”). The Patient Global Assessment of Interference in Daily Activities is a single item to assess interference in daily activities due to influenza symptoms during that day. Participants rated interference on the following scale: 1 (“Not at all”), 2 (“A lit-tle bit”), 3 (“Somewhat”), 4 (“Quite a bit”), and 5 (“Very much”). The Patient Global Assess-ment of Health is a single item to assess general physical health during that day. Participants rated their physical health on the following scale: 1 (“Poor”), 2 (“Fair”), 3 (“Good”), 4 (“Very good”), and 5 (“Excellent”). Finally, a Patient Global Rating of Change in Flu Severity was used to identify stable patients for reproducibility assessment.
Return to “usual” health and activities. Patients were asked to respond (yes/no) to the following questions: “Have you returned to your usual health today?” and “Have you returned to your usual activities today?”
Statistical analyses
Statistical tests were performed in accordance with classical test theory [11] to evaluate the psy-chometric properties of the FLU-PRO total and domain scores in participants with ILI, includ-ing reliability, construct and known-groups validity, and responsiveness. These analyses were performed on the entire ILI cohort and stratified by hospitalization status.
Reliability (internal and test-retest). Cronbach’s coefficient alpha was used to estimate internal consistency reliability of the FLU-PRO Total and domain scores on day 1. Coefficients of 0.7–0.9 were pre-specified as “good” internal consistency, 0.4–<0.7 as moderate, and<0.4 as low or poor [11,12].
Data from patients whose influenza severity was unchanged over time were used to estimate the test-retest reliability of FLU-PRO Total and domain scores. Stable subjects were defined as those with “no change” on the Patient Global Rating of Change in Flu Severity over two conse-cutive days during Week 1 (i.e., day 1 to day 2, day 2 to day 3, etc.). If a subject was missing FLU-PRO scores for one of the days in the planned comparison, data for this subject was excluded from that analytical pair. Intraclass correlation coefficients (ICC from a fixed-effects model), pairedt-tests, and effect size (ES) were calculated to evaluate score reliability. ICCs were expected to be at least moderate, exceeding 0.60. Mean differences between the two observations were expected to be minimal with a small ES (<0.20).
Construct validity. The relationship between the FLU-PRO Total and domain scores and three global ratings were assessed using Spearman correlations (rs) using day 1 data, hypothe-sizing that the relationship between FLU-PRO scores and these global ratings would be moder-ate to high (rs>0.30) [13]. Correlations with the Patient Global Rating of Flu Severity were hypothesized to be strongest, while weaker correlations were expected with the more distal constructs, including the Patient Global Rating of Physical Health and the Patient Global Assessment of Interference with Daily Activities.
Known-groups validity. Analysis of variance (ANOVA) was used to compare FLU-PRO Total and domain scores across three Patient Global Rating of Flu Severity categories at day 1: “None” or “Mild”; “Moderate”; and “Severe” or “Very severe”. Mean (SD),F-scores, and p-val-ues were reported to determine the magnitude of the differences. Pairwise comparisons between means were performed using Scheffe’s test adjusting for multiple comparisons.
Responders were defined using the two different anchors in two separate analyses. It was expected that responders would have significantly larger (p<0.05) change scores than non-responders.
Exploratory analyses. Exploratory analyses were conducted to statistically compare the symptom profiles of ILI patients in the current analytic sample at day 1 to the influenza posi-tive patients in the FLU-PRO development sample. Specifically, independent samplest-tests were used to compare mean FLU-PRO total and domain scores between all ILI patients overall (i.e., hospitalized, and non-hospitalized) versus all influenza positive patients overall, while a 2-way analysis of variance (ANOVA) was used to compare mean FLU-PRO scores by influ-enza (i.e., positive, and negative) and hospitalization (i.e., hospitalized, and non-hospitalized) status. Scheffe’s test was used to assess pairwise comparisons between groups.
Results
Sample
Of the 536 subjects enrolled in the study, 441 had the minimum required data (day 1 diary assessment and1 post-day 1 diary entry); data from the 220 subjects testing negative for the influenza virus were used in the current study.Table 1presents baseline demographic and clinical characteristics for the analytical sample. The majority of the participants (70.9%) were from non-US countries.
Evaluation of psychometric properties
Results for the entire sample are reported below; results stratified by hospitalization status are provided in the online supplementS1 File.
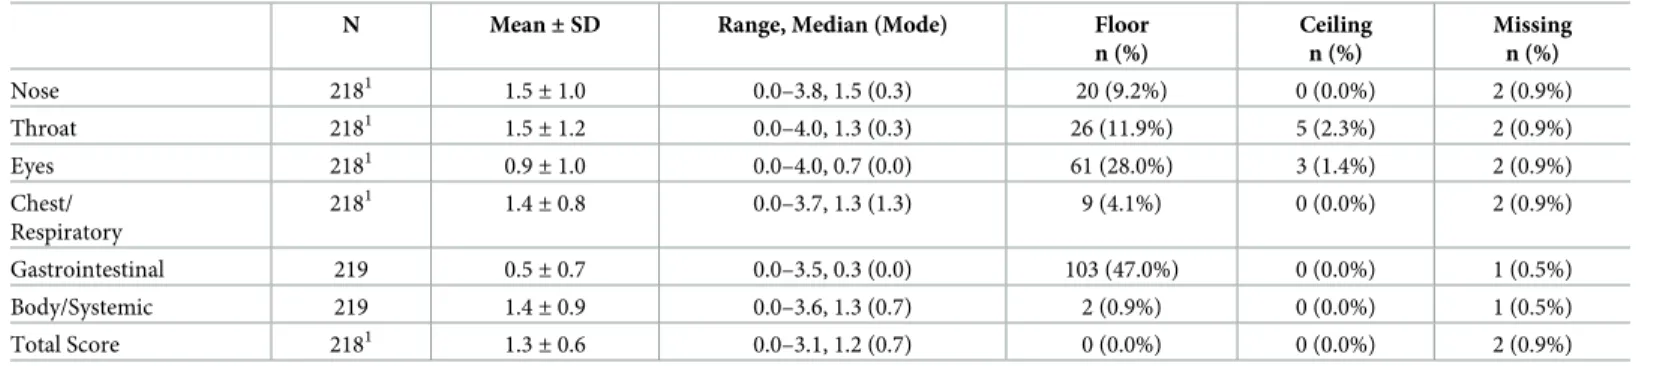
Descriptive statistics of FLU-PRO domain and Total scores. The distributional charac-teristics of the FLU-PRO domain and Total scores on day 1 are shown inTable 2. Mean domain scores were lowest for the Gastrointestinal domain (mean = 0.5; SD = 0.7) and highest for the Nose (mean = 1.5; SD = 1.0) and Throat (mean = 1.5; SD = 1.2) domains. Floor effects were found for the Gastrointestinal (47%) domain. No ceiling effects were found.
Reliability (internal and test-retest). Internal consistency reliability (Cronbach’s alpha) was high for all domains (Nose = 0.80, Throat = 0.84, Eyes = 0.79, Chest/Respiratory = 0.75, Gastrointestinal = 0.72; Body/Systemic = 0.86) and the Total score (0.90).
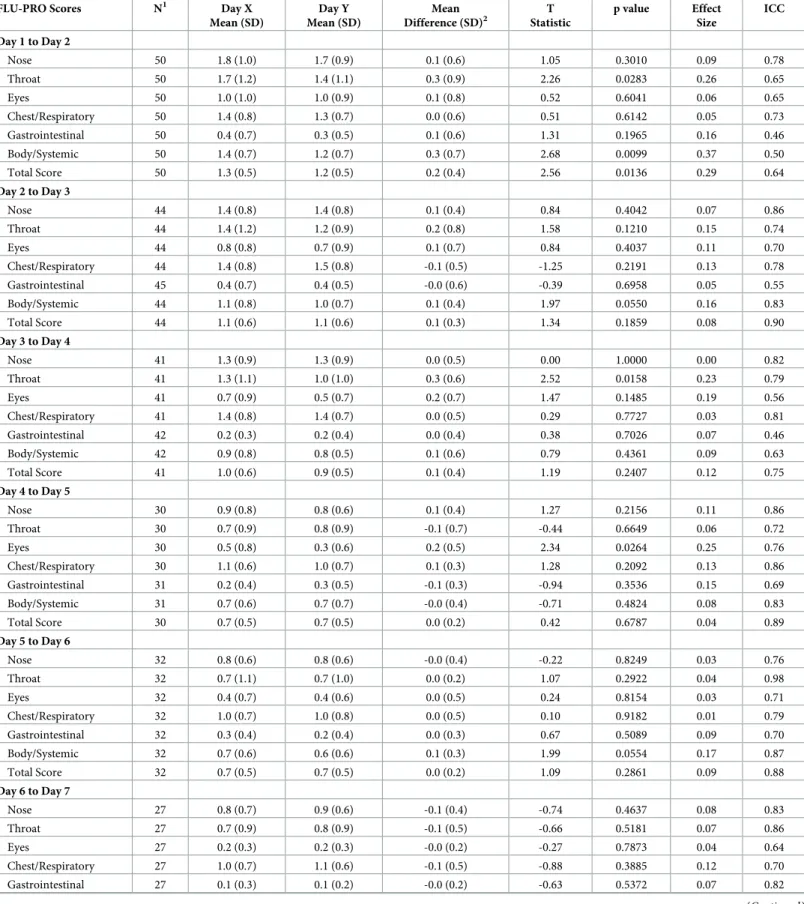
Two-day test-retest reliability during Week 1 are shown inTable 3. Across all two-day assessment periods, FLU-PRO Score ICC and ES estimates were strong. Score reproducibility early in the evaluation (between days 1 and 2) was lowest (Total: 0.64), while reproducibility in the latter days (2–3, 4–5, 5–6) were higher (Total: 0.90, 0.89, 0.88, respectively).
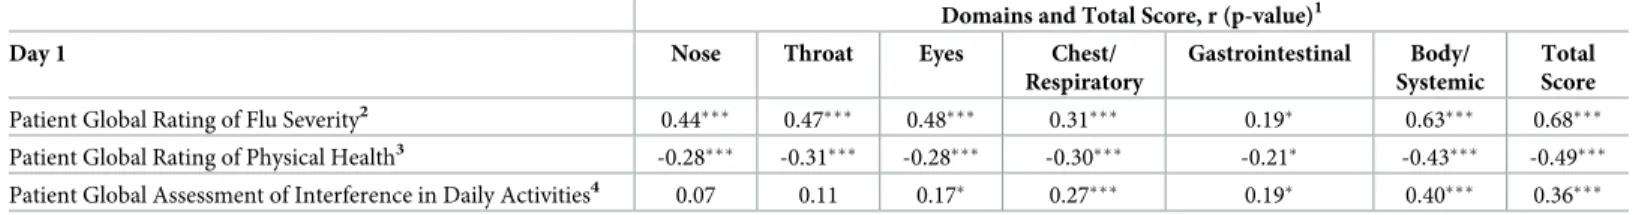
Construct validity. As shown inTable 4, at day 1 the strongest associations were observed between FLU-PRO domain and Total scores and the Patient Global Rating of Flu Severity (rs=
0.31–0.68, p<0.0001), except Gastrointestinal (rs= 0.19, p<0.05). Moderate to high
correla-tions were also found between FLU-PRO scores and the Patient Global Rating of Physical Health for all scores (rs= -0.30–-0.49) except Gastrointestinal (rs= -0.21), Nose, and Eyes
(both rs= -0.28). Only associations between the Patient Global Assessment of Interference in
Daily Activities and the Total score (rs= 0.36, p<0.0001) and Body/Systemic domain score
(rs= 0.40, p<0.0001) were moderate to strong.
Known-groups validity. Significant differences in FLU-PRO total scores were found across patient groups according to the patient global symptom severity rating (F = 81.7, p<
Table 1. Patient demographic characteristics by region in patients with influenza like illness (N = 220).
Variable Day 1
USA (n = 64)
Other Countries1
(n = 156) Age, Years
Mean (SD) 32.7 (13.0) 42.1 (15.1)
Median (Min-Max) 27.5 (19–67) 39.0 (20–91)
>65 1 (1.6%) 12 (7.7%)
Sex, n (%)
Female 41 (64.1%) 100 (64.1%)
Ethnicity, n (%)
Hispanic or Latino 5 (7.8%) 152 (97.4%)
Not Hispanic or Latino 59 (92.2%) 4 (2.6%)
Race, n (%)
Asian 2 (3.1%) 0 (0%)
Black or African American 21 (32.8%) 0 (0%)
White or Caucasian (Mestizo) 0 (0%) 152 (97.4%)
White 39 (60.9%) 4 (2.6%)
Other 2 (3.1%) 0 (0%)
Employment Status, n (%)
Employed, full time 19 (29.7%) 81 (51.9%)
Employed, part-time 0 (0%) 20 (12.8%)
Homemaker 1 (1.6%) 23 (14.7%)
Student 0 (0%) 13 (8.3%)
Unemployed 0 (0%) 11 (7.1%)
Retired 0 (0%) 1 (0.6%)
Disabled 0 (0%) 3 (1.9%)
Other 0 (0%) 2 (1.3%)
Missing 44 (68.8%) 2 (1.3%)
Military Status, n (%)
Never in the military 0 (0%) 153 (98.1%)
Active 16 (25.0%) 0 (0%)
Retired 1 (1.6%) 0 (0%)
Reserves 0 (0%) 1 (0.6%)
Other 1 (1.6%) 0 (0%)
Missing 46 (71.9%) 2 (1.3%)
Highest Level of Education
Elementary/primary school 0 (0%) 15 (9.6%)
Secondary/high school 5 (7.8%) 54 (34.6%)
Some college 7 (10.9%) 8 (5.1%)
College degree 4 (6.3%) 55 (35.3%)
Postgraduate degree 5 (7.8%) 13 (8.3%)
Other 43 (67.2%) 11 (7.1%)
Current Treatments, n (%)
Oseltamivir (Tamiflu) 4 (6.3%) 17 (10.9%)
Amantadine (Symmetrel) 0 (0%) 6 (3.8%)
Other 15 (23.4%) 93 (59.6%)
None 45 (70.3%) 52 (33.3%)
Co-morbidities, n (%)
values was demonstrated for all FLU-PRO domain scores. Further, pairwise comparisons for each domain score showed a similar pattern to the Total score, with the exception of the No/ Mild symptoms versus Moderate for the Chest/Respiratory and Gastrointestinal domains, and Moderate versus Severe/Very Severe for the Nose domain, which were in the correct direction but nonsignificant (p>0.05) (Table 5).
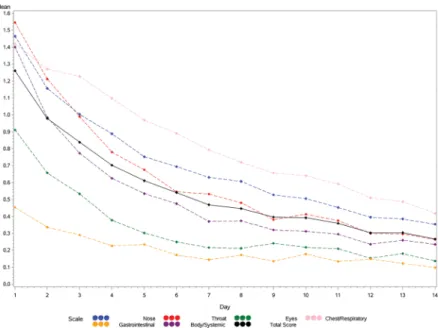
Responsiveness. Change in FLU-PRO total and domain scores across time are shown in
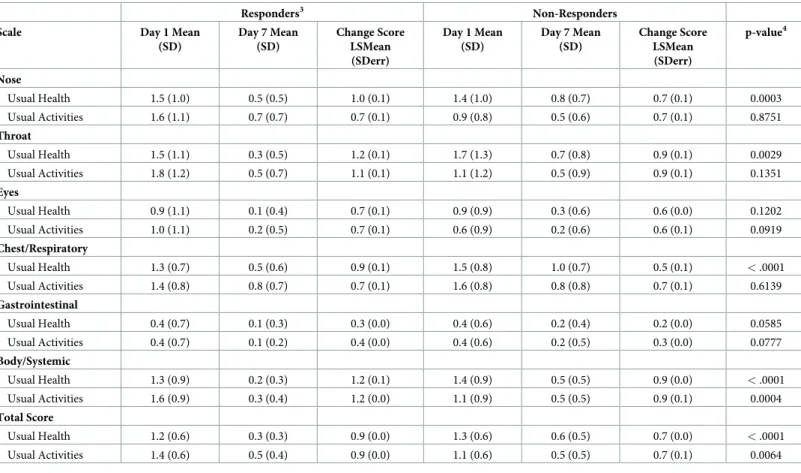
Fig 1, demonstrating a reduction in mean scores across days 1–14. In support of responsive-ness, mean total and domain change scores were significantly greater for patients reporting a return to usual health (responders) by day 7, compared to those who did not, with the excep-tion of the Eyes and Gastrointestinal domains (Table 6). Using patient’s report of return to usual activities as an anchor for responsiveness, mean Total and Body/Systemic change scores
Table 1. (Continued)
Variable Day 1
USA (n = 64)
Other Countries1 (n = 156)
None 44 (68.8%) 67 (42.9%)
Asthma 8 (12.5%) 14 (9.0%)
Chronic Obstructive Pulmonary Disease (COPD) 0 (0%) 3 (1.9%)
Osteoporosis 0 (0%) 4 (2.6%)
Depression 1 (1.6%) 14 (9.0%)
Hypertension 2 (3.1%) 28 (17.9%)
Raised cholesterol 1 (1.6%) 18 (11.5%)
Stomach ulcers 0 (0%) 5 (3.2%)
Heart attack/angina 0 (0%) 5 (3.2%)
Diabetes 3 (4.7%) 20 (12.8%)
Kidney disease 2 (3.1%) 10 (6.4%)
Lung disease 0 (0%) 8 (5.1%)
Tuberculosis 0 (0%) 3 (1.9%)
Other 6 (9.4%) 46 (29.5%)
1Other countries include Mexico (n = 154), Argentina (n = 1), and UK (n = 1).
https://doi.org/10.1371/journal.pone.0194180.t001
Table 2. FLU-PRO domain and total score descriptive statistics Day 1.
N Mean±SD Range, Median (Mode) Floor n (%)
Ceiling n (%)
Missing n (%)
Nose 2181 1.5
±1.0 0.0–3.8, 1.5 (0.3) 20 (9.2%) 0 (0.0%) 2 (0.9%)
Throat 2181 1.5±1.2 0.0–4.0, 1.3 (0.3) 26 (11.9%) 5 (2.3%) 2 (0.9%)
Eyes 2181 0.9
±1.0 0.0–4.0, 0.7 (0.0) 61 (28.0%) 3 (1.4%) 2 (0.9%)
Chest/ Respiratory
2181 1.4
±0.8 0.0–3.7, 1.3 (1.3) 9 (4.1%) 0 (0.0%) 2 (0.9%)
Gastrointestinal 219 0.5±0.7 0.0–3.5, 0.3 (0.0) 103 (47.0%) 0 (0.0%) 1 (0.5%)
Body/Systemic 219 1.4±0.9 0.0–3.6, 1.3 (0.7) 2 (0.9%) 0 (0.0%) 1 (0.5%)
Total Score 2181 1.3±0.6 0.0–3.1, 1.2 (0.7) 0 (0.0%) 0 (0.0%) 2 (0.9%)
Note: higher FLU-PRO scores = more severe symptoms. 1
One item was found missing. Abbreviations: SD = Standard Deviation
Table 3. Two-day test-retest reliability of FLU-PRO scores during Week 1 (Days 1 to Day 7).
FLU-PRO Scores N1 Day X Mean (SD)
Day Y Mean (SD)
Mean Difference (SD)2
T Statistic
p value Effect Size
ICC
Day 1 to Day 2
Nose 50 1.8 (1.0) 1.7 (0.9) 0.1 (0.6) 1.05 0.3010 0.09 0.78
Throat 50 1.7 (1.2) 1.4 (1.1) 0.3 (0.9) 2.26 0.0283 0.26 0.65
Eyes 50 1.0 (1.0) 1.0 (0.9) 0.1 (0.8) 0.52 0.6041 0.06 0.65
Chest/Respiratory 50 1.4 (0.8) 1.3 (0.7) 0.0 (0.6) 0.51 0.6142 0.05 0.73
Gastrointestinal 50 0.4 (0.7) 0.3 (0.5) 0.1 (0.6) 1.31 0.1965 0.16 0.46
Body/Systemic 50 1.4 (0.7) 1.2 (0.7) 0.3 (0.7) 2.68 0.0099 0.37 0.50
Total Score 50 1.3 (0.5) 1.2 (0.5) 0.2 (0.4) 2.56 0.0136 0.29 0.64
Day 2 to Day 3
Nose 44 1.4 (0.8) 1.4 (0.8) 0.1 (0.4) 0.84 0.4042 0.07 0.86
Throat 44 1.4 (1.2) 1.2 (0.9) 0.2 (0.8) 1.58 0.1210 0.15 0.74
Eyes 44 0.8 (0.8) 0.7 (0.9) 0.1 (0.7) 0.84 0.4037 0.11 0.70
Chest/Respiratory 44 1.4 (0.8) 1.5 (0.8) -0.1 (0.5) -1.25 0.2191 0.13 0.78
Gastrointestinal 45 0.4 (0.7) 0.4 (0.5) -0.0 (0.6) -0.39 0.6958 0.05 0.55
Body/Systemic 44 1.1 (0.8) 1.0 (0.7) 0.1 (0.4) 1.97 0.0550 0.16 0.83
Total Score 44 1.1 (0.6) 1.1 (0.6) 0.1 (0.3) 1.34 0.1859 0.08 0.90
Day 3 to Day 4
Nose 41 1.3 (0.9) 1.3 (0.9) 0.0 (0.5) 0.00 1.0000 0.00 0.82
Throat 41 1.3 (1.1) 1.0 (1.0) 0.3 (0.6) 2.52 0.0158 0.23 0.79
Eyes 41 0.7 (0.9) 0.5 (0.7) 0.2 (0.7) 1.47 0.1485 0.19 0.56
Chest/Respiratory 41 1.4 (0.8) 1.4 (0.7) 0.0 (0.5) 0.29 0.7727 0.03 0.81
Gastrointestinal 42 0.2 (0.3) 0.2 (0.4) 0.0 (0.4) 0.38 0.7026 0.07 0.46
Body/Systemic 42 0.9 (0.8) 0.8 (0.5) 0.1 (0.6) 0.79 0.4361 0.09 0.63
Total Score 41 1.0 (0.6) 0.9 (0.5) 0.1 (0.4) 1.19 0.2407 0.12 0.75
Day 4 to Day 5
Nose 30 0.9 (0.8) 0.8 (0.6) 0.1 (0.4) 1.27 0.2156 0.11 0.86
Throat 30 0.7 (0.9) 0.8 (0.9) -0.1 (0.7) -0.44 0.6649 0.06 0.72
Eyes 30 0.5 (0.8) 0.3 (0.6) 0.2 (0.5) 2.34 0.0264 0.25 0.76
Chest/Respiratory 30 1.1 (0.6) 1.0 (0.7) 0.1 (0.3) 1.28 0.2092 0.13 0.86
Gastrointestinal 31 0.2 (0.4) 0.3 (0.5) -0.1 (0.3) -0.94 0.3536 0.15 0.69
Body/Systemic 31 0.7 (0.6) 0.7 (0.7) -0.0 (0.4) -0.71 0.4824 0.08 0.83
Total Score 30 0.7 (0.5) 0.7 (0.5) 0.0 (0.2) 0.42 0.6787 0.04 0.89
Day 5 to Day 6
Nose 32 0.8 (0.6) 0.8 (0.6) -0.0 (0.4) -0.22 0.8249 0.03 0.76
Throat 32 0.7 (1.1) 0.7 (1.0) 0.0 (0.2) 1.07 0.2922 0.04 0.98
Eyes 32 0.4 (0.7) 0.4 (0.6) 0.0 (0.5) 0.24 0.8154 0.03 0.71
Chest/Respiratory 32 1.0 (0.7) 1.0 (0.8) 0.0 (0.5) 0.10 0.9182 0.01 0.79
Gastrointestinal 32 0.3 (0.4) 0.2 (0.4) 0.0 (0.3) 0.67 0.5089 0.09 0.70
Body/Systemic 32 0.7 (0.6) 0.6 (0.6) 0.1 (0.3) 1.99 0.0554 0.17 0.87
Total Score 32 0.7 (0.5) 0.7 (0.5) 0.0 (0.2) 1.09 0.2861 0.09 0.88
Day 6 to Day 7
Nose 27 0.8 (0.7) 0.9 (0.6) -0.1 (0.4) -0.74 0.4637 0.08 0.83
Throat 27 0.7 (0.9) 0.8 (0.9) -0.1 (0.5) -0.66 0.5181 0.07 0.86
Eyes 27 0.2 (0.3) 0.2 (0.3) -0.0 (0.2) -0.27 0.7873 0.04 0.64
Chest/Respiratory 27 1.0 (0.7) 1.1 (0.6) -0.1 (0.5) -0.88 0.3885 0.12 0.70
Gastrointestinal 27 0.1 (0.3) 0.1 (0.2) -0.0 (0.2) -0.63 0.5372 0.07 0.82
were significantly greater for responders, while all other comparisons failed to reach statistical significance (p>0.05).
Exploratory comparisons between influenza positive and ILI patient scores
Patients with confirmed influenza had statistically significantly greater symptom severity at day 1 compared to patients with ILI, including FLU-PRO Total (p<0.0001), Nose (p<0.05), Chest/Respiratory (p<0.0001), Gastrointestinal (p<0.01), and Body/Systemic scores (p<
0.0001) (Table L and Figure C inS1 File). The Throat and Eyes domains were not significantly different between groups (p>0.05). Scores were also examined by hospitalization status. In those not hospitalized, ILI patients reported significantly greater Throat scores than the influ-enza positive patients (p = 0.0174); while the influinflu-enza positive patients reported significantly greater Chest/Respiratory, Body/Systemic, and Total scores compared to ILI patients (p<0.05) (Figure D inS1 File). Among hospitalized patients, those with confirmed influenza reported significantly greater Nose, Gastrointestinal, Body/Systemic, and Total score compared to ILI patients (all p<0.05) (Figure E inS1 File). In addition, for both patients with confirmed influ-enza and ILI, the Patient Global Rating of Flu Severity scores decreased from day 1 to 14, as was seen with FLU-PRO total and domain scores (Figure F inS1 File).
Discussion
The objective of this study was to assess the performance properties of the FLU-PRO in patients seen in the clinic with ILI and testing negative for the influenza virus. For FDA qualifi-cation purposes, the FLU-PRO was developed and tested in patients with acute, laboratory-confirmed influenza, with scores exhibiting sound measurement properties in the sample overall and stratified by hospitalization status. This current study tested the properties of
Table 3. (Continued)
FLU-PRO Scores N1 Day X Mean (SD)
Day Y Mean (SD)
Mean Difference (SD)2
T Statistic
p value Effect Size
ICC
Body/Systemic 27 0.5 (0.5) 0.3 (0.3) 0.1 (0.3) 2.26 0.0325 0.27 0.73
Total Score 27 0.6 (0.4) 0.6 (0.3) 0.0 (0.2) 0.24 0.8106 0.02 0.85
1
Number of study participants with no change in flu symptom at day Y. Stable subjects were defined as those with “no change” on the Patient Global Rating of Change in Flu Severity using two consecutive days.
2
Mean difference = average Day X FLU-PRO score average Day Y FLU-PRO score (ex. Day 1 score Day 2 score); p value from paired t-test.
https://doi.org/10.1371/journal.pone.0194180.t003
Table 4. Construct validity: FLU-PRO scale correlations with other PRO measures at Day 1.
Domains and Total Score, r (p-value)1
Day 1 Nose Throat Eyes Chest/
Respiratory
Gastrointestinal Body/ Systemic
Total Score
Patient Global Rating of Flu Severity2 0.44 0.47 0.48 0.31 0.19 0.63 0.68
Patient Global Rating of Physical Health3 -0.28 -0.31 -0.28 -0.30 -0.21 -0.43 -0.49
Patient Global Assessment of Interference in Daily Activities4 0.07 0.11 0.17 0.27 0.19 0.40 0.36
1
Spearman correlation coefficients:p<0.0001,p<0.05
2
Greater values indicate greater disease severity 3
Greater values indicate better patient health 4
Greater values indicate greater interference with daily activities
FLU-PRO scores in hospitalized and non-hospitalized patients with ILI. If the instrument per-forms well, this would facilitate its use in population-level epidemiologic studies and natural history studies, where laboratory diagnosis of influenza is not always sought or confirmed, and in studies of patients with influenza-like symptoms but infected with viruses or pathogens other than influenza.
Results of this study indicate FLU-PRO scores are reliable and reproducible, demonstrate construct and known-groups validity, and are responsive to change in subjects with ILI. Inter-nal consistency levels were high for each of the domains and the total score, and 2-day test-retest reliability levels during the first seven days following enrollment were generally
Table 5. Known-groups validity: FLU-PRO scores by patient global rating of disease severity, Day 1.
Patient Global Rating of Flu Severity
No/Mild Severe and
Symptoms (N = 81)
Moderate (N = 77)
Very Severe (N = 60)
Scale Mean (SD) Mean (SD) Mean (SD)
F Value (p-value)1
Pairwise Comparisons: No/Mild
vs Moderate (p-value)
Pairwise Comparisons: No/Mild vs Severe/Very Severe (p-value)
Pairwise Comparisons: Moderate vs Severe/Very Severe (p-value)
Nose 0.89 (0.74) 1.65 (0.98) 2.00 (1.09) 26.9 p<0.001 p<0.001 NS
Throat 0.97 (0.98) 1.48 (0.99) 2.41 (1.21) 32.4 p<0.05 p<0.001 p<0.001
Eyes 0.37 (0.52) 1.04 (0.84) 1.48 (1.18) 30.7 p<0.001 p<0.001 p<0.05
Chest/ Respiratory
1.14 (0.73) 1.42 (0.69) 1.79 (0.93) 12.0 NS p<0.001 p<0.05
Gastrointestinal 0.32 (0.61) 0.38 (0.53) 0.72 (0.89) 6.9 NS p<0.01 p<0.05
Body/Systemic 0.83 (0.65) 1.40 (0.71) 2.15 (0.75) 62.2 p<0.001 p<0.001 p<0.001
Total Score 0.81 (0.45) 1.28 (0.48) 1.84 (0.49) 81.7 p<0.001 p<0.001 p<0.001
1p values are:<0.01,<0.001.
Abbreviations: SD = Standard Deviation; NS = Non-significant
https://doi.org/10.1371/journal.pone.0194180.t005
Fig 1. FLU-PRO domain and total score by diary days 1 to 14: Influenza-Negative Patients.
moderate to strong. The relatively low test-retest reliability of the Gastrointestinal domain is due, in part, to the low symptom prevalence and constrained variance. Further evaluation in patients with influenza strains or pathogens characterized by greater incidence of gastrointesti-nal distress should be performed, as gastrointestigastrointesti-nal symptoms may occur in up to 40% of patients with influenza [14]. It was interesting to note that score reproducibility was lower dur-ing the first 2 assessment days in “stable” patients (those reportdur-ing “no change” in their symp-toms). This may be a reflection of the relative nature of “no change” during recovery from an acute illness, an interpretation that could be explored qualitatively.
As hypothesized and in support of construct validity, FLU-PRO scores were significantly related to patient global ratings of influenza severity and global health, with patterns and values similar to those found in the influenza positive sample. Weaker associations were observed with the patient global rating of interference with activities, as patients may return to usual activities before total improvement/resolution of symptoms. The data similarly supported known-groups validity as FLU-PRO scores were lowest in patients rating their symptoms as the mildest, and increased with increasing patient-reported symptom severity. It was interest-ing to note that eye, nose, and throat symptoms were more strongly related to flu severity than respiratory symptoms in milder cases (defined by patient global assessment), with respiratory symptoms sensitive to differences in the more severe cases. These results suggest the
non-Table 6. Responsiveness of FLU-PRO by patient return to usual health (N = 169)1and usual activities (N = 117)2, Day 1 to Day 7.
Responders3 Non-Responders
Scale Day 1 Mean
(SD)
Day 7 Mean (SD)
Change Score LSMean (SDerr)
Day 1 Mean (SD)
Day 7 Mean (SD)
Change Score LSMean (SDerr)
p-value4
Nose
Usual Health 1.5 (1.0) 0.5 (0.5) 1.0 (0.1) 1.4 (1.0) 0.8 (0.7) 0.7 (0.1) 0.0003
Usual Activities 1.6 (1.1) 0.7 (0.7) 0.7 (0.1) 0.9 (0.8) 0.5 (0.6) 0.7 (0.1) 0.8751
Throat
Usual Health 1.5 (1.1) 0.3 (0.5) 1.2 (0.1) 1.7 (1.3) 0.7 (0.8) 0.9 (0.1) 0.0029
Usual Activities 1.8 (1.2) 0.5 (0.7) 1.1 (0.1) 1.1 (1.2) 0.5 (0.9) 0.9 (0.1) 0.1351
Eyes
Usual Health 0.9 (1.1) 0.1 (0.4) 0.7 (0.1) 0.9 (0.9) 0.3 (0.6) 0.6 (0.0) 0.1202
Usual Activities 1.0 (1.1) 0.2 (0.5) 0.7 (0.1) 0.6 (0.9) 0.2 (0.6) 0.6 (0.1) 0.0919
Chest/Respiratory
Usual Health 1.3 (0.7) 0.5 (0.6) 0.9 (0.1) 1.5 (0.8) 1.0 (0.7) 0.5 (0.1) <.0001
Usual Activities 1.4 (0.8) 0.8 (0.7) 0.7 (0.1) 1.6 (0.8) 0.8 (0.8) 0.7 (0.1) 0.6139
Gastrointestinal
Usual Health 0.4 (0.7) 0.1 (0.3) 0.3 (0.0) 0.4 (0.6) 0.2 (0.4) 0.2 (0.0) 0.0585
Usual Activities 0.4 (0.7) 0.1 (0.2) 0.4 (0.0) 0.4 (0.6) 0.2 (0.5) 0.3 (0.0) 0.0777
Body/Systemic
Usual Health 1.3 (0.9) 0.2 (0.3) 1.2 (0.1) 1.4 (0.9) 0.5 (0.5) 0.9 (0.0) <.0001
Usual Activities 1.6 (0.9) 0.3 (0.4) 1.2 (0.0) 1.1 (0.9) 0.5 (0.5) 0.9 (0.1) 0.0004
Total Score
Usual Health 1.2 (0.6) 0.3 (0.3) 0.9 (0.0) 1.3 (0.6) 0.6 (0.5) 0.7 (0.0) <.0001
Usual Activities 1.4 (0.6) 0.5 (0.4) 0.9 (0.0) 1.1 (0.6) 0.5 (0.5) 0.7 (0.1) 0.0064
1Responders: N = 64; Non-responders: N = 105
2Responders: N = 69; Non-responders: N = 48
3Responders are defined as patients responding that they have returned to their usual health or usual activities at Day 7.
4Analysis of covariance was used to compare changes in FLU-PRO scores at day 7 in responders and non-responders, adjusting for day 1 scores.
respiratory domains may be particularly useful in studies of patients with milder influenza-like illness and to capture the full range of symptom severity. The low prevalence of gastrointestinal symptoms (relatively high percentage of participants reporting no gastrointestinal symptoms) would make it more difficult to show significant differences by patient global ratings of influ-enza severity. Further study in patients with strains or pathogens characterized by gastrointes-tinal effects are needed.
When responders were defined by reports of return to usual health, the FLU-PRO demon-strated responsiveness to change from day 1–7. Similar to results observed in the influenza positive sample, FLU-PRO total and domain scores, except for Eyes and Gastrointestinal, were responsive to change in the ILI group when return to health was used to define response. Using return to usual activities as an anchor, responsiveness in ILI patients was shown in the total and Body/Systemic domain scores.
Comparing current study findings in patients with ILI to influenza-positive patients in the original validation study sample [10], the FLU-PRO performed similarly in both patient groups. FLU-PRO domain and total score reliability and reproducibility was supported, with similar coefficient profiles across domains. Additionally, there were moderate to strong corre-lations between FLU-PRO domain and total scores and Patient Global Rating of Flu Severity, Correlations with interference with daily activities were stronger in the laboratory-confirmed influenza patient population.
Results of this study show the utility of the multi-domain profile scores provided by the FLU-PRO. Unlike other measures that assess 1 or 2 dimensions of influenza symptom severity for use in either adults or children [7,8], the FLU-PRO is a comprehensive, multi-dimensional measure with content intended for use across a wide age spectrum [9]. Its structure yields a total score, representing symptom severity overall to facilitate hypothesis testing, and separate assessments of 6 different bodily systems that may be differentially affected by the virus and/or treatment. For example, the FLUiiQ assesses two domains: respiratory and systemic domains, with cough, sore throat, and nasal congestion symptoms captured within a single domain [7]. However, the ILI experienced by the patients in the current study was characterized by sore throat, with less severe respiratory and systemic symptoms than observed in patients testing positive for the influenza virus. The detailed body system profile can capture these symptoms which patients stated were important to them [9], and also provide information on where treatment is and is not providing symptomatic relief.
Gastrointestinal symptoms were experienced by less than 25% of the sample, indicating these symptoms were not prevalent in the year of this study but have been observed in a greater proportion of patients in other years with different circulating viral strains. Although this is technically a floor effect, the results provided quantitative information on the prevalence of gastrointestinal symptoms in this sample [14]. The Gastrointestinal domain should be retained, to assure comprehensive symptom assessment across viral strains or pathogens.
primary analyses of the study, with the current study suggesting the performance properties were comparable in patients presenting to the clinic with a similar set of symptoms but testing negative for influenza using the RIDT. Second, although hospitalized patients were included in the analytic sample, details about the hospitalization event (e.g., duration of influenza prior to hospitalization, acuity level during hospitalization, duration of hospitalization, complicating comorbid conditions, treatment) are unknown. These can be evaluated in future studies, but seem unlikely to affect the measurement properties of the instrument, although may result in a different scoring algorithm. Third, due to sample size limitations, stratified analyses by patient characteristics (e.g., sex, age) was not performed, but should be considered for future studies. Finally, while the content validity of the FLU-PRO has been established in children and adoles-cents through qualitative research, quantitative evaluation of measurement properties has not been conducted in these patient groups.
Results of this study suggest the FLU-PRO may be useful as an outcome measure in clinical trials and epidemiological studies of disease due to non-influenza viruses. Although influenza is often indistinguishable from other viral infections in clinical practice, a standardized com-prehensive symptom measure may be useful for exploring differences in the presentation and course of various viral infections. The FLU-PRO may also be used as an inclusion criteria for studies to ensure patients have sufficient symptoms to test treatment effects and recovery pat-terns. Future work also may evaluate the use of the FLU-PRO in prevention studies, such as vaccines, for disease due to various viruses including influenza.
Conclusion
Results of this study suggest FLU-PRO scores are reliable, valid, and responsive to change in patients testing negative for the influenza virus, indicating the instrument can be used in stud-ies of confirmed influenza and influenza-like illness.
Supporting information
S1 File. Online supplement: Table A. Patient Demographic and Clinical Characteristics by Hospitalization Status (N = 220) Table B. FLU-PRO Domain and Total Score Descriptive Sta-tistics in Non-Hospitalized Patients—Day 1 Table C. FLU-PRO Domain and Total Score Descriptive Statistics in Hospitalized Patients—Day 1 Table D. Two-day Reliability of PRO—Days 1 to Day 7 in Non-Hospitalized Patients Table E. Two-day Reliability of FLU-PRO—Days 1 to Day 7 in Hospitalized Patients Table F. Construct Validity: FLU-PRO Scale Correlations with Other PRO Measures at Day 1 in Non-Hospitalized Patients Table G. Con-struct Validity: FLU-PRO Scale Correlations with Other PRO Measures at Day 1 in Hospital-ized Patients Table H. Known-Groups Validity: FLU-PRO Scores by Patient Global Rating of Disease Severity, Day 1 in Non-Hospitalized Patients Table I. Known-Groups Validity: FLU-PRO Scores by Patient Global Rating of Disease Severity, Day 1 in Hospitalized Patients
Table J. Responsiveness of FLU-PRO by Patient Return to Usual Health (N = 119)1and Usual
Figure E. FLU-PRO Domain and Total Score Descriptive Statistics in Hospitalized Patients— Day 1 Figure F. Patient Global Rating of Flu Severity- Day 1 to 14.
(DOCX)
Acknowledgments
We would like to extend sincere appreciation to staff providing research support at the clinical sites and to David Hengerer, Sandra Macker, and Hongyan Shen of Evidera for their assistance with data collection, management, and analyses; and to Amara Tiebout for her assistance with manuscript text edit and formatting. We also express our gratitude to the patients who gave of their time to help complete this study.
Author Contributions
Conceptualization: John H. Powers, III, Elizabeth D. Bacci, Nancy K. Leidy, M. Lourdes Guerrero.
Data curation: John H. Powers, III, Elizabeth D. Bacci, Jiat-Ling Poon, Sonja Stringer, Mat-thew J. Memoli, Alison Han, Mary P. Fairchok, Christian Coles, M. Lourdes Guerrero.
Formal analysis: John H. Powers, III, Elizabeth D. Bacci, Nancy K. Leidy, Jiat-Ling Poon, Sonja Stringer, Wei-Ju Chen, M. Lourdes Guerrero.
Funding acquisition: John H. Powers, III.
Investigation: John H. Powers, III, Matthew J. Memoli, Alison Han, Mary P. Fairchok, Chris-tian Coles, Jackie Owens, Wei-Ju Chen, John C. Arnold, Patrick J. Danaher, Tahaniyat Lalani, Timothy H. Burgess, Eugene V. Millar, Michelande Ridore, Andre´s Herna´ndez, Patricia Rodrı´guez-Zulueta, Hilda Ortega-Gallegos, Arturo Galindo-Fraga, Guillermo M. Ruiz-Palacios, Sarah Pett, William Fischer, Daniel Gillor, Laura Moreno Macias, Anna DuVal, Richard Rothman, Andrea Dugas, M. Lourdes Guerrero.
Methodology: John H. Powers, III, Elizabeth D. Bacci, Nancy K. Leidy, Sonja Stringer, Wei-Ju Chen, Eugene V. Millar, Andre´s Herna´ndez, M. Lourdes Guerrero.
Project administration: John H. Powers, III, Elizabeth D. Bacci, Jiat-Ling Poon, Sonja Stringer, Christian Coles, Jackie Owens, John C. Arnold.
Resources: John H. Powers, III, Matthew J. Memoli, Alison Han, Mary P. Fairchok, Christian Coles, Jackie Owens, Wei-Ju Chen, John C. Arnold, Patrick J. Danaher, Tahaniyat Lalani, Timothy H. Burgess, Michelande Ridore, Patricia Rodrı´guez-Zulueta, Hilda Ortega-Galle-gos, Arturo Galindo-Fraga, Guillermo M. Ruiz-Palacios, Sarah Pett, William Fischer, Dan-iel Gillor, Laura Moreno Macias, Anna DuVal, Richard Rothman, Andrea Dugas,
M. Lourdes Guerrero.
Supervision: John H. Powers, III, Nancy K. Leidy, Sonja Stringer, M. Lourdes Guerrero.
Validation: John H. Powers, III, Elizabeth D. Bacci, Nancy K. Leidy, Jiat-Ling Poon, Sonja Stringer.
Pett, William Fischer, Daniel Gillor, Laura Moreno Macias, Anna DuVal, Richard Roth-man, Andrea Dugas, M. Lourdes Guerrero.
Writing – review & editing: Elizabeth D. Bacci, Nancy K. Leidy, Jiat-Ling Poon, Sonja Stringer, Matthew J. Memoli, Alison Han, Mary P. Fairchok, Christian Coles, Jackie Owens, Wei-Ju Chen, Patrick J. Danaher, Tahaniyat Lalani, Timothy H. Burgess, Eugene V. Millar, Andre´s Herna´ndez, Arturo Galindo-Fraga, Guillermo M. Ruiz-Palacios, Sarah Pett, William Fischer, Daniel Gillor, Anna DuVal, Andrea Dugas, M. Lourdes Guerrero.
References
1. Centers for Disease Control and Prevention (CDC) (2016) Key Facts about Influenza (Flu) & Flu Vaccine.
2. Centers for Disease Control and Prevention (CDC) (2016) Overview of Influenza Surveillance in the United States.
3. Frost MH, Reeve BB, Liepa AM, Stauffer JW, Hays RD, et al. (2007) What is sufficient evidence for the reliability and validity of patient-reported outcome measures? Value in Health 10: S94–S105.https:// doi.org/10.1111/j.1524-4733.2007.00272.xPMID:17995479
4. Revicki DA (2007) FDA draft guidance and health-outcomes research. Lancet 369: 540–542.https:// doi.org/10.1016/S0140-6736(07)60250-5PMID:17307086
5. Rothman M, Burke L, Erickson P, Leidy NK, Patrick DL, et al. (2009) Use of existing patient-reported outcome (PRO) instruments and their modification: the ISPOR Good Research Practices for Evaluating and Documenting Content Validity for the Use of Existing Instruments and Their Modification PRO Task Force Report. Value Health 12: 1075–1083.https://doi.org/10.1111/j.1524-4733.2009.00603.xPMID:
19804437
6. Food Drug Administration (FDA) (2009) Guidance for industry patient-reported outcome measures: use in medical product development to support labeling claims. Fed Regist 74: 65132–65133.
7. Osborne RH, Norquist JM, Elsworth GR, Busija L, Mehta V, et al. (2011) Development and validation of the influenza intensity and impact questionnaire (FluiiQ™). Value in health 14: 687–699.https://doi.org/ 10.1016/j.jval.2010.12.005PMID:21839407
8. Jacobs B, Young NL, Dick PT, Ipp MM, Dutkowski R, et al. (2000) Canadian Acute Respiratory Illness and Flu Scale (CARIFS): development of a valid measure for childhood respiratory infections. J Clin Epidemiol 53: 793–799. PMID:10942861
9. Powers JH, Guerrero ML, Leidy NK, Fairchok MP, Rosenberg A, et al. (2016a) Development of the Flu-PRO: a patient-reported outcome (PRO) instrument to evaluate symptoms of influenza. BMC Infect Dis 16: 1.
10. Powers J, Bacci E, Leidy N, Stringer S, Kim K, et al. (2016b) Evaluation of the Performance Properties of the Influenza Patient-Reported Outcomes Instrument (Flu-Pro). Value in Health 19: A220–A221. 11. Nunnally JC, Bernstein IH (1994) Psychometric theory. New York: McGraw-Hill. xxiv, 752 p. p. 12. Cronbach LJ (1951) Coefficient alpha and the internal structure of tests. Psychometrika 16: 297–334. 13. Cohen J (1988) Statistical Power Analysis for the Behavioral Sciences. Hillsdale, NJ: Lawrence
Erl-baum Associates Inc,.
14. Minodier L, Charrel RN, Ceccaldi PE, van der Werf S, Blanchon T, et al. (2015) Prevalence of gastroin-testinal symptoms in patients with influenza, clinical significance, and pathophysiology of human influ-enza viruses in faecal samples: what do we know? Virol J 12: 215. https://doi.org/10.1186/s12985-015-0448-4PMID:26651485
15. Dunn JJ, Gordon C, Kelley C, Carroll KC (2003) Comparison of the Denka-Seiken INFLU A.B-Quick and BD Directigen Flu A+B kits with direct fluorescent-antibody staining and shell vial culture methods for rapid detection of influenza viruses. J Clin Microbiol 41: 2180–2183.https://doi.org/10.1128/JCM. 41.5.2180-2183.2003PMID:12734274
16. Ozdemir M, Yavru S, Baysal B (2012) Comparison of the detection of influenza A and B viruses by dif-ferent methods. J Int Med Res 40: 2401–2408.https://doi.org/10.1177/030006051204000639PMID: