WHEN THERE’S A WILL BUT NO WAY: DIRECT AND INDIRECT TAXATION IN DEVELOPING COUNTRIES
Tyler K. Ditmore
A thesis submitted to the faculty at the University of North Carolina at Chapel Hill in partial fulfillment of the requirements for the degree of Master of Arts in the Department of Political Science.
Chapel Hill 2020
Approved by:
Layna Mosley
Cameron Ballard-Rosa
ABSTRACT
Tyler K. Ditmore: When There’s a Will but no Way: Direct and Indirect Taxation in Developing Countries
(Under the direction of Layna Mosley)
ACKNOWLEDGEMENTS
TABLE OF CONTENTS
LIST OF TABLES . . . vi
LIST OF FIGURES . . . vii
INTRODUCTION . . . 1
INDIRECT VERSUS DIRECT TAXATION . . . 5
EXPLAINING TAX CHOICES . . . 10
THEORY AND HYPOTHESES . . . 17
TESTING THE HYPOTHESES . . . 21
DEPENDENT VARIABLES . . . 21
EXPLANATORY VARIABLES . . . 23
CONTROL VARIABLES . . . 25
EMPIRICAL MODELS . . . 26
RESULTS AND DISCUSSION . . . 28
ROBUSTNESS CHECKS . . . 33
CONCLUSION . . . 35
APPENDIX . . . 37
LIST OF TABLES
1 Estimates of Hypothesis 1: Consumer Price Index and Electoral Democracy . . . 29 2 Estimates of Hypothesis 2: Consumer Price Index and Economic
Complex-ity in Democracies . . . 31 A1 Hypothesis 1 Samples: Countries and Years . . . 37 A2 Hypothesis 2 Samples: Countries and Years . . . 39 A3 Estimates of Hypothesis 1: Consumer Price Index and Electoral Democracy
(Full Table) . . . 40 A4 Estimates of Hypothesis 2: Consumer Price Index and Economic
Complex-ity in Democracies (Full Table) . . . 42 A5 Alternative Estimates of Hypothesis 1: Consumer Price Index and Polity . . . 44 A6 Alternative Sample of Hypothesis 2: Consumer Price Index and Economic
Complexity in Democracies (Polity>5) . . . 46 A7 OLS Estimates of Hypothesis 1: Consumer Price Index and Electoral Democracy . . . . 48 A8 OLS Estimates of Hypothesis 2: Consumer Price Index and Economic
LIST OF FIGURES
1 Historical Variation of Indirect Taxation . . . 11
2 Indirect Taxation and Bureaucratic Quality . . . 14
3 Indirect Taxation and Electoral Democracy . . . 16
4 Hypothesis 1 Marginal Effects Plots . . . 30
INTRODUCTION
How do governments in developing countries choose to tax their citizens? Modern taxation oc-curs in variegated and complicated forms, but it can be boiled down into two broad categories: direct and indirect taxation. Direct taxes are drawn from income, and include mechanisms such as corporate income taxes, personal income taxes, and capital gains taxes. Indirect taxes are levied upon consumption, and include value added taxes (VAT), general sales taxes, and turnover taxes. Though there are other forms of taxation, direct and indirect taxes are the primary mecha-nisms by which countries generate tax revenue (Bastiaens & Rudra, 2018).1
Thus, the most fundamental decision a government makes in choosing among possible tax policies is between direct and indirect taxation. All countries collect some form of both taxes, but they may invest relatively more effort in one. Whereas a developed country may have the wealth and existing capacity to undertake both taxes well (and even then will often struggle with tax evasion; Schneider et al., 2015), a developing country seeking to efficiently collect taxes must choose to invest resources into enforcing one or the other. Although indirect taxes are relatively easier to administer (Aizenman & Jinjarak, 2009), the simplicity of tax collection is not the only dimension which policymakers consider. They also care about how visible the taxes are, or how much citizens notice they are paying them (de la Cuesta et al., 2020). Most importantly, direct taxes in developing countries are largely drawn from economic elites (including wealthy individu-als and large corporations), whereas indirect taxes are generally regressive and thus paid by mass publics (Bird & Gendron, 2007).
The balance of direct versus indirect taxes rightly worries scholars and practitioners of public finance. Governments’ accountability to citizens is closely linked with the level of direct taxation, but its relationship to indirect taxes is only conditional (de la Cuesta et al., 2020). If developing countries primarily focus on collecting indirect taxes, they may be able to escape citizen demands
1
(whether intentionally or not) and have more latitude in their public revenues to allocate to in-equitable or corrupt ends. Furthermore, although indirect taxes may distort the economy less (Cnossen, 2015), indirect taxation is typically thought to be more regressive (Ha & Rogers, 2017);
thus, over-relying upon indirect taxation may contribute to inequality (Duncan & Peter, 2016). There is great variety in how developing countries make this choice. In 2017, among countries that were not classified as “High income” by the World Bank, the share of direct tax revenue in total tax revenue ranged from a high of 60% in South Africa and Romania to a low of 16% in Kosovo.2 The standard deviation of the observations is 12%.3 Indirect taxes as a share of tax revenue varied just as widely, from 80% in Kosovo to 20% in Botswana, with a standard deviation of 11.5. Moreover, this variance is not a new phenomenon; in 1990, the direct tax share ranged from 53% in Mexico and Turkey to 9% in Guinea, and the standard deviation for the year was also 12%.4
Thus, some less developed countries collect direct taxes at rates that compare favorably with developed countries, and others rely heavily on indirect taxes. This variance is particularly puz-zling because international tax competition pressures may generate uniform incentives for tax administrations (Genschel et al., 2016; Wibbels & Arce, 2003), demonstrated by a global conver-gence in statutory corporate income tax rates (Swank, 2016). Moreover, tax techniques do not vary much by country, as mechanisms such as the VAT and personal income tax are used globally (Aidt & Jensen, 2009; Keen & Lockwood, 2010), and widespread trade liberalization has encour-aged tax learning (Genschel & Seelkopf, 2016). Given the pressures to conform and evidence of broad similarities across countries’ tax policies, why is this variance so high?
I propose a two-part theory to explain the balance of indirect and direct tax revenue in devel-oping countries. Governments of all kinds uniformly will prefer to extract revenues via indirect taxes, as they are both administratively simpler to collect and politically less visible to
taxpay-2These and other tax revenue data referenced in the text are drawn from the Government Revenue Dataset
created by the International Centre on Taxation and Development (ICTD/UNU-WIDER, 2019).
3
For comparison, in high income countries, the range is from 84% in the United States to 42% in Cyprus, with a standard deviation of 9.8% (all numbers exclude small island nations, which are more likely to be tax havens and thus have distorted tax revenues). Thus, the shares are higher and the variance is smaller.
4In 1990, the indirect tax share varied from 88% in Cuba to 8% in Botswana, with a standard deviation of
ers. However, indirect taxes may become less politically palatable as prices rise. Consumers are sensitive to prices of key goods, and thus high prices will force governments to make a choice: to continue pursuing indirect taxes, which would contribute further to rising prices, or to invest capacity in collecting direct taxes. When prices are high, more democratic countries, which are more sensitive to the demands of mass taxpayers (Levi, 1988; Meltzer & Richard, 1981), will be more likely than more autocratic countries to focus efforts on direct taxes.
The extent to which democracies succeed in collecting direct taxes (conditional upon them having chosen to invest more heavily in this capacity) depends upon their economic environment. Direct taxes require more information to properly enforce. The more information in the economy, or the more complex the economy is, the harder it will be for governments to acquire relevant information for tax enforcement.5 I propose that information can be proxied by the diversity of industries in an economy. Thus, when prices rise, democracies with relatively fewer economic industries to monitor and observe will raise more direct tax revenue. Note that this prediction is contrary to existing theories, which suggest that direct taxation should mirror economic devel-opment, as economic development and bureaucratic quality are generally associated. I instead suggest that economic development may make it harder for tax administrations to enforce the rules.
My theory provides a better empirical explanation than extant research, but it also is clearer about the endogeneity between capacity and will. It explicitly incorporates both the choice to focus on a tax mechanism, and non-endogenous institutional constraints which hinder the abil-ity to effectively carry out that choice. It is certainly not the first study to note the importance of political choice in tax, but many such existing studies control for capacity instead of explic-itly theorizing its effects. Furthermore, this study contributes to the literature by expanding on a potential mechanism of tax visibility that informs the use of direct and indirect taxation. It proposes a novel approach to examining tax capacity by looking at economic structure (infor-mation in the economy) that cannot be manipulated in the short term, and thus is less likely to be endogenous to government desire. By looking at variance within democratic regimes, rather than focusing solely on the democracy-autocracy distinction, it also provides a more specific and
5
pertinent theory of how tax administrations function. Furthermore, this theory has considerable implications for the development of fiscal capacity. It is often noted that state development may be necessary for sustained economic growth (Acemoglu & Robinson, 2005). If this theory is cor-rect, then economic growth that occurs without fiscal capacity will make it significantly harder for fiscal capacity to develop in the future. Lastly, through its empirical strategy, it provides a means of studying the divergence between tax policy and enforcement.
I test the theory using error corrections models from unbalanced panel data of developing countries’ tax revenues. I use two outcome measures: the ratio of indirect to direct tax revenue (known as direct tax bias; Besley & Persson, 2011), and the ratio of indirect tax efficiency to
direct tax efficiency.6 My results generally support the first component of the theory, but only partially support the second element. Although the data is observational and thus militates against confirming causality, I specifically choose measures which should bias results against my hypotheses. Thus, the findings presented here represent a lower bound of the effects. These models serve as (at least) straw-in-the-wind tests of the hypotheses (Van Evera, 2015).
I begin by analyzing the differences between direct and indirect taxation and extracting three key characteristics which inform the distinction: political visibility, taxpayer incidence, and required information. I then review previous studies which have examined the variance in tax modality, all of which focus upon one of each of these characteristics. I propose a novel two-step theory to explain the variance in direct tax revenue. I then test my hypotheses via panel data of (up to) 81 developing countries across 37 years. After discussing the results of the main tests and
robustness checks, I conclude.
6
INDIRECT VERSUS DIRECT TAXATION
Despite the proliferation of modern tax tactics, such as rates, structures, and exemptions (Barnes, 2018), the primary choice governments must make in taxation (other than how much to extract overall) is where the tax itself will be imposed — upon income or consumption. All other poten-tial tax choices flow from this essenpoten-tial decision, between taxing directly or indirectly. Of course, the choice is not zero-sum; nearly all countries practice both methods. But given finite resources — a world in which we are always in — a government must choose to emphasize one or the other.
This is especially the case for developing countries.
Direct taxes are drawn from income; indirect taxes are drawn from consumption. Although there are a host of tax varieties within this division — including value added tax, general sales tax, retail sales tax, turnover tax, excise tax for the former; personal income, corporate income, property, and capital gains, for the latter — each of these tax mechanisms reflects the bifurcation. The two types of tax are separated by three primary descriptive characteristics: when they are collected, where they are collected, and who bears the burden.
First, direct taxes are collected at the end of a defined fiscal period. Because they are drawn from income, which may vary widely through a short period, it is administratively easier to col-lect them over a longer amount of time. Employer withholding allows for income to be colcol-lected over a shorter period of time, but still necessitates annual compliance by the employee to ensure the withholding is correct. Moreover, income withholding is not yet widely practiced in develop-ing countries (Barnes, 2018). Indirect taxes, by contrast, are collected at the time of purchase. Because purchases occur often and are generally steady, they are collected continuously. The VAT makes this process simple, as businesses typically submit taxes and receipts to governments monthly and are incentivized to do so to ensure they receive applicable tax credits.
taxes are overt and target single payers, requiring them to behave differently than if they were not taxed. Indirect taxes, however, are collected from the point of sale. They are applied to pre-existing transactions and are woven into the price of the good. They don’t necessitate any behavior change for the end consumer,7 though they often do for firms linking the chain to the consumer. Moreover, the tax is applied to the transaction between multiple entities (supplier and purchaser), rather than a single firm or person.
Third, the tax burdens fall on different groups of citizens. Tax incidence is difficult to cal-culate for developing countries (Jha & Gozgor, 2019), and depending on how the government structures rates, brackets, and exemptions, any tax has the potential to be regressive (burden falls on relatively poorer payers) or progressive (burden falls on richer payers). However, direct taxes are usually though to be progressive, and indirect taxes are regressive. Direct taxes target individuals and corporations, and thus the incidence of the tax is intended to fall upon economic elites, particularly in developing countries (Peter et al., 2009). Some countries, such as Uganda, have designed their income taxes such that they will only affect a small portion of the population (Martin, 2018); others, such as Chile, raise income tax brackets to avoid taxing labor (Fairfield,
2015). Social security contributions, a component of direct taxation, are generally regressive in developing countries (Wibbels, 2006). Quite simply, because of the amount and spread of in-come within developing countries, it is often not cost-efficient for governments to pursue inin-come taxation upon the economically disadvantaged, and thus focus their direct tax efforts on the wealthiest potential taxpayers.
Indirect taxes are more likely to be regressive (Bird & Gendron, 2007), though evidence is at times mixed because of complications calculating tax incidence given the size of informal mar-kets (Bachas et al., 2019; Shevlin et al., 2019). Unlike most direct taxes, the rate for the VAT is typically flat across types of consumption, and thus the tax share of income is higher for indi-viduals with less income. Even though they can only be enforced in the formal market, they are more likely to reach into the informal market than direct taxes, such as when registered traders sell to informal market vendors. In surveys, far greater numbers of people report having paid consumption taxes than income taxes (de la Cuesta et al., 2020). Moreover, changes to
consump-7
tion taxes generate mass movement responses. In the fall of 2019, protests arose in Chile over a tax added to public transit fares, in Lebanon over fees tacked onto WhatsApp messages, and in Ecuador over the potential elimination of fuel subsidies. These reactions suggest that the taxes were largely felt by the public at large, which is borne out in theory and practice.8
These three descriptive features lead to two further analytical characteristics: indirect taxes are less visible to taxpayers and direct taxes are harder for administrators to collect.
Because indirect taxes are added to pre-existing transactions and do not require a change in taxpayer behavior, it may not be obvious that taxes are being paid at all. Moreover, even when the consumer knows taxes are paid, they may not be aware of how much the taxes cost. This effect is referred to as ‘fiscal illusion’ — governments can increase indirect taxes with less resistance because consumers are less likely to see them (Kiser & Karceski, 2017). This effect has been demonstrated at a micro-level through a series of survey experiments in Uganda (de la Cuesta et al., 2020). When participants witness direct taxation, they are much more likely to observe the behavior and be aware of how it affects their payments than if they participate in indirect taxation.
Still, indirect taxes are not permanently less visible. As noted earlier, increases in indirect taxation have generated protests and mass backlash. Thus, their visibility varies. As suggested by de la Cuesta et al. (2020), they are especially likely to be visible when they are first intro-duced, as this will produce the largest changes to observed prices and thus expected behavior. Over time, their effects theoretically diminish, as consumers become more acclimated to them. However, governments may remain nervous that enforcing indirect taxes may generate a backlash from citizens when consumers are highly sensitive to prices, even if they do not institute a public tax reform. For example, Ghana instituted excise taxes on gasoline in the 1990s that turned into subsidies early 2000s, as the government was afraid to keep raising taxes along with world prices (Prichard, 2015). Thus, indirect taxes are typically less visible to citizens, but governments’
will-ingness to impose them will vary with taxpayer sensitivity to consumption prices.
8Firms still pay indirect taxes, and thus are affected by indirect tax legislation and enforcement. However,
Direct taxes are more complicated largely because they require administrations to track more information. Taxation is a game of information played between administrators and taxpayers. Though information is not sufficient for effective tax collection (capacity to act, citizens’ willing-ness to pay, and compliance costs are also relevant), it is necessary to have accurate knowledge of the domestic economy to know if taxes are being paid accurately (Pomeranz & Vila-Belda, 2019). Although information and capacity are highly connected (e.g. Jensen, 2019), they need not be perfectly aligned. For example, the Malawian tax agency grades low in terms of overall capacity but collects relatively high direct tax revenue because of information collected through informal sources (Ligomeka, 2019).
Furthermore, since they are targeted toward individual taxpayers, direct taxes are simpler to evade than indirect taxes (which generally require the two actors to collude).9 Since the individu-als targeted are often elites, it may be difficult to enforce policies even when there is information available. Elites may have more sway over the government in setting policies and defining the agenda of taxation (Barnes, 2020; Beramendi et al., 2019; Fairfield, 2015; Pardelli, 2018). They also may be able to take advantage of globalization more easily, and thus dodge domestic taxes (Wibbels & Arce, 2003). Accessing this information requires extensive international collaboration, which simply does not exist for taxation (Christensen & Hearson, 2019; Rixen, 2011). Thus, it is widely accepted that modern direct taxes are administratively more difficult to collect than modern indirect taxes.
Developing countries have undertaken several technical reforms intended to improve infor-mation management. All tax administrations have the power to use audits to acquire informa-tion, although this can potentially lead into an endogenous cycle of focusing upon a few major taxpayers about whom enough information is available (Pomeranz & Vila-Belda, 2019). Many countries have encouraged the digitalization of transactions to make capturing and maintaining data easier (McCluskey et al., 2018). In Latin America, the increased percentage of people in the formal banking system led to an increase in purchases with credit and debit cards, which in turn boosted VAT revenues (Mitchell & Scott, 2019). Income withholding has been effective in
9
EXPLAINING TAX CHOICES
When governments choose between direct and indirect taxes, they have three tax characteris-tics in mind: political tax base (elites or populace), administrative difficulty, and visibility to taxpayers. When refering to the actors making choices along these three dimensions, I am re-ferrring broadly to policymakers, either legislators or executives, who have influence in setting and enforcing the tax agenda. It is commonly assumed that political leaders prefer to stay in power but also generate wealth (De Mesquita et al., 2005); extrapolating this to taxation, we can assume that leaders want to maximize revenue gained while minimizing potential demands for ac-countability (Martin, 2018). Given this assumption about preferences, and holding all else equal, it seems that indirect taxes should be strictly preferred by all developing country governments. They are administratively easier to collect (requiring less investment in capacity, and hence in-creasing revenues) while also being potentially invisible to taxpayers (neutralizing concerns about accountability). Moreover, even though the VAT does not fully replace tariffs, it still taxes im-ports heavily (Cnossen, 2015), so governments can continue tapping into this relatively simple revenue stream (Cag´e & Gadenne, 2018).
However, this cannot be the only choice being made. Figure 1 plots the distribution of coun-tries’ indirect tax revenues (as a share of total tax revenue) by year from 1982-2017.10 Each chart also plots the year’s mean, to track the change in the group over time. We can see that the vari-ance is wide and has remained wide over the duration of the series. If indirect taxes were being strictly chosen, we would not see such divergences between countries, or such consistent variation over time.11 What might explain this variation?
10
Although direct tax revenues are not a perfect inverse of indirect tax revenues, they do have a strong negative correlation, and thus I have not plotted them here for the sake of brevity.
11
2012 2013 2014 2015 2016 2017
2006 2007 2008 2009 2010 2011
2000 2001 2002 2003 2004 2005
1994 1995 1996 1997 1998 1999
1988 1989 1990 1991 1992 1993
1982 1983 1984 1985 1986 1987
0 25 50 75 100 0 25 50 75 100 0 25 50 75 100 0 25 50 75 100 0 25 50 75 100 0 25 50 75 100 0
5 10 15
0 5 10 15
0 5 10 15
0 5 10 15
0 5 10 15
0 5 10 15
Indirect Tax Revenue Share
Coun
t
of
Observ
ations
One obvious potential explanation addressing the differences is bureaucratic capacity. Indeed, capacity, or the ability of tax administrations to collect tax, is a focus of most tax research in developing countries. Bureaucratic administration is vital for effective revenue collection (Kiser & Karceski, 2017), and developing countries vary widely in their approach toward developing tax bureaucracy (Berenson, 2018). Moreover, developing countries typically have less capital and human resources to devote toward tax administration, and corruption undermines revenue collec-tion efforts. Since direct taxes are more difficult to collect, they should require commensurately more capable tax administrations to enforce them.
Capacity theories also arise in another form, namely in the ability of countries to set their own tax policies in the face of international tax competition, specifically regarding corporate income taxation. There has long been a concern that capital openness will encourage a race to the bottom in the form of taxation (Rodrik, 1997). Although developed countries can resist such pressures to some degree (Hays, 2003; Lierse & Seelkopf, 2016), developing countries may be particularly susceptible to these incentives because of their need attract investment (Wibbels & Arce, 2003). Tax incentives may have relatively little influence over investment decisions but developing countries certainly do compete for investment through their corporate income tax regimes (Genschel et al., 2016; Owen, 2019). Such competition should be relatively less impor-tant for indirect taxes, though, since they are applied upon consumption or border crossing, and thus cannot be shifted across borders so easily. International pressures should thus make it relatively harder to collect direct taxes without changing the ability to generate revenue from indirect taxes.12
However, scholars often go too far in attributing outcomes in developing countries’ tax regimes primarily to capacity. Researchers have proposed using direct tax revenue as a proxy for state ca-pacity (Lieberman, 2002) and suggested that fiscal caca-pacityis the ability to raise revenue (Besley & Persson, 2010). By equating capacity with actual tax practice, this scholarship eliminates con-sideration of political will, thus suggesting that the weakest developing country governments have no influence over tax administration. This seems both unwise and premature. Having less relatively less money to invest does not necessarily make an investor irrational or constrain all
12
their choices; instead, it limits the range of rational investments that can be made. So too with taxation: developing country governments still make political choices in how they tax, but they face different incentives and constraints based on their lack of capacity to do all that developed country governments can (Besley & Persson, 2013).
This consideration is borne out in a bivariate sense by Figure 2. If capacity were a primary explanation for developing countries’ tax systems, then it should be the case that lower bureau-cratic capacity would result in systematically higher indirect taxes (Lieberman, 2002). In the figure, capacity (as measured the International Country Risk Guide’s measure of bureaucratic capacity) is partially associated with the collection of indirect taxes. However, the association is only weakly negative, and in many years is null or positive. Moreover, the countries with the highest indirect tax revenue ratios are rarely the countries that score lowest on the bureaucracy indicator. Capacity and tax collection rightfully should be linked, but part of the disconnect is because capacity to raise revenue and the ability to invest revenue in capacity are endogenous. For example, the United Kingdom in the 19th century may have had the capacity to tax personal income long before it chose to do so (Scheve & Stasavage, 2016); without a careful division of capacity and will, we cannot be sure of how much this may be occurring in developing countries now.
Turning to the tax base feature of the tax decision, another possible explanation is regime type. Theoretically, democracies expand the size of the leader’s selectorate, decreasing the me-dian voter’s average income. Thus, democracies should be more likely to redistribute income, and hence focus on direct taxation (Meltzer & Richard, 1981). Democracies should also be more responsive to a broader group of citizens, increasing citizens’ willingness to contribute to the state (Bird et al., 2008; Luttmer & Singhal, 2014). Thus, we might expect that democracies raise relatively more direct tax revenue (and less indirect tax revenue) than autocracies.
2014 2015 2016 2017
2008 2009 2010 2011 2012 2013
2002 2003 2004 2005 2006 2007
1996 1997 1998 1999 2000 2001
1990 1991 1992 1993 1994 1995
1984 1985 1986 1987 1988 1989
0 25 50 75 0 25 50 75 0 25 50 75 0 25 50 75
0 25 50 75 0 25 50 75 0.0
2.5 5.0 7.5
0.0 2.5 5.0 7.5
0.0 2.5 5.0 7.5
0.0 2.5 5.0 7.5
0.0 2.5 5.0 7.5
0.0 2.5 5.0 7.5
Indirect Tax Revenue Share
ICR
G
Bureaucracy
Score
found that democracies raise less tax revenue than both anocracies and autocracies (Bastiaens & Rudra, 2018). Democracies may be more likely to introduce progressive personal income taxes (Aidt & Jensen, 2009; Seelkopf et al., 2016), although both they and VAT are associated with
trade liberalization as well (Genschel & Seelkopf, 2016). Figure 3 confirms that these contradic-tory results carry over into tax modality (again, in a bivariate sense). There is essentially no relationship between democracy and indirect tax revenue. Some studies examine intra-regime dynamics (e.g. Baccini et al., 2018; Fairfield, 2015; Li, 2016; Von Schiller, 2018), but they remain relatively uncommon, and often produce inconsistent results themselves.
Lastly, some studies have begun examining the effect of visibility upon tax decisions. This research is still nascent but is largely focused upon the post-tax effects of visibility (de la Cuesta et al., 2020). Moreover, they have largely examined the influence of visibility when taxes are first introduced, not the possibility of visibility’s effect varying over time.
2012 2013 2014 2015 2016 2017
2006 2007 2008 2009 2010 2011
2000 2001 2002 2003 2004 2005
1994 1995 1996 1997 1998 1999
1988 1989 1990 1991 1992 1993
1982 1983 1984 1985 1986 1987
0 25 50 75 100 0 25 50 75 100 0 25 50 75 100 0 25 50 75 100 0 25 50 75 100 0 25 50 75 100 0.00
0.25 0.50 0.75
0.00 0.25 0.50 0.75
0.00 0.25 0.50 0.75
0.00 0.25 0.50 0.75
0.00 0.25 0.50 0.75
0.00 0.25 0.50 0.75
Indirect Tax Revenue Share
V-Dem
P
oly
arc
h
y
In
dex
THEORY AND HYPOTHESES
The government of a developing country thus faces a distinct choice that will affect downstream revenue — should it focus its policy and practice more upon direct or indirect taxation? The-oretically, indirect taxation should be preferred. It is both easier to collect and relatively less visible to taxpayers; as has been demonstrated, however, this baseline does not reflect the variety of ways in which developing country governments tax. To explain this variance, I theorize specifi-cally about both political will and institutional capacity. To focus on one mechanism without the other is to risk veering into endogenous explanation, as they bleed together. Governments must be both willing and able to tax their citizens through direct measures.
More democratic governments will emphasize direct taxation when indirect taxes are more visible. Indirect taxation may become more visible (or have more profound effects upon the tax-payers) when consumption is comparatively costly. This may occur when the taxes are first in-troduced (de la Cuesta et al., 2020), but also when prices rise. Most indirect taxes (including the omnipresent VAT) are levied at an ad valorem rate. As prices increase, taxes will also increase. Consumers are cognizant of prices (Chetty et al., 2009), and so may become more aware of or concerned about indirect taxation as prices rise. Thus, rising prices should make indirect taxes more visible, which in turn eliminates their accountability advantage over direct taxes. Since a far greater number of taxpayers pay indirect taxes than direct taxes, the visibility of indirect taxes will generate political demands by a wider group of citizens. Therefore, when indirect taxes are visible, governments have a hard choice to make — to focus upon the more complicated di-rect taxes that are politically contentious for a small group of taxpayers, or upon the indidi-rect taxes which are relatively uncomplicated but now more politically contentious among a much wider group of taxpayers.
become nervous about enforcing indirect tax policies.13 For example, Bolivia in the early 2000s needed to generate new revenue but faced popular unrest. The government circumvented mass demands by instituting a wealth tax (Fairfield, 2013). Thus, governments may witness potential unrest from price rises and make tax choices in expectation of tax effects. This demonstrates that governments may not be willing to legislate and enforce indirect taxes when prices rise and citizens feel consumption pressure.
When prices are high and the effects of indirect taxes are visible (actually or potentially), ex-ecutives in charge of tax administration can either continue to tax via indirect means or change tactics to tax directly. Taxing consumption when prices are higher is likely to produce greater revenues,14 which should strongly favor governments making this choice. However, on the second dimension of tax decisions, not all governments should feel the same pressure from their citizens. Governments that are sensitive to political pressures from the masses, who are the primary tax-payers for indirect taxes, will be more willing to focus upon direct taxes. That is, governments al-ready accountable to mass taxpayers will respond to their pressures. Democracies will respond to the needs of the median voter and shift tax implementation efforts toward direct taxes (Meltzer & Richard, 1981). Thus, the first hypothesis predicts thechoice made by democratic govern-ments.
Hypothesis 1: When prices rise, more democratic governments will shift toward
direct taxation.
However, the extent to which these democracies succeed in their bid to collect direct taxes will depend further upon their capacity. As has been noted, capacity is an ambiguous concept, and thus must be defined more explicitly to be useful. I refer here to capacity in terms of ability to acquire information. Direct taxation is an information contest between a government and a taxpayer. The government must be able to find out how much income the taxpayer makes to properly tax them.
13Governments may respond in a variety of ways to worries about prices, including subsidies and price controls.
These policies essentially function as negative taxes.
14
There are multiple means of acquiring this information. First, tax administrations can invest in acquiring more information, such as through increasing staff or increasing audits. There are obvious concerns with this mechanism. Not all countries are able to make extensive investments, audits may produce endogenous information (Pomeranz & Vila-Belda, 2019), and measuring such investment is again endogenous to political will.
Second, information may be relatively less costly to acquire. As Kasara reports, governments in sub-Saharan Africa may tax co-ethnics more heavily because they are able to easily acquire information through political networks (Kasara, 2007). This may also be a contributing factor to findings that institutionalized parties and business associations contribute to greater overall tax collection (Von Schiller, 2018). However, the effects of such institutions may again be difficult to disentangle from the outcome of interest.
Third, the amount of information needed to sift through to acquire relevant data may be smaller. It is easier to search for a needle in a haystack than a desert. Tax administrations are looking for information about the economy, and about particular actors in that economy. The more diversified (or complicated) the economy is, and the more total actors there are, the more difficult it will be to acquire information — regardless of bureaucratic capacity. This will be the case when an economy has more total industries. Each industry may have unique characteris-tics about accounting and income practices that require specialized knowledge for tax officials. Moreover, the larger the number of industries, the less likely informal connections will help gov-ernments circumvent information acquisition. Thus, economies that are more developed, that are more complicated, will have more information to sift through, and governments of those economies will have a harder time generating direct tax revenue.
Hypothesis 2: Conditional on when prices rise in democracies, economies with
fewer numbers of industries will be more successful at shifting toward direct
taxa-tion.
co-generated. Thus, states ruling relatively simple economies may be much better at extracting direct tax revenues.
This can be seen in a comparison of Chile and Argentina’s tax systems, drawn from Fair-field (2015). Chilean elites from 1990 to 2010 held enough power to consistently block income tax reforms. Argentinean elites, however, were less cohesive and coordinated, and thus could not prevent implementation of similar policies. Yet, despite the inability of Chile to pass many direct tax bills, direct tax revenues consistently composed a much larger share of Chile’s overall tax take than did such revenues in Argentina. In part, this was because Chile’s economic system was relatively simple. Its business elites were unified and represented by a major business association, which enabled them to oppose reforms. However, this also meant that it was clear who the busi-ness elites were, and there were relatively few industries to target. Thus, the Chilean government was relatively more successful at raising direct tax revenue.15
By splitting apart these two hypotheses, I can explicitly model both choice and capacity. The first hypothesis reflects a political decision made by a government. The second hypothesis is conditional upon the first, and thus looks at the capacity-contingent outcomes of the decision made.
15Data on direct tax revenues again taken from the Government Revenue Dataset and exclude resource tax
TESTING THE HYPOTHESES
I test the two hypotheses by composing linear models of unbalanced panel data of country-year observations. I use error correction models (ECMs), estimated via Ordinary Least Squares (OLS) with country fixed effects, a linear time trend, and panel-corrected standard errors clustered on both country and the time trend. By using country-fixed effects, I control for unobserved heterogeneity and provide a conservative test of my theory, as the results only report in-country variation.
Dependent Variables
For both hypothesis tests, my primary dependent variable of interest is the ratio of indirect tax revenue to direct tax revenue (Indirect/Direct Revenue). This is referred to as ‘indirect tax bias’ (Besley & Persson, 2011). My theory is about a government balancing focus on indirect versus
direct taxes. The larger this ratio is, the more it is collected indirect tax revenue; the smaller, the more biased it is toward direct tax revenue. Thus, the measure most accurately captures the choice governments are making. The variable is calculated by dividing the revenue collected from indirect taxes (excluding trade taxes)16 by direct tax revenue (excluding resource taxes, but including social contributions, as they tend to be regressive in developing countries Wibbels, 2006). The data is taken from the Government Revenue Dataset maintained by the International Centre on Taxation and Development (ICTD), which reports the most diverse tax modality in-formation available for developing countries (ICTD/UNU-WIDER, 2019). I furthermore remove all observations which the ICTD cautions as either potentially incomparable or as potentially mixed with resource tax revenue.17 I also filter the observations to look only at countries with a
16Trade taxes are often considered part of consumption taxes. However, because tariffs include a profoundly
international audience, they should be considered distinct from direct and indirect taxes as I have analyzed them above. Still, though not reported here, including them does not change results profoundly.
17
population greater than 1 million, as smaller countries more often serve as tax havens and thus have different incentives (Genschel et al., 2016).
I also use a secondary dependent variable for both hypothesis tests: the ratio of indirect tax efficiency to direct tax efficiency (Indirect/Direct Efficiency). Tax efficiency is used particularly in VAT studies to determine the efficacy of tax enforcement. It is essentially a ratio of how much tax is actually collected versus how much revenue could potentially be collected. Thus, it can be calculated as the ratio of total revenue drawn from a tax modality to the potential revenue (Bird & Gendron, 2007). Potential revenue is formulated as the top statutory tax rate multiplied
against the tax base. For VAT, this is the top VAT rate multiplied against consumption. This creates an efficiency ratio between 0 and 1; the higher the ratio, the more effectively the tax is being collected. A higher efficiency ratio for indirect tax than direct tax (controlling for changes in tax rate) reflects the importance a government places upon indirect versus direct taxes.
I create an efficiency ratio similar to the Indirect/Direct Revenue ratio, which I refer to as ‘in-direct tax efficiency bias.’ Because efficiency is calculated with rates and revenues, thus focusing upon specific tax mechanisms (as opposed to the direct/indirect binary), I use efficiency ratios for VAT, personal income tax, and corporate income tax.18 Across all calculations, I use Vegh and Vuletin’s historical data of top VAT and income tax rates (Vegh & Vuletin, 2015). Though the total number of countries in their data is relatively small (76), the time series is much larger than comparable available tax rate data.19 For revenue from each tax mode, I use the GRD, which ex-plicitly breaks down tax revenue into individual income, non-resource corporate income, and VAT ratios. To calculate the potential tax base for the VAT, I use the World Development Indicator’s (WDI) measure of total consumption; for the income tax base I use the country’s gross domestic product. The numerator is the VAT efficiency and the denominator is the sum of personal and
problematic. These countries are more likely to be resource-rich autocracies, and resource taxes are generally included as a subset of direct taxes. This would generate significantly misleading analysis of direct tax revenue, and thus I remove them.
18I use these three mechanisms because they are both widespread across countries and deep within countries;
they often compose the majority of non-resource tax revenue.
19
corporate income tax efficiency. Because indirect tax efficiency is generally much greater than direct tax efficiency, I log this measure to reduce the effects of potentially influential outliers.20
Both dependent variables have the same basic interpretation: the larger they are, the more a country is biased toward indirect taxation. The latter measure better captures the actions of governments, but the sample size is severely limited. I expect that they will decrease in both hypothesis tests.
Explanatory Variables
For both hypothesis tests, I proxy for indirect tax visibility (potential or actual) with the WDI’s Consumer Price Index (CPI). The CPI reflects changes in the cost to an average consumer for acquiring a basic set of goods and services and is averaged of the course of a year. The index is fixed such that the year 2010 is equal to 100, and all other years are standardized to match. To reduce the effects of outliers, I log the CPI. Thus, the higher the CPI is, the higher prices are, and the more effect this should have on government choices.
Of course, the CPI reflects several other economic trends and potential policy actions. It is not a micro-level measure of price, but a less-ideal choice drawn from observational data. I choose it, however, partially because it should bias against finding confirmation of my hypotheses. Higher consumer prices mean more tax revenue from the same amount of consumption. Even assuming consumption declines in response, indirect tax revenue as a total of tax revenue should at least remain neutral. Moreover, inflation should affect indirect taxes more than direct taxes. It immediately is calculated into consumption, into the purchases that are taxed. It may take longer to filter into income, through wages and dividends. Furthermore, if a country experiences an inflation crisis and turns to the International Monetary Fund (IMF) for support, the IMF’s influence should pressure governments away from direct taxation. International financial institu-tions strongly encourage uptake of the VAT and other indirect taxes, and perceive direct taxes to be more distortionary, and thus will encourage a country experiencing inflation to pursue indi-rect taxation more effectively. Thus, CPI should lead to lower diindi-rect tax bias, and shade results
20
against my hypotheses. Even though it is not an ideal measure, it should at least capture the lower bounds of the effect of visibility.
For Hypothesis 1, I proxy for democracy using the Varieties of Democracy (V-Dem) Project Electoral Democracy Index (Coppedge et al., 2020). The index ranges from 0-1, though I have set it to range from 0-100 for interpretation. It is a core element of the V-Dem indices and serves as a base for several other measures of democracy. It models the ‘core value of making rulers re-sponsive to citizens,’ and thus should capture most accurately my theory that certain institutions responsive to citizens will change behavior when citizens broadly are responding prices.
The main explanatory variable of interest for Hypothesis 1 is an interaction between the CPI and electoral democracy. When prices are high and a country is relatively more democratic, direct taxes should compose a greater proportion of overall tax revenue, reflecting the choice by officials to focus on enforcing direct taxes instead of indirect taxes. Given this, we should expect the coefficient on the interaction term to benegative.
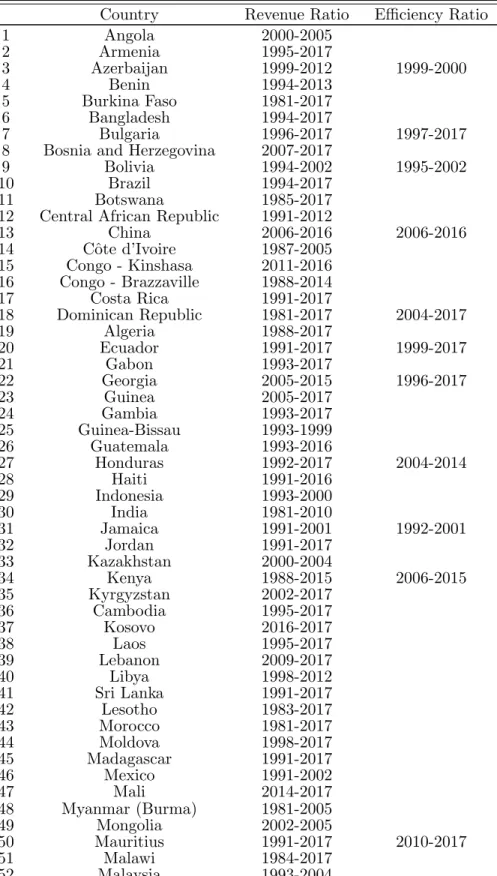
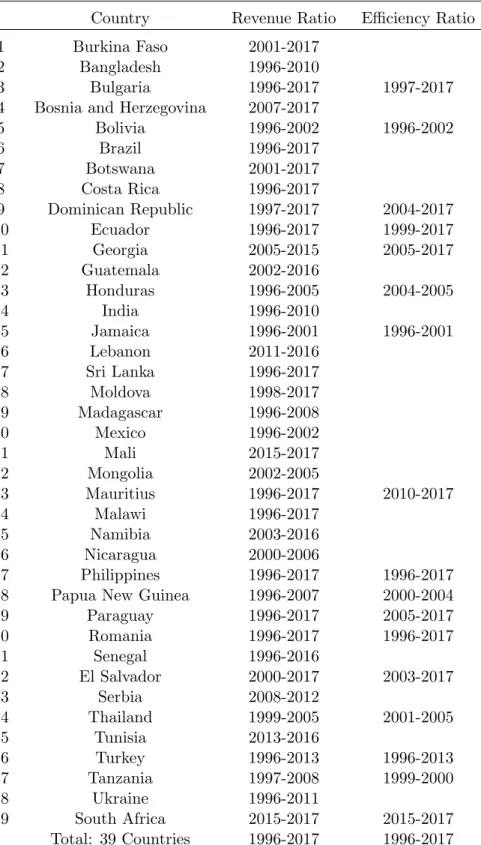
For Hypothesis 2, I filter the sample from Hypothesis 1 tests by only including observations which are coded as electoral or liberal democracies in the V-Dem “Regimes of the World” mea-sure. This measure is categorical, grouping governments into four regime types, of which I in-clude two in the analysis. I did not use this grouping for testing the first hypothesis test because including an interaction in a dynamic panel model requires a series of interaction terms and us-ing a four-part categorical variable would generate a more complicated model. However, I use it here for interpretation, rather than simply subsetting on the 0-1 electoral democracy scale.21 Furthermore, the measures are highly associated, and the Electoral Democracy Index is among the variables used to generate the Regimes of the World measure. This sub-sample is reported in the appendix, in Table A2, and contains 39 countries across 21 years.22
To proxy for available economic information, I use the Economic Complexity Index (ECI) produced by the Growth Lab at Harvard University (Hausmann et al., 2014). The ECI is gen-erated from exported goods and services data, using both Standard International Trade Clas-sification and Harmonized System (HS) clasClas-sifications, to create a measure of how intricately
21
Subsetting on this scale does not significantly change results.
22
interwoven a country’s economy is based on the diversity of its exported products. The HS covers more goods in greater detail, and thus I use the HS index as my primary independent variable. The HS index also begins in 1996, which means less coverage; however, this should mitigate is-sues of measuring closed but diverse economies as uncomplex because it starts after the opening of many economies around 1990. The indices are centered at zero, and I multiply them by 100 to enable interpretation of effects.
ECI is another variable which should bias against my results, as it is generated from trade export data. Though developing countries rely less now on trade taxes (and I exclude them from analysis), the VAT still taxes imported products; many countries rely heavily upon these VAT incomes (Cnossen, 2015). Thus, ECI should be associated with indirect tax bias.
The main explanatory variable of interest for the second test is the interaction between con-sumer price and economic complexity. As the theory states, when concon-sumer prices are higher, democratic governments choose to focus upon direct taxes. However, economic complexity should make this more difficult to achieve, as there is more economic information to sift through. Thus, when consumer prices and economic complexity are both high in a democracy, the indirect tax bias should also be high. The coefficient on the interaction term should bepositive.
Control Variables
short-term change in many of these measures may influence the outcome; thus, I control for the first difference of trade, resource rents, government expenditures, urbanization, and agriculture.
For political indicators, the presence of elections may distort the incentives of officials, par-ticularly in democracies. I control for both legislative and executive elections present in a given year with dummy variables (both taken from V-Dem). Bureaucratic capacity is of course relevant to tax efficiency, and which I control for using the International Country Risk Guide’s Quality of Governance Index (PRS Group, 2012). Additionally, changes in bureaucratic capacity may influ-ence the outcome, and thus I control for the first differinflu-ence of the ICRG capacity measure. War is also known to have a strong effect upon taxation, and thus I control for the presence of civil and interstate war using dummy variables, drawn from UCDP/PRIO (Themn´er & Wallensteen, 2012).
Lastly, in the Indirect/Direct Efficiency models, I control for statutory tax rates for all three tax mechanisms to ensure that changes in the efficiency ratios are driven by revenue collection, not by changes to the rates.
Empirical Models
I conduct both hypothesis tests using error correction models (ECM). In ECMs, the first dif-ference of the dependent variable is regressed upon the lag of the dependent variable and first differences and lags of the explanatory variables. They estimate the rate the rate at which the dependent variable returns to equilibrium after changes in the explanatory variables. They are suitable for analysis of non-stationary data, thus making them empirically appropriate for this study.23
Furthermore, by using both first differences and lags of the explanatory variables, they iden-tify both short- and long-term effects of the covariates (De Boef & Keele, 2008). This is theo-retically appropriate for this analysis, as there are profound differences between tax policy and enforcement (Focanti et al., 2016; Slemrod, 2019). My theory does not distinguish between policy and implementation, but instead applies across all policymakers. Still, these models allow us to compare more carefully the potential influence of legislation versus practice (Ha & Rogers, 2017).
All my models include an interaction between two key covariates. In ECMs, this means that there must be four interactions included in the model: between both lags, both first differences, and a lag and first difference of each variable. Without including all four interactions, we are assuming the effect of the excluded interaction to be 0, and thus distorting the model (Warner, 2016). My theory is about the effect of regime type or economic structure when consumer price index varies; thus, I am primarily concerned with the two interactions between the lag democra-cy/economy variable and the lagged and changed CPI.
The models can be rewritten in OLS notation and are summarized as follows:
H1 : ∆yi,t =α0+α1yi,t−1+β1(CP Ii,t−1∗Democracyi,t−1) +β2(∆CP Ii,t∗Democracyi,t−1)+
β3(CP Ii,t−1∗∆Democracyi,t) +β4(∆CP Ii,t∗∆Democracyi,t) +γXi,t−1+δi+λ+ (1)
H2 : ∆yi,t =α0+α1yi,t−1+β1(CP Ii,t−1∗ECIi,t−1) +β2(∆CP Ii,t∗ECIi,t−1)+
β3(CP Ii,t−1∗∆ECIi,t) +β4(∆CP Ii,t∗∆ECIi,t) +γXi,t−1+δi+λ+ (2)
Where ∆yi,t is the first difference of the indirect tax bias measure in a given yeart for coun-tryi,β are the coefficients for the four interactions of interest,Xi,t−1 is a matrix of relevant
RESULTS AND DISCUSSION
Table 1 presents the results of the test for Hypothesis 1, the interaction between consumer prices and democracy. It presents six error correction models, three for each dependent variable. For the sake of brevity, the covariates are not presented in the main text, but are included in the appendix, in Table A3. Models 1 and 4 contain no covariates, 2 and 5 contain only lagged covari-ates, and 3 and 6 contain both lagged and changed covariates. All models contain country fixed effects, a linear time trend, and panel-corrected standard errors accounting for both country- and time-effects. Models 4-6 are based upon tax rate as well as revenue data, and thus the samples are much smaller than in the first three models. The samples for Models 1 and 4 are reported in A1.
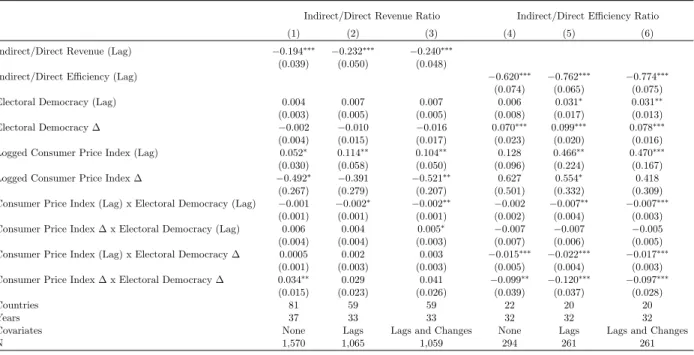
Across four of the six models, the interaction between the lag of both explanatory variables is negative and significant at α=.1. This is as expected in my theory: when consumer prices and democracy are both high, the government will shift toward collecting more direct taxes. As this trend occurs across both the revenue and efficiency ratio, we can be more sure that what is being captured is indeed the effect of government action.
For interpretation, I have plotted the marginal effects of this interaction in Models 3 and 6 in Figure 4(a) and 4(c), respectively. As we can see, the plots are quite similar, although the effect is much stronger for Model 6. When a country is relatively undemocratic (to the left of the scale), the effect of consumer price index is positive; that is, consumer price index is associ-ated with greater indirect tax bias in both revenue and efficiency. When a country is relatively democratic, the effect of consumer price index becomes negative, signaling greater direct tax bias. This accords with my prediction.
Table 1: Estimates of Hypothesis 1: Consumer Price Index and Electoral Democracy
Indirect/Direct Revenue Ratio Indirect/Direct Efficiency Ratio
(1) (2) (3) (4) (5) (6)
Indirect/Direct Revenue (Lag) −0.194∗∗∗ −0.232∗∗∗ −0.240∗∗∗
(0.039) (0.050) (0.048)
Indirect/Direct Efficiency (Lag) −0.620∗∗∗ −0.762∗∗∗ −0.774∗∗∗
(0.074) (0.065) (0.075)
Electoral Democracy (Lag) 0.004 0.007 0.007 0.006 0.031∗ 0.031∗∗
(0.003) (0.005) (0.005) (0.008) (0.017) (0.013)
Electoral Democracy ∆ −0.002 −0.010 −0.016 0.070∗∗∗ 0.099∗∗∗ 0.078∗∗∗
(0.004) (0.015) (0.017) (0.023) (0.020) (0.016)
Logged Consumer Price Index (Lag) 0.052∗ 0.114∗∗ 0.104∗∗ 0.128 0.466∗∗ 0.470∗∗∗
(0.030) (0.058) (0.050) (0.096) (0.224) (0.167)
Logged Consumer Price Index ∆ −0.492∗ −0.391 −0.521∗∗ 0.627 0.554∗ 0.418
(0.267) (0.279) (0.207) (0.501) (0.332) (0.309)
Consumer Price Index (Lag) x Electoral Democracy (Lag) −0.001 −0.002∗ −0.002∗∗ −0.002 −0.007∗∗ −0.007∗∗∗
(0.001) (0.001) (0.001) (0.002) (0.004) (0.003)
Consumer Price Index ∆ x Electoral Democracy (Lag) 0.006 0.004 0.005∗ −0.007 −0.007 −0.005
(0.004) (0.004) (0.003) (0.007) (0.006) (0.005)
Consumer Price Index (Lag) x Electoral Democracy ∆ 0.0005 0.002 0.003 −0.015∗∗∗ −0.022∗∗∗ −0.017∗∗∗
(0.001) (0.003) (0.003) (0.005) (0.004) (0.003)
Consumer Price Index ∆ x Electoral Democracy ∆ 0.034∗∗ 0.029 0.041 −0.099∗∗ −0.120∗∗∗ −0.097∗∗∗
(0.015) (0.023) (0.026) (0.039) (0.037) (0.028)
Countries 81 59 59 22 20 20
Years 37 33 33 32 32 32
Covariates None Lags Lags and Changes None Lags Lags and Changes
N 1,570 1,065 1,059 294 261 261
∗p<.1;∗∗p<.05;∗∗∗p<.01
ratio is -0.774, while the effect of CPI ranges from 0.4 to -0.1. Thus, depending on the value of democracy, the effect ranges from roughly 1/7 to 4/7 of the effect of the lag. Given that the lag in each case is strongly associated with the outcome, this suggests that the interaction effect may be relatively large, but not overwhelming.
(a) Model 3, CPI Lag x Democracy Lag (b) Model 3, CPI Change x Democracy Lag
(c) Model 6, CPI Lag x Democracy Lag (d) Model 3, CPI Lag x Democracy Change
Figure 4: Hypothesis 1 Marginal Effects Plots
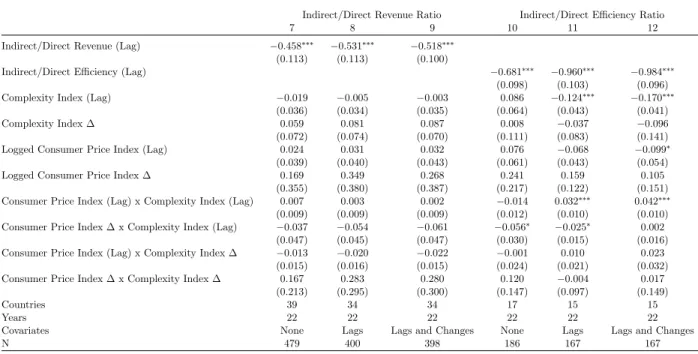
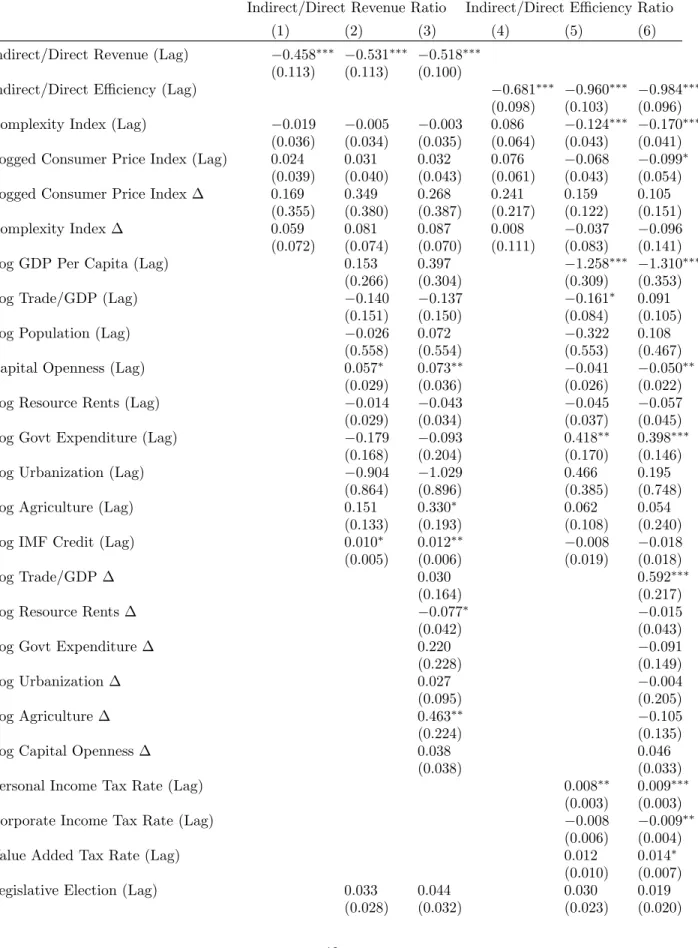
Table 2: Estimates of Hypothesis 2: Consumer Price Index and Economic Complexity in Democracies
Indirect/Direct Revenue Ratio Indirect/Direct Efficiency Ratio
7 8 9 10 11 12
Indirect/Direct Revenue (Lag) −0.458∗∗∗ −0.531∗∗∗ −0.518∗∗∗
(0.113) (0.113) (0.100)
Indirect/Direct Efficiency (Lag) −0.681∗∗∗ −0.960∗∗∗ −0.984∗∗∗
(0.098) (0.103) (0.096)
Complexity Index (Lag) −0.019 −0.005 −0.003 0.086 −0.124∗∗∗ −0.170∗∗∗
(0.036) (0.034) (0.035) (0.064) (0.043) (0.041)
Complexity Index ∆ 0.059 0.081 0.087 0.008 −0.037 −0.096
(0.072) (0.074) (0.070) (0.111) (0.083) (0.141)
Logged Consumer Price Index (Lag) 0.024 0.031 0.032 0.076 −0.068 −0.099∗
(0.039) (0.040) (0.043) (0.061) (0.043) (0.054)
Logged Consumer Price Index ∆ 0.169 0.349 0.268 0.241 0.159 0.105
(0.355) (0.380) (0.387) (0.217) (0.122) (0.151)
Consumer Price Index (Lag) x Complexity Index (Lag) 0.007 0.003 0.002 −0.014 0.032∗∗∗ 0.042∗∗∗
(0.009) (0.009) (0.009) (0.012) (0.010) (0.010)
Consumer Price Index ∆ x Complexity Index (Lag) −0.037 −0.054 −0.061 −0.056∗ −0.025∗ 0.002
(0.047) (0.045) (0.047) (0.030) (0.015) (0.016)
Consumer Price Index (Lag) x Complexity Index ∆ −0.013 −0.020 −0.022 −0.001 0.010 0.023
(0.015) (0.016) (0.015) (0.024) (0.021) (0.032)
Consumer Price Index ∆ x Complexity Index ∆ 0.167 0.283 0.280 0.120 −0.004 0.017
(0.213) (0.295) (0.300) (0.147) (0.097) (0.149)
Countries 39 34 34 17 15 15
Years 22 22 22 22 22 22
Covariates None Lags Lags and Changes None Lags Lags and Changes
N 479 400 398 186 167 167
∗p<.1;∗∗p<.05;∗∗∗p<.01
Most curiously, though, the interaction between the change of CPI and the lag of electoral democracy is weakly significant and positive in Model 3. This interaction is plotted in Figure 4(b). The result here is contrary to theory: as a country becomes more democratic, the effect of CPI is to increase the direct tax bias. Though it is only positive and significant in this model, this confirms that there may be divergences between policy (the lag-lag interaction) and imple-mentation (the lag-change interaction). Moreover, it offers further evidence of the importance of including each of the four interaction effects in the models (Warner, 2016).
Table 2 presents the results of the test for Hypothesis 2, the interaction between CPI and economic complexity within democracies. Again, I present results from six ECMs, three for each dependent variable. Models 7 and 10 contain no covariates, 8 and 11 contain only lagged covari-ates, and 9 and 12 contain both lagged and changed covariates. The full results are presented in Table A4.
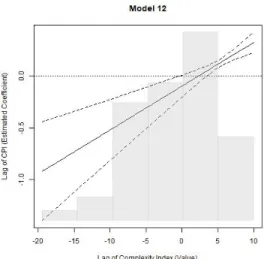
Figure 5: Hypothesis 2 Marginal Effects Plot
Marginal Effect: CPI Lag x Complexity Lag (95% confidence intervals)
of my hypothesis, null results are not especially surprising. However, the multi-directional nature of these results is troubling.
Models 10-12 provide some confirmation of the hypothesis. In 11 and 12, the interaction between the lags of both CPI and economic complexity are positive. This was as expected by my theory: when prices are high and an economy is relatively complex, democracies will be more biased toward indirect taxation than democracies without either of those economic features.
Figure 5 plots the marginal effects of this interaction from Model 12. When a democratic country has a relatively less complex economy (farther to the left on the x-axis), the effect of consumer prices is to push the government toward more efficient direct tax collection. When the country is more complex, it will be more biased toward indirect taxation. Again, we can compare the coefficient on the effect to that of the lag coefficient. Toward the far left, when an economy is least complex, the coefficient may be close to -1 — roughly similar to the coefficient on the lag (-.984). This suggests the association is quite large.
However, the only other significant interactions point in the opposite direction. Models 10 and 11 report that a negative interaction between a change in CPI and economic complexity. Though the effect disappears in Model 12, this again suggests a potentially antipodal relationship between policy and implementation that is worth investigating further.
between consumer prices and electoral democracy are generally negative, when statistically sig-nificant. The test for Hypothesis 2 offers weak support, as one interaction in half the models consistently supports the theory. It is important to recall, especially for models 7-12, that the variables were specifically chosen because they are theoretically biased against my hypotheses. Consumer prices should lead to lower direct tax revenue, and economic complexity should be associated with indirect tax bias. Thus, even limited findings contradicting those expectations provides support for my theory that democracies are influenced by the visibility of indirect taxes but constrained by information available to tax directly.
Robustness Checks
To ascertain the robustness of these results, I conduct two further tests that are reported in the appendix. First, I test for alternative measures of democracy, replacing the V-Dem indicator with revised Polity score. For Hypothesis 1, this is a simple substitution of measures. For Hypothesis 2, I use a subsample of countries which score higher than 5 on the Polity score, as is common practice (Bastiaens & Rudra, 2018). The results for Hypothesis 1 are reported in Table A5 and for Hypothesis 2 in Table A6.
The results for Hypothesis 1 (visibility and democracy) are largely confirmed. The lag-lag interaction is negative across all six models, though only significant in two. The Polity lag-CPI change interaction is positive and significant for the indirect/direct revenue ratio models, con-firming the odd findings from Model 3, and again suggesting the need for more thorough inves-tigation of the divergence between policy and practice. The Polity change interactions are all negative and significant for the indirect/direct efficiency models, as reported in Table 1.
The results for Hypothesis 2 are also largely confirmed. The lag-lag interaction is positive and significant in the indirect/direct efficiency models, and insignificant in the revenue models. The policy-practice divergence finds further validation here as well, as the Polity lag-CPI change interaction is negative and significant through the efficiency models. These models thus confirm the original results, but do not provide any further evidence in favor of Hypothesis 2.
lagged covariates. The results for Hypothesis 1 are presented in Table A7 and Hypothesis 2 in Table A8.
Again, the results largely confirm findings from the ECMs. For Hypothesis 1, all the lag-lag interactions are in the expected direction (now negative) and three are significant. For Hypothe-sis 2, the lag-lag interactions are again in the expected direction and significant for the efficiency, and the democracy lag-CPI change interaction is again in the opposite direction and significant. These results provide further support for the findings in the text, if not the hypotheses.
CONCLUSION
Developing countries vary widely in how biased they are towards indirect or direct taxation. Ex-isting studies focusing upon capacity and regime type are not sufficient to explain this variation, as they each only draw upon one distinguishing feature of the direct-indirect tax decision. By contrast, I propose a novel theory to explain developing countries’ tax collection by modality, relying upon three features of the tax choice: administrative difficulty, visibility, and tax base.
I find results partially supporting my hypotheses, though unlikely to convincingly demon-strate causality. It does seem that democracies may be more willing than autocracies to turn to direct taxes when indirect taxes are relatively more visible to citizens. However, the association of direct tax bias and low economic development is weak and inconsistent. This is not entirely unexpected, as measurements were chosen that would bias against finding confirmatory results.
Most importantly, this study suffers from a lack of quality data to test this theory. The largest sample uses tax revenue ratios as a dependent variable but suggests that it can effectively capture the effects of both choice and capacity. To some extent, this is true of revenue ratios, as they are nebulous enough to cover a broad range of influences. This makes determining the actual cause behind the associations difficult. Although the efficiency ratio is promising, it suf-fers from a lack of breadth of data, as historical tax rates are difficult to acquire. Future studies should be attentive to this, and perhaps find alternative mechanisms for measuring choice and capacity.
Still, that does not suggest that the results here should be disregarded. Researchers need to consider more carefully the divergence between policy and implementation. They are obviously different components of taxation, but the contradictory results in the error correction models suggest they may have diametrically opposite effects. This is an interesting and puzzling finding, and worth pursuing further.
APPENDIX
Table A1: Hypothesis 1 Samples: Countries and Years Country Revenue Ratio Efficiency Ratio
1 Angola 2000-2005
2 Armenia 1995-2017
3 Azerbaijan 1999-2012 1999-2000
4 Benin 1994-2013
5 Burkina Faso 1981-2017
6 Bangladesh 1994-2017
7 Bulgaria 1996-2017 1997-2017
8 Bosnia and Herzegovina 2007-2017
9 Bolivia 1994-2002 1995-2002
10 Brazil 1994-2017
11 Botswana 1985-2017
12 Central African Republic 1991-2012
13 China 2006-2016 2006-2016
14 Cˆote d’Ivoire 1987-2005
15 Congo - Kinshasa 2011-2016
16 Congo - Brazzaville 1988-2014
17 Costa Rica 1991-2017
18 Dominican Republic 1981-2017 2004-2017
19 Algeria 1988-2017
20 Ecuador 1991-2017 1999-2017
21 Gabon 1993-2017
22 Georgia 2005-2015 1996-2017
23 Guinea 2005-2017
24 Gambia 1993-2017
25 Guinea-Bissau 1993-1999
26 Guatemala 1993-2016
27 Honduras 1992-2017 2004-2014
28 Haiti 1991-2016
29 Indonesia 1993-2000
30 India 1981-2010
31 Jamaica 1991-2001 1992-2001
32 Jordan 1991-2017
33 Kazakhstan 2000-2004
34 Kenya 1988-2015 2006-2015
35 Kyrgyzstan 2002-2017
36 Cambodia 1995-2017
37 Kosovo 2016-2017
38 Laos 1995-2017
39 Lebanon 2009-2017
40 Libya 1998-2012
41 Sri Lanka 1991-2017
42 Lesotho 1983-2017
43 Morocco 1981-2017
44 Moldova 1998-2017
45 Madagascar 1991-2017
46 Mexico 1991-2002
47 Mali 2014-2017
48 Myanmar (Burma) 1981-2005
49 Mongolia 2002-2005
50 Mauritius 1991-2017 2010-2017
51 Malawi 1984-2017
53 Namibia 2003-2016
54 Niger 1995-2003
55 Nigeria 1993-2009 1995-2009
56 Nicaragua 2000-2017
57 Nepal 1981-2016
58 Pakistan 1981-2014
59 Philippines 1988-2017 1991-2017
60 Papua New Guinea 1990-2017 2000-2004
61 Paraguay 1991-2017 2005-2017
62 Romania 1995-2017 1996-2017
63 Rwanda 1983-2017
64 Sudan 1992-2015 2004-2006
65 Senegal 1994-2016
66 Sierra Leone 2007-2017
67 El Salvador 1991-2017 2003-2017
68 Serbia 2008-2017
69 Swaziland 2001-2016
70 Syria 1999-2007
71 Chad 1987-2005
72 Thailand 1981-2017 2001-2017
73 Tajikistan 2001-2011
74 Tunisia 1985-2016
75 Turkey 1981-2017 1986-2017
76 Tanzania 1984-2008 1999-2004
77 Uganda 2013-2015
78 Ukraine 1996-2017
79 Venezuela 2009-2015
80 Yemen 1999-2012
81 South Africa 2015-2017 2015-2017
Table A2: Hypothesis 2 Samples: Countries and Years
Country Revenue Ratio Efficiency Ratio
1 Burkina Faso 2001-2017
2 Bangladesh 1996-2010
3 Bulgaria 1996-2017 1997-2017
4 Bosnia and Herzegovina 2007-2017
5 Bolivia 1996-2002 1996-2002
6 Brazil 1996-2017
7 Botswana 2001-2017
8 Costa Rica 1996-2017
9 Dominican Republic 1997-2017 2004-2017
10 Ecuador 1996-2017 1999-2017
11 Georgia 2005-2015 2005-2017
12 Guatemala 2002-2016
13 Honduras 1996-2005 2004-2005
14 India 1996-2010
15 Jamaica 1996-2001 1996-2001
16 Lebanon 2011-2016
17 Sri Lanka 1996-2017
18 Moldova 1998-2017
19 Madagascar 1996-2008
20 Mexico 1996-2002
21 Mali 2015-2017
22 Mongolia 2002-2005
23 Mauritius 1996-2017 2010-2017
24 Malawi 1996-2017
25 Namibia 2003-2016
26 Nicaragua 2000-2006
27 Philippines 1996-2017 1996-2017
28 Papua New Guinea 1996-2007 2000-2004
29 Paraguay 1996-2017 2005-2017
30 Romania 1996-2017 1996-2017
31 Senegal 1996-2016
32 El Salvador 2000-2017 2003-2017
33 Serbia 2008-2012
34 Thailand 1999-2005 2001-2005
35 Tunisia 2013-2016
36 Turkey 1996-2013 1996-2013
37 Tanzania 1997-2008 1999-2000
38 Ukraine 1996-2011
39 South Africa 2015-2017 2015-2017