Sharif University of Technology
Scientia IranicaTransactions E: Industrial Engineering www.scientiairanica.com
Integrated forward-reverse logistics network design
under uncertainty and reliability consideration
S.M. Hate
a;, F. Jolai
b, S.A. Torabi
band R. Tavakkoli-Moghaddam
b a. Faculty of Engineering, Shahrekord University, Rahbar Boulevard, Shahrekord, P.O. Box 115, Iran. b. School of Industrial Engineering, College of Engineering, University of Tehran, Tehran, Iran. Received 9 September 2013; received in revised form 11 October 2014; accepted 7 February 2015KEYWORDS Integrated forward-reverse logistics network design; Network reliability; Facility disruptions; Robust optimization.
Abstract.This paper proposes a robust optimization model for robust and reliable design of an integrated forward-reverse logistics network with hybrid facilities under uncertainty and random facility disruptions. The proposed model utilizes several eective reliability strategies to mitigate the impact of random facility disruptions. First, the proposed model allows two types of hybrid facilities, namely, reliable and unreliable, to be located in the concerned logistics network where unreliable ones may be partially or fully disrupted, and thus a percentage of their capacities may be lost. However, they can still serve their customers with the remaining of their available capacities. Furthermore, a sharing strategy is taken into account, in which goods can be shipped from reliable hybrid facilities to unreliable ones to compensate their lost capacity. A robust optimization approach is applied on the developed model to handle the uncertainties in the parameters of the concerned network. Finally, several numerical experiments along with a sensitivity analysis are conducted to illustrate the signicance and applicability of the proposed model as well as the eectiveness of the robust optimization approach in this context.
© 2016 Sharif University of Technology. All rights reserved.
1. Introduction
Recent studies in the supply chain literature pay a particular attention to designing integrated forward-reverse logistics networks to avoid sub-optimality re-sulting from the separated design of forward and reverse networks and, at the same time, reaching higher levels of productivity and customer satisfac-tion [1,2]. It has been recognized that robust and reliable design of such networks helps rms to maintain and enhance their competitive advantages, and assists them to cope with the growing environmental turbu-lence. A part of literature refers to conguration of integrated forward-reverse logistics networks,
includ-*. Corresponding author. Tel./Fax: +98 383 4424401 E-mail addresses: [email protected] (S.M. Hate); [email protected] (F. Jolai), [email protected] (S.A. Torabi); [email protected] (R. Tavakkoli-Moghaddam)
ing both forward and reverse ows, because of the existing legal requirements, environmental protection, as well as related economic benets [3,4]. The goal of a forward network is to provide a value for the end consumer in terms of product attributes like quality and cost, while the reverse network tries to recover the economic and environmental value from used products in a cost-eective manner. The pro-cesses and activities concerned with material supply, production, distribution, and consumption are embed-ded in the forward network, while reverse network encompasses the activities associated with collection, inspection/separation, recovery, and disposal of the used products [5,6].
Another attention of the recent research is paid to incorporate risk management into the design phase of global supply chains. There are two wide categories of risks that impress supply chain network design problem:
1. The risks originating from the diculties in coordi-nating supply and demand;
2. The risks originating from the threat of disruptions to normal activities, which include the issues con-cerned with natural disasters, strikes, and economic disruptions, terrorist attacks, etc. [7].
Consequently, designing reliable and robust networks is of particular interest. It is worth pointing out the dierence between robustness and reliability terms when studying supply chain risks. A supply chain is robust if it performs well when facing the rst category of risks; while it is reliable if it performs well when disruptions occur, for example, when parts of the supply chain system fail due to natural disasters [8].
A large body of the extant literature is assigned to the rst category of risks in which some parameters of a logistics network such as demand, lead times, transportation costs, and quantity of returned products may be uncertain. Environmental and system uncer-tainties are two aspects of uncertainty, which drasti-cally aect the overall performance of supply chains [9]. The environmental uncertainty addresses uncertainties concerned with demand and supply originated in the performance of suppliers/manufacturers and behavior of customers. Those uncertainties impressing produc-tion, distribuproduc-tion, collecproduc-tion, and recovery processes are called system uncertainties. Since the logistics network design problem has a strategic nature, it is very critical that uncertainties are to be incorporated in the problem [9].
Stochastic programming, robust optimization, and fuzzy mathematical programming are three pow-erful tools, which can tackle the existing uncertain-ties in the parameters of the model. Application of stochastic programming for modeling uncertain supply chain network design can be seen in [4,10-15]. However, in many real applications of stochastic programming, there is no enough historical data to estimate the probability distribution of uncertain parameters. As an alternative, robust optimization can be applied to handle uncertainty in a given bounded uncertainty set. Implementation of robust optimization approach to design closed-loop logistics networks can be traced in [16,17]. In this paper, we resort to the robust optimization approach to handle uncertainties in the parameters of an integrated forward-reverse logistics network design problem. Furthermore, fuzzy mathe-matical programming is a exible tool for modeling epistemic uncertainty that comes from lack of infor-mation about the actual value of parameters [18-20]. For eective implementation of fuzzy mathematical programing to design supply chain networks with uncertain parameters, the reader may refer to [21-23].
The second type of risks (our concern in this paper) can disrupt any point of a supply chain
net-work (e.g., facilities and/or transportation links) in a relatively random manner. As highlighted by Peng et al. [8], disruption risks may lead to both negative nancial eects and serious operational consequences, i.e. higher transportation costs, delays in delivery of orders, inventory shortages, loss of market shares, etc. Therefore, it is important to incorporate disruption risks carefully when conguring supply chain networks. Most studies have focused on managing disruption risks in the facility location problems, while there is a less attention on incorporating this type of risks when designing a forward-reverse logistics network.
One of the rst reliability models refers to the unreliable p-median and (p; q)-center location problem, in which suppliers may be inactive by a given probabil-ity [24]. Snyder and Daskin [25] formulate the random disruptions of a facility in a facility reliability problem by a r-level assignment approach. According to this approach, a customer will be served if and only if all of the assigned facilities at levels 0; 1; ; r 1 fail. In addition, the same disruption probability is considered for all distribution centers. Several reliability models, similar to that presented by Snyder and Daskin [25], have been developed in the literature, but the uniform-disruption-probability assumption is relaxed using a variety of modeling approaches [8,26-31].
Lim et al. [31] introduced a hardening strategy and incorporated it into a mixed integer program-ming model to hedge the impact of random facility disruptions. Two types of facilities, i.e. reliable fa-cilities that are not subject to disruptions but are the more expensive and unreliable ones, which may be disrupted, are considered in their proposed model. In the hardening strategy, the reliable facilities are protected against random disruptions by a substantial investment and therefore, disruptions cannot aect them. Azad et al. [32] extend the hardening strat-egy introduced by Lim et al. [31] and propose the soft hardening strategy for a supply chain network design under random facility disruptions. Almost in all studies pertaining to reliable facility location problem, except Azad et al. [32], it is assumed that facilities may fully fail by a disruptive event and thus, they may not service their assigned customers. Furthermore, the capacity restrictions and disruptions are not considered in these studies. However, in real world, facilities may lose a portion of their capacities after disruptions. In this regard, Azad et al. [32] suppose that the capacity of unreliable facilities may be partially disrupted. Furthermore, it is assumed that reliable facilities have unlimited capacity while unre-liable ones have nite capacities. Besides, Davarzani et al. [33] discussed the eect of single/dual/multiple sourcing to handle the potential disruptions occurred in supply chains. Lim et al. [34] consider a fa-cility location problem in the presence of random
facility disruptions where facilities can be protected with additional investments. Whereas most existing models in the literature implicitly assume that the disruption probability estimate is perfectly accurate, the authors investigated the impact of misestimating the disruption probability. Furthermore, Aboolian et al. [35] studied the reliable facility location problems in which facilities are subject to unexpected failures, and customers may be reassigned to facilities other than their regular facilities. The objective of these problems is to minimize the total expected costs in normal and failure scenarios.
A stochastic mathematical formulation is pro-posed for designing a network of multi-product sup-ply chains comprising several capacitated production facilities, distribution centers, and retailers in markets under demand-side and supply-side uncertainties. The supply-side uncertainty includes possible disruptions in manufacturers, distribution centers, and the con-necting links of the network [36]. Babazadeh and Razmi [37] present an ecient Mixed Integer Linear Programming (MILP) model that is able to consider the key characteristics of agile supply chain, which is the best competitive strategy for high turbulent environments, such as direct shipments, outsourcing, dierent transportation modes, discount, alliance (pro-cess and information integration) between the opened facilities and the maximum waiting time of customers for deliveries. Additionally, the robust stochastic programming approach is applied to handle both op-erational and disruption risks of the agile supply chain network. Garcia-Herreros et al. [38] proposed a two-stage stochastic programming framework to design supply chains under the risk of facility disruptions by simultaneously considering decisions on the facility location and the inventory management.
However, the current literature on forward-reverse logistics network design with reliability consideration is relatively limited. In this line of research, Vah-dani et al. [39-41] propose various models for reliable design of a closed-loop logistics network in an iron and steel industry. Various solution approaches are proposed to solve the concerned problem. In these studies, the reliability concepts are considered for the collection centers with unlimited capacities. The r-level assignment approach introduced by Snyder and Daskin [25] is also adopted to deal with disruptions occurred at collection centers. Hate and Jolai [42] introduced a scenario based model for designing an integrated forward-reverse logistics network in which the customer demand is considered as an uncertain parameter and facilities are subject to the threat of disruptions. A scenario planning approach and a p-robustness criterion are developed to handle facility disruptions and control reliability of the network. Their proposed model can just protect the logistic networks
against complete facility disruptions. To deal with this problem, Hate and Jolai [43] utilized a scenario plan-ning approach and a robust optimization developed by Bertsimas and Sim [44,45] to model both partial and complete facility disruptions. In this paper, we introduce several reliability strategies to mitigate the impacts of disruptions.
This paper oers a mixed integer linear program-ming for robust and reliable design of an integrated forward-reverse logistics network where facilities may be randomly disrupted, and network parameters are uncertain. Our main contributions, which distinguish our work from those of relevant published works, are listed as follow:
Oering a robust and reliable model for designing a capacitated forward-reverse logistics network with hybrid facilities, which can tackle random facility disruptions as well as the uncertainties embedded in the input data;
Considering random disruptions at hybrid facilities, which play a critical role in the forward and reverse ows, concurrently;
Imposing capacity restrictions on hybrid facilities and other facilities embedded in the concerned logistics network;
Incorporating two reliability strategies in the devel-oped model:
{ Locating two types of facilities, namely, reliable and unreliable hybrid ones;
{ Employing a sharing strategy which allows prod-ucts to be shipped from reliable hybrid facilities to unreliable ones for their lost capacities to be compensated.
Considering partial and complete capacity disrup-tions at unreliable hybrid facilities. The capacity of unreliable facilities may be lost partially due to the threat of disruptions. Therefore, they can serve their customers by the remaining of their available capacities;
Applying robust optimization approach to handle uncertainties in input data, i.e. demands, returned products, xed opening costs, and capacities. The rest of the paper is organized as follows. In Sec-tion 2, the studied problem is dened and the proposed reliability-based model is elaborated. In Section 3, the robust optimization approach is briey explained and the robust counterpart of the proposed reliability-based model is developed. Several computational experiments and related numerical results along with a sensitivity analysis are reported in Section 4. Finally, concluding remarks are discussed in Section 5.
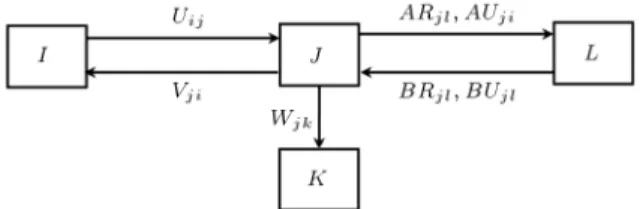
Figure 1. Integrated forward-reverse logistics network.
2. Problem denition and formulation
We consider a single product, multi-echelon forward-reverse logistics network consisting of production and distribution centers with limited capacities in the for-ward ow and collection, recovery and disposal centers with limited capacities in the reverse ow. The Hybrid Production-Recovery (HPR) and Hybrid Distribution-Collection (HDC) facilities are considered in the In-tegrated Forward-Reverse Logistics (IFRL) network, which has several advantages such as cost saving and pollution reduction [2,4,46]. The HPR facilities play the role of production centers in the forward ow and recovery centers in the reverse ow. Similarly, HDC facilities act as the distribution and collection centers in the forward and reverse ows, respectively. The structure of the concerned IFRL network is depicted in Figure 1.
As it is depicted in Figure 1, new products are shipped from HPR centers to customer zones through HDC centers in order to satisfy customer demands in the forward ow. In the reverse ow, the returned products are collected in the HDC centers for inspec-tion purpose. After testing, they are divided into the recoverable and scrap products. The recoverable products are shipped to the HPR centers for recovery processes. Then, they are entered to the forward network as new products. The scrap products are shifted to the disposal centers. The average disposal rate reects the quality of returned products; since high quality returns have a capability for recovery process (remanufacturing and de-manufacturing) and low quality returns must be entered to a safe disposal process. It is also assumed that the customer zones are predened and xed. The goal is nding the optimal number of required facilities (i.e., HPR, HDC, and disposal centers) and their best locations as well as the optimal quantity of material ows between them, while minimizing the total costs of the designed network. Gaining this goal highly depends on the way that uncertainty and reliability issues are handled when conguring the IFRL network. HPR and HDC facilities play an important role in both forward and reverse networks. However, for the sake of simplicity and without loss of generality, we assume that just HDC facilities are subject to random disruptions. Therefore, the reliability issues are taken into account for HDC facilities. However, similar reliability concepts can be
considered for HPR facilities when they are subject to the threat of disruptions.
At each node, j, an unreliable HDC facility can be located at a xed cost of ~F Uj, which may fail with
probability: qj(0 < qj< 1)
or a reliable HDC facility at a cost of ~F Rj which never
fails. Disruptions occur at unreliable facilities, while reliable facilities are protected against disruptions. The reliable HDC facilities never fail, since we can strengthen them against disruptions by a nancial investment and hence, disruptions do not aect them. In other words, the network can be made signicantly more reliable to disruptions with additional investment in the infrastructure, which makes planning for disrup-tions more attractive from a managerial prospective. Obviously, the cost of opening reliable HDC facilities is more than that of unreliable ones (i.e., ~F Rj >
~
F Uj; 8j). At the HDC facility, j, the distribution
and collection capacities are denoted by ~j and ~j,
respectively. The previous studies addressing the facility reliability problem assume unlimited capacities, while we consider a capacitated IFRL network model. Furthermore, these studies suppose that the disrupted facilities completely fail after disruptions and cannot serve their assigned customers. However, we assume unreliable HDC facilities may lose a part of their distribution/collection capacities when a disruption strikes. Therefore, in the forward ow, they can serve the assigned customers with the remaining of their available distribution capacities. Notably, in the reverse ow, they can serve the HPR and disposal centers with the rest of their collection capacities. In this regard, the capacity failure fraction is dened for an unreliable HDC facility, which shows the percent-age of the lost capacity during disruption situations. The notations pj and p0j, respectively, denote the
percentages of distribution and collection capacities at unreliable HDC facility, j, which are lost as a result of disruption.
A sharing strategy is also considered in the for-ward ow, which allows reliable HDC facilities to share new products to unreliable HDC facilities to compen-sate their lost capacities. In this manner, new products can be trans-shipped from reliable HDC facilities to unreliable ones whose capacities have been partially disrupted. Therefore, customers of a disrupted HDC center are not necessarily assigned to other HDC centers, since the lost capacity of a disrupted HDC center will be amended by reliable HDC facilities. It is worthy to mention that without loss of generality, the sharing strategy is only applied on distribution capacity of HDC facilities in the forward ow. To develop the mathematical programming model, the following notations are used.
2.1. Notations Sets:
I : Number of potential HPR centers, indexed by i;
J : Number of potential HDC centers, indexed by j;
K : Number of potential disposal centers, indexed by k;
L : Number of xed customer zones, indexed by l.
Parameters:
dl: Demand of customer zone l;
rl: Amount of returned products from
customer zone l;
Ad : Average disposal fraction; cab: Transportation cost per unit of
products from a center a to a center b or a customer zone b for a; b 2 I; J; K; L;
'i: Production capacity of HPR center i
in the forward ow;
i: Recovery capacity of HPR center i in
the reverse ow;
j: Distribution capacity of HDC center j
in the forward ow;
j : Collection capacity of HDC center j in
the reverse ow;
!k : Disposal capacity of disposal center k;
Fi: Fixed cost of opening HPR center i;
F Rj : Fixed cost of opening reliable HDC
center j;
F Uj: Fixed cost of opening unreliable HDC
center j;
F Dk : Fixed cost of opening disposal center
k;
cpfi: Production cost per unit of product at
HPR center i;
cpri: Recovery cost per unit of product at
HPR center i;
cdfj : Distribution cost per unit of product
at HDC center j;
cdrj: Collection cost per unit of product at
HDC center j;
cpk : Disposal cost per unit of scrapped
product at disposal center k; qj: Disruption probability in unreliable
HDC center j;
pj: Percentage of disrupted distribution
capacity at opened unreliable HDC center j;
p0
j: Percentage of disrupted collection
capacity at opened unreliable HDC center j.
Variables:
Uij : Quantity of products shipped from
HPR center i to HDC center j; Vji: Quantity of recoverable products
shipped from HDC center j to HPR center i;
Wjk: Quantity of scrapped products shipped
from HDC center j to disposal center k;
Tj0j : Quantity of products trans-shipped
from reliable HDC center j0 to
unreliable HDC center j at a disrupted situation (j0 6= j);
Xi : Binary variable; equals 1 if HPR center
i is opened, 0 otherwise;
Y Rj : Binary variable; equals 1 if reliable
HDC center j is opened, 0 otherwise; Y Uj : Binary variable; equals 1 if unreliable
HDC center j is opened, 0 otherwise; Zk : Binary variable; equals 1 if disposal
center k is opened, 0 otherwise; ARjl: Binary variable; equals 1 if customer
zone l is assigned to reliable HDC center j in the forward ow, 0 otherwise;
AUjl: Binary variable; equals 1 if customer
zone l is assigned to unreliable HDC center j in the forward ow, 0 otherwise;
BRjl: Binary variable; equals 1 if customer
zone l is assigned to reliable HDC center j in the reverse ow, 0 otherwise; BUjl : Binary variable; equals 1 if customer
zone l is assigned to unreliable HDC center j in the reverse ow, 0 otherwise. 2.2. Problem formulation
The developed model is a mixed integer linear program-ming model, which is formulated as follows:
P (I) : minX
i
FiXi+
X
j
F RjY Rj+
X
j
F UjY Uj
+X
k
F DkZk+
X
i
X
j
(cij+ cpfi)Uij
+X
j
X
l
+X
l
X
j
(clj+ cdrj)rl(BRlj+ BUlj)
+X
j
X
k
(cjk+ cpk)Wjk+
X
j
X
i
(cji+ cpri)Vji
+X
j0
X
j6=j0
qjcj0jTj0j; (1)
s.t. X
j
ARjl+
X
j
AUjl= 1 8l; (2)
X
j
BRlj+
X
j
BUlj= 1 8l; (3)
X
j
Y Rj 1; (4)
Y Rj+ Y Uj 1 8j; (5)
ARjl Y Rj 8j; l; (6)
BRlj Y Rj 8j; l; (7)
Tj0j MY Rj0 8j0; j 6= j0; (8)
Tj0j jY Uj 8j0; j 6= j0; (9)
X
j0
Tj0j+ j(1 pj)Y Uj
X
l
dlAUjl 8j; (10)
X
j
Tj0j+
X
l
dlARj0l j0Y Rj0 8j0; (11)
X
i
Uij+
X
j0
Tj0j
X
l
dlAUjl 8j; (12)
X
i
Vji=
X
l
(1 Ad)rl(BRlj+ BUlj) 8j; (13)
X
k
Wjk=
X
l
Adrl(BRlj+ BUlj) 8j; (14)
X
i
X
j
Uij
X
l
dl; (15)
X
j
Uij 'iXi 8i; (16)
X
j
Vji iXi 8i; (17)
X
i
Uij j(Y Uj+ Y Rj) 8j; (18)
X
l
dlAUjl jY Uj 8j; (19)
X
l
rlBUlj (1 p0j)jY Uj 8j; (20)
X
l
rlBRlj jY Rj 8j; (21)
X
j
Wjk !kZk 8k; (22)
Xi; Y Rj; Y Uj; Zk; ARjl; AUjl; BRlj; BUjl 2 f0; 1g;
8i 2 I; 8j 2 J; 8l 2 L; 8k 2 K; (23) Uij; Wjk; Vji; Tj0j 0;
8i 2 I; 8j; j02 J; 8l 2 L; 8k 2 K; (24)
where M is a large positive number. The aim of the objective function of Relation (1) is to minimize the total costs, including the xed costs of opening facilities, processing and transportation costs, and the expected costs of sharing products from reliable HDC facilities to unreliable HDC facilities. The 1st to the 4th terms show the costs of locating HPR facilities, reliable and unreliable HDC facilities, and disposal centers, respectively. The 5th term represents transportation costs from HPR to HDC centers and production processing costs at HPR centers. The 6th term indicates the costs of assigning customers to reliable and unreliable HDC centers in the forward network, respectively, and distribution processing costs at HDC facilities. The 7th term presents the costs of assigning customers to reliable and unreliable HDC centers in the reverse ow, respectively, and collection processing costs at HDC facilities. The 8th and 9th terms show the transportation costs from HDC centers to disposal and HPR centers, and the disposal and recovery processing costs at disposal and HPR facilities, respectively. The last term presents the expected disruption costs, which is the expected cost of sharing products from reliable HDC centers to reliable HDC centers during disruptions.
Constraints (2) and (3) ensure that each customer zone should be exactly assigned to one HDC facility in the forward and reverse ows, respectively. Con-straint (4) shows that at least one reliable HDC center must be opened to enforce the sharing strategy in a disruption situation. Constraint (5) indicates that both reliable and unreliable HDC facilities cannot be opened simultaneously at a potential node j. Constraints (6) and (7) enforce the creation of a reliable HDC center at potential node j, if a customer is assigned to it in both forward and reverse ows. Constraint (8) guarantees that in a disruption situation, if a reliable HDC facility is located at potential node j0, products
can be trans-shipped from it to unreliable HDC facil-ities. Constraint (9) ensures that during disruption
situation, products cannot be shipped to potential node j, unless an unreliable HDC facility is located at it. Constraint (10) states that for an unreliable HDC center located at node j, the sum of products trans-shipped from reliable HDC facilities to it and its available capacity after disruption should be greater than or equal to the total demands of its assigned customers.
Constraint (11) indicates that for a reliable HDC center opened at potential node j0, the sum of products
trans-shipped from this facility to unreliable HDC fa-cilities and the total demands of its assigned customers should not exceed its capacity. Constraint (12) states that the sum of ows entered to an unreliable HDC center located at node j cannot be lower than the total demands of its assigned customers. Constraints (13) to (15) address the balance constraints. Constraints (16) and (17) enforce restrictions on the production and recovery capacities at HPR centers, respectively. Constraints (18) to (21) enforce restrictions on the distribution and collection capacities at HDC facilities in the forward and reverse ows, respectively. Notably, the lost distribution capacity occurred at unreliable HDC centers can be amended by the means of sharing strategy which is integrated in the forward ow. This issue is reected in Constraints (10) and (19). Con-straint (22) enforces the capacity restrictions at dis-posal centers. Finally, Constraints (23) and (24) denote the binary and ow variables and their corresponding restrictions.
3. Robust optimization model
Soyster [47] is the rst who introduces the idea of Ro-bust Optimization (RO), but his idea turns to be very pessimistic, which makes it unfavorable among prac-titioners. Furthermore, the RO approach was devel-oped independently by Ghaoui and Lebert [48], El-Ghaoui et al. [49], and Ben-Tal and Nemirovsky [50,51]. The Ben-Tal and Nemirovsky approach [50,51] provides less conservative solutions than earlier worst-case solu-tions provided by robust mathematical programming approaches (e.g., [47]) by trading o some of the conservatism for improvement in the objective function by bounding the set of values uncertain parameters could achieve. A key feature of the RO approach is its tractability, which depends on the structure of the uncertainty set. Bertsimas and Sim [44,45] develop dierent robust optimization techniques in an attempt to keep the structure of the original problem. The optimal solution is more optimistic than the robust optimization approach introduced by Soyster [47]. Fur-thermore, Bertsimas and Sim [44,45] develop a new robust methodology, wherein the optimal solution is more optimistic. In this paper, we follow the robust optimization approach developed by Ben-Tal and
Ne-mirovski [50-52]. The signicant advantages of this approach are as follow:
a) The robust formulation of the problem is tractable when the uncertainty set is described as a box or an ellipsoid. Furthermore, the structure of the nal robust method remains the same as the nominal problem in the case of box uncertainty;
b) It is less conservative rather than the robust opti-mization introduced by Soyster [47] and Bertsimas and Sim [44,45] which makes it more favorable;
c) It allows us to control the level of conservatism in the solution set by changing uncertainty level. Nowadays, robust optimization method is embedded into the mathematical programming problems to deal with the uncertainty in the model parameters. Robust optimization technique could provide a solution that is guaranteed to be good for all or most of the possible realizations of the uncertain parameters. To explain the robust optimization technique, consider the following linear programming problem, in which the parameters c, A, and b belong to a given uncertainty set U:
Min cx;
s.t. Ax b; (25)
where x is the vector of decision variable. The concerned uncertain linear optimization model contains a series of linear optimization models whose parameters vary in the uncertainty set U [50-53]. According to Ben-Tal and Nemirovski [50-53], the robust counterpart (RO) of the model (Relation (25)) can be formulated as follows:
Min (
sup
(c;d;A;b2U)[cx] : Ax b; 8c; d; A; b 2 U
) : (26)
A vector x is a `robust feasible' solution, if it satises all realizations of the constraints according to the uncertainty set U. Furthermore, it is a `robust optimal' solution when there is no other feasible solution with better objective function value. In the case where uncertainty set is in the form of box uncertainty (Ubox),
the robust counterpart can be converted to a tractable equivalent model in which the extreme points of the box uncertainty are substituted instead of Ubox [54].
Under box uncertainty, each uncertain parameter such as ~aij is unknown, but bounded in a box of the form
Ubox = faij 2 R : jaij aijj aGaijg, where aij; a,
and Ga
ij denote the nominal value, the uncertainty
level, and scale uncertainty, respectively. Notably, Ga ij
is a positive number and 0 < a 1. If we set
Ga
ij = aij, then the relative deviation from the nominal
and Pishvaee et al. [16], the tractable equivalent model of the RO problem (26) can be written as follows:
Min z; s.t. X
j
(cjxj+ j) z;
cGcj j; 8j;
cGcj j; 8j;
X
j
(aij+ aGaij)xj bi bGbi; 8i: (27)
The supply chain decisions can be categorized into three types according to their signicance and the length of the planning horizon considered. First, decisions associated with the place, volume, and tech-nology of facilities are often regarded as strategic with a planning horizon of several years. Second, supplier evaluation and selection, distribution channel, and transportation mode selection are the tactical decisions which can change every few months. Finally, operational decisions that are easily revised in the short term contain the decisions about raw material and semi-nished and nished product ows in the supply chain network. There are both single-period and multi-period supply chain network design problems in the concerned literature. Multi-period planning horizon models have been proposed for situations in which parameters change over time in a predictable way. Thereby, a planning horizon, divided into several time periods, is usually considered [55]. However, the pro-posed model is a single-period planning horizon model in which some parameters are uncertain. To develop the robust counterpart of the proposed reliability model and its tractable form, it is supposed that opening costs ( ~Fi; ~F Rj; ~F Uj; ~F Dk), demands ( ~dl), returned products
(~rl), and capacities ( ~'i; ~i; ~j; ~j; ~!k) are uncertain and
can vary in their corresponding box uncertainty sets. Consequently, the robust counterpart of the pro-posed model can be formulated as the following equiv-alent tractable model:
P (II) : min zX
i
FiXi+ Fi
+X
j
F RjY Rj+ jF R
+X
j
F UjY Uj+ jF U
+X
k
F DkZk+ kF D
+X
i
X
j
(cij+ cpfi)Uij
+X
j
X
l
(cjl+ cdfj) dl(ARjl+ AUjl) + ld
+X
l
X
j
(clj+ cdrj) [rl(BRlj+ BUlj) + rl]
+X
j
X
k
(cjk+ cpk)Wjk+
X
j
X
i
(cji+ cpri)Vji
+X
j0
X
j6=j0
qjcj0jTj0j z; (28)
s.t. FGFi Xi Fi 8i; (29)
FGFi Xi iF 8i; (30)
F RGF Rj Y Rj jF R 8j; (31)
F RGF Rj Y Rj F Rj 8j; (32)
F UGF Uj Y Uj jF U 8j; (33)
F UGF Uj Y Uj jF U 8j; (34)
F DGF Dk Zk kF D 8k; (35)
F DGF Dk Zk F Dk 8k; (36)
dGdl(ARjl+ AUjl) dl 8j; l; (37)
dGdl(ARjl+ AUjl) ld 8j; l; (38)
rGrl(BRlj+ BUlj) rl 8l; j; (39)
rGrl(BRlj+ BUlj) lr 8l; j; (40)
X
j
ARjl+
X
j
AUjl = 1 8l; (41)
X
j
BRlj+
X
j
BUlj= 1 8l; (42)
X
j
Y Rj 1; (43)
Y Rj+ Y Uj 1 8j; (44)
ARjl Y Rj 8j; l; (45)
BRlj Y Rj 8j; l; (46)
Tj0j MY Rj0 8j0; j 6= j0; (47)
Tj0j j GjY Uj 8j0; j 6= j0; (48)
X
j0
Tj0j+ j Gj(1 pj)Y Uj
X
l
dl+ dGdl
X
j
Tj0j+
X
l
dl+ dGdl
ARj0l
j0 Gj0
Y Rj0 8j0 (50)
X
i
Uij+
X
j0
Tj0j
X
l
dl+ dGdl
AUjl 8j;
(51) X
i
Vji=
X
l
(1 Ad)(rl+rGrl)(BRlj+BUlj) 8j;
(52) X
k
Wjk=
X
l
Ad (rl+ rGrl) (BRlj+ BUlj) 8j;
(53) X
i
X
j
Uij
X
l
dl+ dGdl
; (54)
X
j
Uij ( 'i 'G'i) Xi 8i; (55)
X
j
Vji (i Gi) Xi 8i; (56)
X
i
Uij j Gj
(Y Uj+ Y Rj) 8j;
(57) X
l
dl+ dGdl
AUjl j Gj
Y Uj 8j;
(58) X
l
(r+rGrl) BUlj (1 p0j) j Gj
Y Uj 8j;
(59) X
l
(rl+ rGrl) BRlj j Gj
Y Rj 8j; (60)
X
j
Wjk (!k !G!k) Zk 8k; (61)
Xi; Y Rj; Y Uj; Zk; ARjl; AUjl; BRlj; BUjl2 f0; 1g;
8i 2 I; 8j 2 J; 8l 2 L; 8k 2 K; (62) Uij; Wjk; Vji; Tj0j; Fi ; jF R; F Uj ; kF D; ld; rl 0;
8i 2 I; 8j; j02 J; 8l 2 L; 8k 2 K: (63)
4. Computational experiments and sensitivity analysis results
In this section, several numerical experiments are conducted to show the signicance and performance of the proposed deterministic and robust models, i.e. P (I) and P (II), respectively. To this end, two test problems, whose details are presented in Table 1, are
taken into account and the results are provided under four uncertainty levels, i.e. = 0:25; 0:5; 0:75; 1. Furthermore, nominal data is randomly generated from the uniform distributions presented in Table 2.
To provide numerical results, the determinis-tic and robust models are rst solved under nomi-nal data. Then, under each uncertainty level, ve random realizations are generated from the corre-sponding uncertainty set (i.e., [nominal value G; nominal value + G]) to investigate the
behav-ior of the solutions provided by the proposed deter-ministic and robust models. The models can update their tactical decision variables, namely, ow quan-tities between facilities, i.e. the continuous variables, and assignment variables indicating the assignment of customer zones to the hybrid facilities under each realization. Due to the strategic nature of the decisions regarding the number and location of facilities, and since they cannot be changed in the short time [16,56], the corresponding location variables are xed and can-not be changed under various realizations. However, the violation of chance constraints under realizations should be considered as a penalty in the objective function of the deterministic and robust models [57]. Both models are coded in GAMS 23.5/CPLEX 12.2 op-timization software and all numerical experiments are solved using a Pentium dual-core 2.10 GHz computer with 3 GB RAM.
The deterministic and robust models are rst solved under nominal data. Notably, all uncertainty levels, i.e. F = F R = F U = F D = d = r= =
'= = = !, are equally varied. The respected
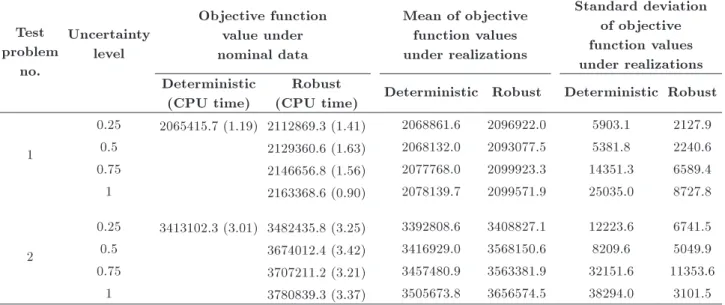
results are reported in the third and fourth columns of Table 3. Furthermore, the computational times are also reported for two test problems in Table 3.
According to these results, it can be armed that the total cost of the concerned forward-reverse network problem under uncertainty is greater than that of the respective deterministic model as expected. On the other hand, with additional costs in the infrastruc-ture, the forward-reverse network will be signicantly more stable against uncertainties. Furthermore, by augmenting the supply chain uncertainty level, total costs of the supply chain network increase due to the conservative nature of the robust optimization approach to uncertainty level.
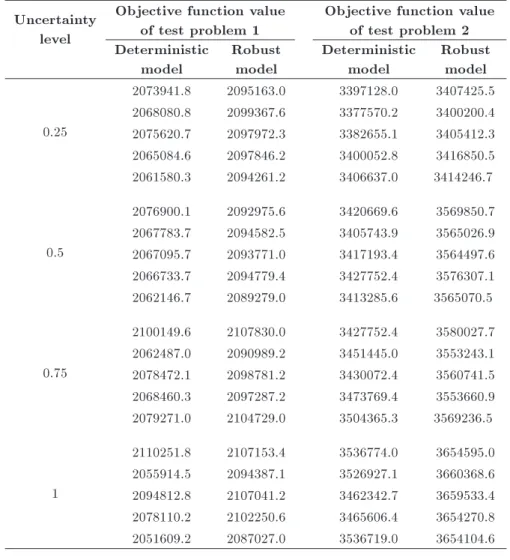
Both deterministic and robust models are also solved under random realizations data. The mean and standard deviation of the objective function val-ues under various realizations are considered as two performance criteria to evaluate these models. The computational results under random realizations are reported in the fth to the eighth columns of Table 3. The entire results are also shown in Table 4. The results presented in Table 3 arm that the robust model generates the solution with both higher quality
Table 1. Details of numerical experiments. Problem
no.
No. of potential HPR centers
No. of potential HDC centers
No. of potential disposal centers
No. of customer
zones
No. of binary variables
No. of constraints
1 5 5 3 8 218 225
2 7 10 5 15 632 631
Table 2. The sources of random generation of model parameters. Parameter Related random
distribution Parameter
Related random distribution ~
dl Uniform (150, 220) c~pfi Uniform (3, 6)
~rl Uniform (90, 140) c~pri Uniform (3, 5)
~
'i Uniform (550, 800) c ~dfj Uniform (1.5, 4)
~i Uniform (300, 400) c ~drj Uniform (1.5, 3)
~j Uniform (350, 550) ~cpk Uniform (2, 4)
~j Uniform (280, 400) F~i Uniform (320000, 480000)
~k Uniform (150, 250) F U~ j Uniform (180000, 260000)
qj Uniform (0.025, 0.15) F D~ k Uniform (150000, 220000)
pj; p0j Uniform (0.1, 0.5) Gdl; Grl Uniform (10, 15)
Ad 0.2 G'
i; Gi; Gj; Gj; G!k Uniform (15, 25)
~
dab Uniform (4, 10) GFi; GF Rj ; GF Uj ; GF Dk Uniform (5000, 10000)
~
F Rj= 1:2 ~F Uj
Table 3. Computational results of comparing performances of deterministic and robust models.
Test problem
no.
Uncertainty level
Objective function value under nominal data
Mean of objective function values under realizations
Standard deviation of objective function values under realizations Deterministic
(CPU time)
Robust
(CPU time) Deterministic Robust Deterministic Robust
1
0.25 2065415.7 (1.19) 2112869.3 (1.41) 2068861.6 2096922.0 5903.1 2127.9
0.5 2129360.6 (1.63) 2068132.0 2093077.5 5381.8 2240.6
0.75 2146656.8 (1.56) 2077768.0 2099923.3 14351.3 6589.4
1 2163368.6 (0.90) 2078139.7 2099571.9 25035.0 8727.8
2
0.25 3413102.3 (3.01) 3482435.8 (3.25) 3392808.6 3408827.1 12223.6 6741.5
0.5 3674012.4 (3.42) 3416929.0 3568150.6 8209.6 5049.9
0.75 3707211.2 (3.21) 3457480.9 3563381.9 32151.6 11353.6
1 3780839.3 (3.37) 3505673.8 3656574.5 38294.0 3101.5
and lower standard deviation. Furthermore, in two test problems except test problem 2 with uncertainty level of 0.25, the robust model dominates the deterministic one in terms of the mean of objective function values. Moreover, with respect to standard deviation, the robust approach dominates the deterministic one with a high dierence in two test problems. Finally, by comparing the columns 4 and 6 in Table 3, it can be concluded that the mean values of the objective
function obtained by the robust optimization model under realizations are lower than those provided under nominal values. The reason for this matter can be in-terpreted as follows. The robust optimization protects the network against the worst case values of uncertain input data. In this manner, the total cost of the network (i.e., the objective function value) signicantly increases. Therefore, the objective function values obtained under nominal data (i.e., column 4) are larger
Table 4. Computational results of solving deterministic and robust models under realizations. Uncertainty
level
Objective function value of test problem 1
Objective function value of test problem 2 Deterministic
model
Robust model
Deterministic model
Robust model
0.25
2073941.8 2095163.0 3397128.0 3407425.5 2068080.8 2099367.6 3377570.2 3400200.4 2075620.7 2097972.3 3382655.1 3405412.3 2065084.6 2097846.2 3400052.8 3416850.5 2061580.3 2094261.2 3406637.0 3414246.7
0.5
2076900.1 2092975.6 3420669.6 3569850.7 2067783.7 2094582.5 3405743.9 3565026.9 2067095.7 2093771.0 3417193.4 3564497.6 2066733.7 2094779.4 3427752.4 3576307.1 2062146.7 2089279.0 3413285.6 3565070.5
0.75
2100149.6 2107830.0 3427752.4 3580027.7 2062487.0 2090989.2 3451445.0 3553243.1 2078472.1 2098781.2 3430072.4 3560741.5 2068460.3 2097287.2 3473769.4 3553660.9 2079271.0 2104729.0 3504365.3 3569236.5
1
2110251.8 2107153.4 3536774.0 3654595.0 2055914.5 2094387.1 3526927.1 3660368.6 2094812.8 2107041.2 3462342.7 3659533.4 2078110.2 2102250.6 3465606.4 3654270.8 2051609.2 2087027.0 3536719.0 3654104.6
than those obtained under realizations (i.e., column 6).
The computational times are reported in the third and fourth columns in Table 3. They show the computational time in seconds for solving the deterministic and robust models. According to these results, it can be armed that both deterministic and robust models are solved in a reasonable time.
4.1. Sensitivity analysis
After validating the proposed robust model, we con-ducted a sensitivity analysis to show the usefulness of incorporating the reliability concepts into the proposed model to mitigate the impacts of disruptions. We study the impact of the size of capacity disruptions (i.e., by changing the corresponding capacity failure fraction at unreliable HDC facilities) on the location of reliable and unreliable HDC facilities and their numbers, total network costs, transportation costs, costs of sharing strategy, and the amount of products trans-shipped from reliable HDC facilities to unreliable ones after disruption. To do so, the capacity failure fractions (i.e., pj = p0j) are equally varied. It should be mentioned
Figure 2. Capacity disruptions vs objective function.
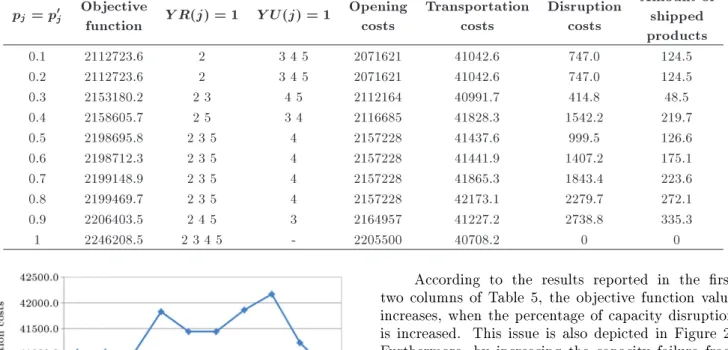
that the sensitivity analysis is carried out on test problem 1 with uncertainty level of 0.25. The details of the results are reported in Table 5 and graphically depicted in Figures 2-4.
The rst column of Table 5 presents the per-centage of capacity disrupted at unreliable HDC fa-cilities. The second and the fth columns illustrate the objective function value and the xed opening
Table 5. Results of sensitivity analysis.
pj= p0j Objectivefunction Y R(j) = 1 Y U(j) = 1 Openingcosts Transportationcosts Disruptioncosts
Amount of shipped products
0.1 2112723.6 2 3 4 5 2071621 41042.6 747.0 124.5
0.2 2112723.6 2 3 4 5 2071621 41042.6 747.0 124.5
0.3 2153180.2 2 3 4 5 2112164 40991.7 414.8 48.5
0.4 2158605.7 2 5 3 4 2116685 41828.3 1542.2 219.7
0.5 2198695.8 2 3 5 4 2157228 41437.6 999.5 126.6
0.6 2198712.3 2 3 5 4 2157228 41441.9 1407.2 175.1
0.7 2199148.9 2 3 5 4 2157228 41865.3 1843.4 223.6
0.8 2199469.7 2 3 5 4 2157228 42173.1 2279.7 272.1
0.9 2206403.5 2 4 5 3 2164957 41227.2 2738.8 335.3
1 2246208.5 2 3 4 5 - 2205500 40708.2 0 0
Figure 3. Capacity disruptions vs transportation costs.
Figure 4. Capacity disruptions vs disruption costs.
costs, respectively. The third and fourth columns show the location of the reliable and unreliable HDC facilities and their opened numbers. The sixth column indicates the transportation costs between facilities and customers. The seventh column reports the disruption costs (Pj0Pj6=j0d~j0jTj0j) associated with the sharing
strategy, which are the costs of trans-shipping products from reliable HDC facilities to unreliable ones in a disruption situation. Furthermore, the last column shows the amounts of trans-shipped products between reliable and unreliable HDC facilities (Pj0
P
j6=j0Tj0j)
when capacities are disrupted.
According to the results reported in the rst two columns of Table 5, the objective function value increases, when the percentage of capacity disruption is increased. This issue is also depicted in Figure 2. Furthermore, by increasing the capacity failure frac-tions, the model determines that more reliable HDC facilities must be located. However, when the capacity disruptions are small, most of the located HDC facili-ties are unreliable. This matter illustrates the impact of capacity disruptions on the location of reliable and unreliable HDC facilities as well as their numbers (see columns 3 and 4 of Table 5).
The xed opening costs are not changed or in-creased when capacities are increasingly disrupted. In the cases where the location of reliable and unreli-able HDC facilities is not changed by increasing the percentage of capacity disruptions (for example, see rows 6-9 in Table 5), the amount of products trans-shipped from reliable HDC facilities to unreliable ones and the corresponding costs, i.e. disruption costs, are increased. In these cases, the transportation costs are also increased. Figures 3 and 4 depict the behavior of the disruption costs and transportation costs at dierent levels of capacity disruptions, respectively. The above discussions approve the application of capac-ity disruptions, sharing strategy, and other reliabilcapac-ity concepts in our proposed model.
5. Concluding remarks
This paper oers a robust and reliable model to protect an integrated forward-reverse logistics network against random facility disruptions and, at the same time, to cope with existing uncertainties in the model parameters. To capture random facility disruptions, several reliability strategies and assumptions are taken into account. Random disruption at hybrid HDC facilities is taken into consideration. In this manner, two types of facilities, reliable or unreliable HDC
facilities, are allowed to be located in the concerned network. Furthermore, partial and complete capacity disruptions and a sharing strategy are also considered, which can improve the service level after occurrence of disruptions. To deal with the uncertainty in the parameters of the network, a robust optimization approach is applied to the original deterministic model. The eect of capacity disruptions on the objective function, opening and transportation costs, disruption costs, and the amount of shared products between HDC facilities are also investigated through a sensitivity analysis.
Finally, some directions are stated for future research. It is possible to incorporate the reliability concepts into the transportation and inventory deci-sions to design a more reliable supply chain network. Modeling the dierent types of disruption (caused by natural, man-made, or technological threats) and their impacts on facilities and/or transportation links through a scenario-based approach would be of partic-ular interest.
Acknowledgments
The authors are grateful to the respected reviewers for their constructive and valuable comments in prepara-tion of the revised manuscript.
References
1. Fleischmann, M., Beullens, P., Bloemhof-Ruwaard, J.M. and Wassenhove, L. \The impact of product recovery on logistics network design", Production and Operations Management, 10, pp. 156-173 (2001). 2. Lee, D. and Dong, M. \A heuristic approach to logistics
network design for end-of-lease computer products recovery", Transportation Research Part E, 44, pp. 455-474 (2007).
3. Lin, L., Gen, M. and Wang, X. \Integrated multistage logistics network design by using hybrid evolutionary algorithm", Computers & Industrial Engineering, 56, pp. 854-873 (2009).
4. Pishvaee, M.S., Jolai, F. and Razmi, J. \A stochas-tic optimization model for integrated forward/reverse logistics network design", Journal of Manufacturing Systems, 28, pp. 107-114 (2009).
5. Fleischmann, M., Krikke, H.R., Dekker, R. and Flap-per, S.D.P. \A characterisation of logistics networks for product recovery", Omega, 28, pp. 653-666 (2000). 6. Krikke, H., Bloemhof-Ruwaard, J. and Van Wassen-hove, L.N. \Concurrent product and closed-loop sup-ply chain design with an application to refrigerators", International Journal of Production Research, 41, pp. 3689-3719 (2003).
7. Kleindorfer, P. and Saad, G. \Managing disruption risks in supply chains", Production and Operations Management, 14, pp. 53-68 (2005).
8. Peng, P., Snyder, L.V., Lim, A. and Liu, Z. \Reliable logistics networks design with facility disruptions", Transportation Research Part B, 45, pp. 1190-1211 (2011).
9. Klibi, W., Martel, A. and Guitouni, A. \The design of robust value-creating supply chain networks: a critical review", European Journal of Operational Research, 203, pp. 283-293 (2010).
10. Listes, O. and Dekker, R. \A stochastic approach to a case study for product recovery network design", European Journal of Operational Research, 160, pp. 268-287 (2005).
11. Salema, M.I.G., Barbosa-Povoa, A.P. and Novais, A.Q. \An optimization model for the design of a capacitated multi-product reverse logistics network with uncer-tainty", European Journal of Operational Research, 179, pp. 1063-1077 (2007).
12. Listes, O. \A generic stochastic model for supply-and-return network design", Computers and Operations Research, 34, pp. 417-442 (2008).
13. Ding, H., Benyoucef, L. and Xie, X. \Stochastic multi-objective production-distribution network design using simulation based optimization", International Journal of Production Research, 47, pp. 479-505 (2009). 14. Lee, D. and Dong, M. \Dynamic network design
for reverse logistics operations under uncertainty", Transportation Research Part E, 45, pp. 61-71 (2009). 15. El-Sayed, M., Aa, N. and El-Kharbotly, A. \A stochastic model for forward-reverse logistics network design under risk", Computers & Industrial Engineer-ing, 58, pp. 423-431 (2010).
16. Pishvaee, M.S., Rabbani, M. and Torabi, S.A. \A robust optimization approach to closed-loop supply chain network design under uncertainty", Applied Mathematical Modeling, 35, pp. 637-649 (2011). 17. Hasani, A., Zegordi, S.H. and Nikbakhsh, E. \Robust
closed-loop supply chain network design for perishable goods in agile manufacturing under uncertainty", In-ternational Journal of Production Research, 50, pp. 4649-4669 (2012).
18. Mula, J., Poler, R. and Garcia, J.P. \MRP with ex-ible constraints: a fuzzy mathematical programming approach", Fuzzy Sets and Systems, 157, pp. 74-97 (2006).
19. Torabi, S.A. and Hassini, E. \An interactive possibilis-tic programming approach for multiple objective sup-ply chain master planning", Fuzzy Sets and Systems, 159, pp. 193-214 (2008).
20. Mitra, K., Gudi, R.D., Patwardhan, S.C. and Sardara, G. \Towards resilient supply chains: Uncertainty anal-ysis using fuzzy mathematical programming", Chemi-cal Engineering Research and Design, 87, pp. 967-981 (2009).
21. Pishvaee, M.S. and Torabi, S.A. \A possibilistic programming approach for closed-loop supply chain network design under uncertainty", Fuzzy Sets and Systems, 161, pp. 2668-2683 (2010).
22. Bouzembrak, Y., Allaoui, H., Goncalves, G., Bouchriha, H. and Baklouti, M. \A possibilistic linear programming model for supply chain network design under uncertainty", IMA Journal of Management Mathematics, 24, pp. 209-229 (2013).
23. Vahdani, B., Razmi, J. and Tavakkoli-Moghaddam, R. \Fuzzy possibilistic modeling for closed loop recycling collection networks", Environmental Modeling and As-sessment, 17, pp. 623-637 (2012).
24. Drezner, Z. \Heuristic solution methods for two loca-tion problems with unreliable facilities", The Journal of the Operational Research Society, 38, pp. 509-514 (1987).
25. Snyder, L.V. and Daskin, M. \Reliability models for facility location: the expected failure cost case", Transportation Science, 39, pp. 400-416 (2005). 26. Snyder, L.V., Scaparra, M., Daskin, M. and Church, R.
\Planning for disruptions in supply chain networks", In TutORials in Operations Research, INFORMS, Green-berg, H., Ed., Baltimore, pp. 234-257 (2006).
27. Berman, O., Krass, D. and Menezes, M. \Facility reliability issues in network p-median problems: strate-gic centralization and co-location eects", Operations Research, 55, pp. 332-350 (2007).
28. Cui, T., Ouyang, Y. and Shen, Z.J.M. \Reliable facility location design under the risk of disruptions", Operations Research, 58, pp. 998-1011 (2010). 29. Li, X. and Ouyang, Y. \A continuum approximation
approach to reliable facility location design under correlated probabilistic disruptions", Transportation Research Part B, 44, pp. 535-548 (2010).
30. Qi, L., Shen, Z.-J.M. and Snyder, L.V. \The eect of supply disruptions on supply chain design decisions", Transportation Science, 44, pp. 274-289 (2010). 31. Lim, M., Daskin, M.S., Bassamboo, A. and Chopra, S.
\A facility reliability problem: formulation, properties and algorithm", Naval Research Logistics, 57, pp. 58-70 (2010).
32. Azad, N., Saharidis, G.K.D., Davoudpour, H., Malekly, H. and Yektamaram, S.A. \Strategies for protecting supply chain networks against facility and transportation disruptions: an improved Benders de-composition approach", Annals of Operations Re-search, 210, pp. 125-163 (2012).
33. Davarzani, H., Zegordi, S.H. and Norrman, A. \Con-tingent management of supply chain disruption: Ef-fects of dual or triple sourcing", Scientia Iranica, Transactions E: Industrial Engineering, 18, pp. 1517-1528 (2011).
34. Lim, M.K., Bassamboo, A., Chopra, S. and Daskin, M.S. \Facility location decisions with random dis-ruptions and imperfect estimation", Manufacturing and Service Operations Management, 15, pp. 239-249 (2013).
35. Aboolian, R., Cui, T. and Shen, Z.J.M. \An ecient approach for solving reliable facility location models", INFORMS Journal on Computing, 25, pp. 720-729 (2013).
36. Baghalian, A., Rezapour, S. and Zanjirani Farahani, R. \Robust supply chain network design with service level against disruptions and demand uncertainties: A real-life case", European Journal of Operational Research, 227, pp. 199-215 (2013).
37. Babazadeh, R. and Razmi, J. \A robust stochastic pro-gramming approach for agile and responsive logistics under operational and disruption risks", International Journal of Logistics Systems and Management, 13, pp. 458-482 (2012).
38. Garcia-Herreros, P., Grossmann, I.E. and Wassick, J. \Design of supply chains under the risk of facility disruptions", Computer Aided Chemical Engineering, 32, pp. 577-582 (2013).
39. Vahdani, B., Tavakkoli-Moghaddam, R. and Jolai, F. \Reliable design of a logistics network under uncer-tainty: A fuzzy possibilistic-queuing model", Applied Mathematical Modelling, 37, pp. 3254-3268 (2013). 40. Vahdani, B., Tavakkoli-Moghaddam, R., Jolai, F. and
Baboli, A. \Reliable design of a closed loop supply chain network under uncertainty: An interval fuzzy possibilistic chance constrained model", Engineering Optimization, 45, pp. 745-765 (2013).
41. Vahdani, B., Tavakkoli-Moghaddam, R., Modarres, M. and Baboli, A. \Reliable design of a forward/reverse logistics network under uncertainty: A robust-M/M/c queuing model", Transportation Research Part E: Lo-gistics and Transportation Review, 48, pp. 1152-1168 (2012).
42. Hate, S.M. and Jolai, F. \Robust and reliable forward-reverse logistics network design under demand uncertainty and facility", Applied Mathematical Mod-elling, 38, pp. 2630-2647 (2014).
43. Hate, S.M. and Jolai, F. \Reliable forward-reverse logistics network design under partial and complete facility disruptions", International Journal of Logistics Systems and Management, 20, pp. 370-394 (2015). 44. Bertsimas, D. and Sim, M. \Robust discrete
optimiza-tion and network ows", Mathematical Programming Series B., 98, pp. 49-71 (2003).
45. Bertsimas, D. and Sim, M. \The price of robustness", Operations Research, 52, pp. 35-53 (2004).
46. Easwaran, G. and Uster, H. \A closed-loop supply chain network design problem with integrated forward and reverse channel decisions", IIE Transactions, 42, pp. 779-792 (2010).
47. Soyster, A.L. \Convex programming with set-inclusive constraints and applications to inexact linear program-ming", Operations Research, 21, pp. 1154-1157 (1973). 48. El-Ghaoui, L. and Lebert, H. \Robust solutions to least-square problems to uncertain data matrices", SIAM Journal on Matrix Analysis and Applications, 18, pp. 1035-1064 (1997).
49. El-Ghaoui, L., Oustry, F. and Lebert, H. \Robust solutions to uncertain semi-denite programs", SIAM Journal on Optimization, 9, pp. 33-52 (1998).
50. Ben-Tal, A. and Nemirovski, A. \Robust convex opti-mization", Mathematics of Operations Research, 2, pp. 769-805 (1998).
51. Ben-Tal, A., Nemirovski, A. \Robust solutions to un-certain linear programs", Operations Research Letters, 25, pp. 1-13 (1999).
52. Ben-Tal, A. and Nemirovski, A. \Robust solutions of linear programming problems contaminated with uncertain data", Mathematical Programming, 88, pp. 411-424 (2000).
53. Ben-Tal, A., Golany, B., Nemirovski, A. and Vial, J.P. \Retailer-supplier exible commitments contracts: a robust optimization approach", Manufacturing and Service Operations Management, 7, pp. 248-271 (2005).
54. Ben-Tal, A., El-Ghaoui, L. and Nemirovski, A., Robust Optimization, Princeton University Press (2009). 55. Melo, M.T., Nickel, S. and Saldanha da Gama F.
\Facility location and supply chain management - A review", European Journal of Operational Research, 196, pp. 401-412 (2009).
56. Meepetchdee, Y. and Shah, N. \Logistical network de-sign with robustness and complexity considerations", Int. J. Phys. Distrib. Log. Manage., 37, pp. 201-222 (2007).
57. Pishvaee, M.S., Razmi, J. and Torabi, S.A. \Robust possibilistic programming for socially responsible sup-ply chain network design: A new approach", Fuzzy Sets and Systems, 206, pp. 1-20 (2012).
Biographies
Seyed Morteza Hate is currently an Assistant Professor in the Faculty of Engineering at Shahrekord University, Iran. He received his BS degree in Statistics from Shahid Beheshti University, Tehran, in 2006, and his MS and PhD degrees in Industrial Engineering from University of Tehran, Tehran, in 2009 and 2013,
respectively. His current research interests include: supply chain network design, logistics systems, multi-criteria decision making, data envelopment analysis, performance measurement and management, opera-tions research applicaopera-tions, construction and project management.
Fariborz Jolai is currently professor of Industrial Engineering at College of Engineering, University of Tehran, Tehran, Iran. He obtained his PhD degree in Industrial Engineering from INPG, Grenoble, France, in 1998. His current research interests are schedul-ing and production plannschedul-ing, supply chain modelschedul-ing, and optimization problems under uncertainty condi-tions.
Seyed Ali Torabi is currently Associate Professor of Industrial Engineering at College of Engineering, University of Tehran, Tehran, Iran. His current research interests are supply chain modeling, disas-ter management, multi-cridisas-teria decision making, fuzzy mathematical programing, inventory management, and optimization problems under uncertainty conditions. Reza Tavakkoli-Moghaddam is currently professor of Industrial Engineering at College of Engineering, University of Tehran, Tehran, Iran. He received his MS degree in Industrial Engineering from University of Melbourne and PhD degree from Swinburne Uni-versity of Technology. He is Professor of Industrial Engineering at University of Tehran in Iran. He consulted for a number of manufacturing and service rms. His research is directed towards facilities layout and location design, cellular manufacturing system, sequencing and scheduling, and using meta-heuristics for combinatorial optimization problems. He is the author of over 100 journal papers and 150 papers in conference proceedings.