Sharif University of Technology
Scientia IranicaTransactions A: Civil Engineering www.scientiairanica.com
Detecting shoreline changes in Chabahar Bay by
processing satellite images
S. Zeinali
a;, M. Dehghani
a, M.A. Rastegar
aand M. Mojarrad
ba. Department of Civil and Environmental Engineering, Faculty of Engineering, Shiraz University, Shiraz, Iran. b. Department of Civil and Architectural Engineering, the Royal Institute of Technology, KTH, Sweden. Received 10 September 2015; received in revised form 11 February 2016; accepted 30 May 2017
KEYWORDS Chabahar; Shoreline; Sensor; Satellite image; Change detection.
Abstract. Monitoring coastal areas is an important parameter in the sustainable development and protection of the environment. The expansion of constructions in Iran's southern coasts has not only led to the destruction of geomorphological landforms, but has also changed the process of erosion and sedimentation in coastal areas. Nowadays, remote sensing data are considered as the most ecient source of information for the study and interpretation of coastal landforms, tidal levels, changes in coastline, depth of water, and so forth. The purpose of this study is to investigate the changes in the coastline of Chabahar Gulf, located on the coasts of the Oman Sea by using remote sensing techniques. This study examined and interpreted qualitative and quantitative changes of the coastlines in a forty-two-year period. Dierent supervised classication methods were used from which the most accurate one was ultimately chosen. The classied images were divided into two classes of land and water, and the changes of these two classes between 1972 and 2014 were extracted. The net change results indicate that in the forty-two-year period, 1,832,436 m2
of the land has been added to water class, and 7,004,844 m2 of water has been added to
land.
© 2017 Sharif University of Technology. All rights reserved.
1. Introduction
Natural phenomena undergo dramatic changes during the life of mankind [1]. The important point is to examine the changes carefully in order to understand the anthropogenic and natural processes which cause these changes. Over the past few decades, the use of remote sensing technology to detect such changes over time has attracted the attention of dierent researchers [2].
Coastal environments are among the most critical environmental systems which change rather quickly *. Corresponding author.
E-mail addresses: [email protected] (S. Zeinali); Rastegar [email protected] (A. Rastegar);
[email protected] (M. Mojarrad)
under the inuence of hydrodynamic processes and are perhaps not comparable with other geomorpho-logical systems [3]. Coastlines are among the most important phenomena on the Earth's surface which are dynamic in nature [4]. Thus, the International Geographical Union has considered coastal areas as the most unique natural environment [5]. Therefore, in the study of coastal geomorphology, we face a dierent form of dynamic events [6]. Coastal areas are also highly important and valuable from the environmental point of view as they have sensitive and productive ecosystems [7].
Monitoring coastal area is an important param-eter in the sustainable development and protection
of environment. For monitoring coastal areas, it
is required to extract coastlines in dierent times. Dierent reactions occur in the coastal areas because
S. Zeinali et al./Scientia Iranica, Transactions A: Civil Engineering 24 (2017) 1802{1809 1803
they are located in two dierent climates of land and water [8]. The coastline is dened as the line of contact between land and a body of water [9]. Sea processes are characterized by the movements of water, while land processes are dened by the transfer of rivers' water and sediments to the sea [10].
Due to numerous human applications, coasts have always proved to be sensitive areas [11]. The expansion of constructions in Iran's southern coasts has not only led to the destruction of geomorphological landforms, but has also changed the process of erosion and sedi-mentation in coastal areas so that in addition to erosion in canals and estuaries, increased sedimentation has been observed in some coasts. Evidence suggests that the increased rate of sedimentation in coastal areas is about 50%. The sedimentation process occurs mainly behind the breakwaters of ports and structures that have been built on the coasts of Iran since 1990 [12].
Remote sensing technology is an ecient method to obtain the data required for monitoring the coast-line. Nowadays, remote sensing data are the most ecient source of information for the study and inter-pretation of coastal landforms, tidal levels, changes in coastline, depth of water, and so forth [13]. Among the remote sensing data, optical images have many benets such as easy interpretation and ease of access. On the other hand, the spectral characteristics of water are such that there is a signicant dierence between reective infrared and visible bands [14]. This feature of water has led to the widespread use of images by sensors that have both visible and reective infrared bands for monitoring and extraction of coastlines. TM and ETM+ sensors of the Landsat satellite are of this kind [15].
Many studies in the eld of coastline changes and their reasons have been done using satellite images. Al-Sheikh et al. [16] monitored the coastlines of Urmia Lake using TM and ETM images and thresholding method on the image histogram. Naimi et al. [12] examined the changes in the coastline of Asalouyeh region in the Persian Gulf by using dierent change detection methods. In his study, Kouroshnia [7] also examined the changes of coastline from Naiband Bay to Dayer Port using the images of TM and ETM+ sensors.
Visual interpretation of MSS, TM, ETM+, and LISS III images for the detection of periodic (30 years) and seasonal (72 days) changes of the eastern coastline of Urmia Lake has been already carried out [17]. In another study, Shayan et al. [18] studied the coastline of Gorgan Bay at dierent time intervals between 1955, 1987, 2005, and 2011 using TM and ETM+ images. Changes in the coastline of Maharlu Lake have been examined using TM data on March 20, 1999 and March 18, 2009 [19]. Yamani et al. [20] compared and evaluated the periodic changes of the
eastern coast of the Strait of Hormuz using satellite TM-5 images spanning between 1986 and 2010 and applying dierent classication methods, i.e. Maximum Likelihood, Binary Encoding, and Minimum Distance. Qudah and Harahsheh [21] used GIS and remote sensing technology as a useful tool for assessing the boundaries of the Dead Sea in Jordan and Pales-tine.
White et al. [22] investigated changes in the coastline of the Nile Delta using TM images and compared the results with eld observations. Using aerial photographs of the years 1981, 1992, and 2002 and the analytical capabilities of GIS, Makota et al. [23] mapped the coastlines of Kunduchi Beach. Chalabi et al. [24] used segmentation method in order to extract the coastline of Kuala Terenganu in Malaysia applying aerial photos and IKONOS images. They mapped, interpreted, and analyzed the changes for a thirty-eight-year period (1976-2014).
According to the previous studies, it can be con-cluded that the change detection methods are highly variable due to dierent available datasets and study area characteristics. The main purpose of this paper is to detect the coastline changes in Chabahar Bay located in the coasts of Oman Sea using remote sensing techniques. Many numerical models have been made for monitoring coastlines changes [25-28]. To date, no comprehensive study on change detection based on remote sensing has been carried out. The numerical models generated up to now have covered only the time interval less than 10 years, while the available remote sensing data spans more than 4 decades. In addition, vast and continuous coverage, high spatial resolution, high-speed processing, and low-cost preparation and processing of information are some other features of this technique.
This paper is organized as follows. The study area is presented in Section 2. In Section 3, dierent methods for change detection mapping will be ex-plained. Section 4 is devoted to the results obtained by dierent methods. Concluding remarks are presented in Section 5.
2. Scope of the study
Chabahar Port, as one of the most important ports, is located in the south of Iran and north of the Oman Sea (Figure 1). Due to its strategic position and free access to international waters, this port has a special place for trading with other countries in the region. In general, the port of Chabahar is located in an area with hot and humid summers and mild winters. In terms of the climate, it is considered as an arid area due to the low rainfall. Due to its special geographical position, Chabahar has many sunshine hours per year which is a rare situation on Earth. [25].
Figure 1. Location of Chabahar Bay on the southern coast of Iran and northern Oman Sea.
3. Methods
This study examines and interprets the qualitative and quantitative coastline changes in a period of forty-two years using remote sensing data.
The available remote sensing data includes MSS, TM, ETM+, and OLI Landsat acquired in 1972, 1987, 2000, and 2014, respectively (Figure 2). The specications of these sensors can be seen in Table 1. In order to extract the coastline from the imageries, supervised classication methods are used.
Four dierent methods, including Minimum Dis-tance, Maximum Likelihood, Neural Network, and Binary Encoding, have been used to classify image pixels into two categories of land and water. Finally, by comparing the results, the most accurate method for classication was nally applied to the data. In the following, classication methods are briey described. 3.1. Minimum Distance Classication (MDC) In this method, in the n-dimensional spectral space, the distance of each pixel (qualitatively) from the mean vector is the basis of classication which becomes pos-sible by using the Euclidean distance [20]. Therefore, each pixel is given to the class with the minimum spectral distance.
Figure 2. True color composite of (a) MSS image (1972), (b) TM image (1987), (c) ETM+ image (2000), and (d) OLI image (2014).
3.2. Maximum Likelihood Classication (MLC)
The algorithm used by the Maximum Likelihood Clas-sication tool is based on two principles: (i) The cells
S. Zeinali et al./Scientia Iranica, Transactions A: Civil Engineering 24 (2017) 1802{1809 1805
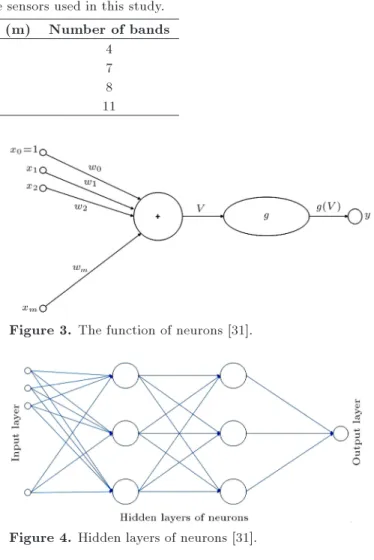
Table 1. Specications of the sensors used in this study. Sensor Spatial resolution (m) Number of bands
MSS 57 4
TM 28.5 7
ETM+ 30 8
OLI 30 11
in each class sample in the multi-dimensional space are normally distributed, and (ii) Bayes' theorem of decision making.
In this method, the likelihood (probability) that a class is the correct class for a pixel is calculated. The pixel is a member of the class with the maximum probability. Maximum likelihood classication method is still one of the most common supervised classication algorithms. To calculate probability, the n-dimensional multivariate normal density function is used as follows:
P (XjWi)= 1
2n
2jVij12exp
1
2(x Mi)TVi 1(x Mi)
; (1) where jVij is the determinant of the covariance matrix,
Viis the covariance matrix, and Miis the mean vector.
The values of these variables were estimated based on the training data extracted from the Landsat TM images.
3.3. Binary Encoding Classication (BEC) This method encodes the data and range of end-members in the form of zero and one depending on whether a band descends lower or ascends higher than the spectral average, respectively. An OR encoding function compares each encrypted base spectrum with the encoded data and generates a classied image. All the pixels are classied with the largest number of compatible bands by the endmember method [29]. With three thresholds, a pair of binary numbers is generated for the values of pixels. Higher values of average spectrum brightness can be the threshold of one and the other two may be above or below this value [30].
3.4. Neural Net Classication (NNC)
Articial neural networks are rather crude electronic networks of \neurons" on the basis of the neural structure of the brain. They process records one at a time and \learn" by comparing their classication of the record with the known actual classication of the record. The errors from the initial classication of the rst record are fed back into the network and are used to modify the second record of the algorithm of the networks, and this process is repeated many times. It can be said that a neuron in an articial neural network is (Figure 3):
A set of input values (xi) and the associated weights
(wi)
Figure 3. The function of neurons [31].
Figure 4. Hidden layers of neurons [31].
A function (g) that sums the weights and maps the
results in an output (y).
The neurons have a multi-layer arrangement (Fig-ure 4). The input layer is not composed of all the neurons. Rather, it has the values of the recorded data within it which are used as the inputs of the neurons of the next layer. The next layer is called the hidden layer (the number of these layers can be more than one). The nal layer is the output layer where there is only one node for each class. Each single sweep forward of the network results in the assignment of a value to each output node and the output node with the highest value will be chosen [31].
4. Results and discussion
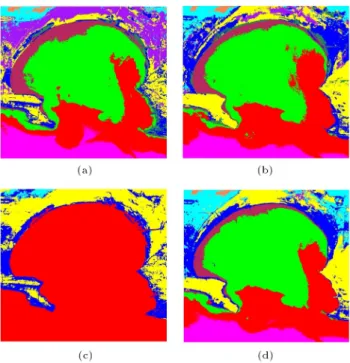
For supervised classication, ve classes were generally dened including deep areas of the bay, shallow waters, estuaries, sandy beach, and eventually barren lands. For each class, at least 1000 pixels were collected as training data. The above-mentioned methods were applied to classication. The classication results are shown in Figure 5. The confusion matrix was formed
Figure 5. The results obtained by classiers: (a) MDC, (b) MLC, (c) BEC, and (d) NNC methods.
between the training data and the classication results. The overall accuracy and Kappa coecients as mea-sures of classier performance were calculated based on the confusion matrix. The overall accuracy derived from the confusion matrix is presented in Table 2.
As observed in Table 2, it can be found that the performance of the Maximum Likelihood method is the most signicant. Therefore, the result obtained from this method is used for further analysis.
Five classes derived from the classication must be then combined into two classes of land and water
(Figure 6). Using Change Detection method, we
extract the dierence between the images in dierent years (Figure 7). The red color indicates the pixels converted from water into land, and the blue color represents the pixels changed from land to water during the specied time interval.
The numerical results of these changes for the temporal period between 1972 and 2014 (which is the nal period considered in this study) can be seen in Table 3. The calculated percentages are related to the total surface area.
Figure 6. The result of combining classes into two clas-ses of land and water in (a) 1972, (b) 1987, (c) 2000, and (d) 2014.
Figure 7. The result of the dierence between the images between (a) 1972 and 1987, (b) 1972 and 2000, and (c) 1972 and 2014.
As can be seen in Figure 7(b) and (c), some red pixels are related to the harbors constructed in this pe-riod which are certainly not considered as the changes
Table 2. Performance of dierent classiers.
Year Minimum distance Maximum likelihood Binary encoding Neural net Overall
accuracy
Kappa coecient
Overall accuracy
Kappa coecient
Overall accuracy
Kappa coecient
Overall accuracy
Kappa coecient
1972 98.781 0.983 99.043 0.986 71.657 0.616 99.859 0.997
1987 10.00 1.00 100.00 1.00 62.743 0.499 100.00 1.00
2000 100.00 1.00 100.00 1.00 64.140 0.528 98.593 0.972
S. Zeinali et al./Scientia Iranica, Transactions A: Civil Engineering 24 (2017) 1802{1809 1807
Table 3. The amount of changes in coastline, land, and water pixels. Total number of the examined pixels 189000
Number of unchanged pixels 186280 The area added from the land to water, from 1972 to 2014 1832436
Added percent from the land to water, from 1972 to 2014 0.298 The area added from water to the land, from 1972 to 2014 7004844
Added percent from water to the land, from 1972 to 2014 1.141
of the coastline. Therefore, the numerical values of Ta-ble 3 are presented after removing the pixels and count-ing them as unchanged pixels. The emergence of these phenomena in the dierence between the images ipso facto conrms the correct classication of the images.
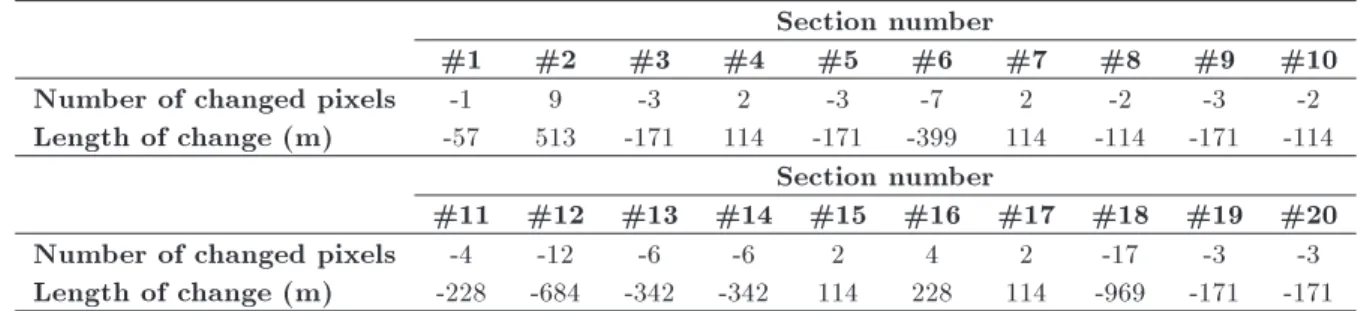
For a more detailed study of coastline changes and to achieve more tangible values for these changes, the numerical values of coastline advance and retreat have been extracted in several places according to Figure 8. The numerical values of changes in the specied sections are presented in Table 4.
In general, changes from 1972 to 2014 represent an increase in the number of land pixels which indicates the general trend of coastline advance. This trend can also be seen in the years 1972, 1987, 2000, and 2014 at smaller intervals in Table 5 which shows the one-way change of the region toward the coastline advance. Local changes can be observed in Figure 8 and Table 4.
In Table 4, the negative values indicate coastline advance and correspond with red areas of Figure 8, while the positive values indicate a retreat in the coastline and are equivalent to the blue areas of Figure 8. According to Figure 8 and Table 4, the highest value recorded is related to section 18 which is 969 meters, carefully shown in Figure 2(d). This
Figure 8. Sections of the coastline changes.
region indicates excessive sedimentation caused by the construction of the structure and does not seem to have occurred naturally. Putting aside this section, the maximum amount of coastline advance belongs to section 12 with 684 meters of advance, and the highest amount of coastline retreat, 513 meters, belongs to section 2. Areas with severe coastline advance are not
Table 4. Amounts of changes across the sections specied in Figure 8. Section number
#1 #2 #3 #4 #5 #6 #7 #8 #9 #10
Number of changed pixels -1 9 -3 2 -3 -7 2 -2 -3 -2
Length of change (m) -57 513 -171 114 -171 -399 114 -114 -171 -114 Section number
#11 #12 #13 #14 #15 #16 #17 #18 #19 #20
Number of changed pixels -4 -12 -6 -6 2 4 2 -17 -3 -3
Length of change (m) -228 -684 -342 -342 114 228 114 -969 -171 -171
Table 5. Changes in water and land areas in dierent years with respect to 1972.
Year Water
(m2)
Land (m2)
Total (m2)
Changes in water (m2)
Changes in land (m2)
1972 417,909,123.00 196,151,877.00 614,061,000.00 { { 1987 416,848,324.50 197,212,675.50 614,061,000.00 -1,060,798.50 1,060,798.50 2000 413,631,814.50 200,429,185.50 614,061,000.00 -3,216,510.00 3,216,510.00 2014 412,995,510.00 201,065,490.00 614,061,000.00 -636,304.50 636,304.50
appropriate for the construction of oshore structures and the most erosive areas are also not recommended due to excessive erosion. The location of section 2, which shows the highest coastline retreat in the vicinity of a constructed structure, can cause damage to this structure and must be taken into account.
It should be noted that this study is only con-cerned with changes in coastline, and the constructed coastal facilities are out of the scope of this study. Therefore, the pixel values of the coastal facilities included in the land category and constructed in this period are excluded from the land category and added to the water category. The values in Table 5 are inserted after applying these changes. Therefore, the values in Table 5 show the net amount of changes in the region's coastline.
5. Conclusion
Coastal instability and the considerable movement of coastline, coastal erosion caused by waves, currents, storms, etc. and causing damage to coastal facilities and structures, human induced changes in the nature of coastal areas and other similar matters are some signicant problems and diculties with which many countries and areas with sea borders face [25]. Dierent classication methods, including MDC, MLC, BEC, and NNC, were examined. The results showed the superiority of the MLC over the other methods. Time-series analysis of changes in the coastline was per-formed according to the MLC. The overall procedure of the region indicates sediment sedimentation.
However, a more detailed study of the area shows that the overall process of sedimentation is the result of total sedimentation and erosion of smaller areas in the region which can be seen in the results. From the results of the study, it can be seen that the highest rate of coastline advance is 684 meters and the highest rate of retreat of the coastline is 513 meters. Finally, the results of coastline advance and retreat can be used in the integrated management of coastal areas. In addition, the results will be reliable for keeping and maintaining the existing structures, for preventing the possible hazards in the vicinity of these structures, and for the general direction in planning and constructing structures in the future.
References
1. Macleod, R.S. and Congalton, R.G. \A quantitative comparison of change detection algorithms for mon-itoring eelgrass from remotely sensed data", Pho-togrammetric and Remote Sensing, 64(3), pp. 207-216 (1988).
2. Singh, A. \Digital change detection techniques using
remotely sensed data", Int. J. of Remote Sensing, 10(6), pp. 989-1003 (1989).
3. Yamani, M. and Nohegar, A. \Coastal area location and literature review", In The Geomorphology of East Coast of Hormoz Strait, 1st Edn., pp. 7-83, Univer-sity of Hormozgan Publications, Bandar-e-Abbas, Iran (2006).
4. Winareso, G. and Budhiman, S. \The potential ap-plication of remote sensing data for coastal study", Proc. of 22nd Asian Conference on Remote Sensing, 2, Singapore, pp. 1-5 (2001).
5. Rasuly, A., Naghdifar, R. and Rasoli, M. \Monitoring of Caspian Sea coastline changes using object oriented techniques", Procedia Environmental Sciences, 2, pp. 416-426 (2010).
6. Ahmadi, H. \Erosion by water", In Applied Geomor-phology, 2nd Edn., University of Tehran Publications, Tehran, Iran (2011).
7. Kouroshinia, A. \Monitoring coastline changes using RS & GIS", Bandar va Darya Magazine, 175, pp. 108-111 (2010).
8. Kaviani, M. Microclimatology, 1st Edn., Samt Publi-cations, Tehran, Iran (2001).
9. Li, C.B. and Xiao-Yan, L. \Coastline changes of the yellow river estuary and its response to the sediment and runo (1976-2005)", Geomorphology, 127(2), pp. 31-40 (2011).
10. Cooke, R.U. and Doornkamp, J.C. \Coastal-marine", In Geomorphology in Environmental Management: A New Introduction, 1st Edn., Clarendon Press, Oxford, UK (1990).
11. Hooke, J.M., Geomorphology in Environmental Plan-ning, 1st Edn., John Wiley and Sons, New York, USA (1988).
12. Naeimi Nezamabadi, A., Servati, M. and Ghahroudi Tali, M. \Monitoring shoreline changes and geomor-phological landforms of Persian Gulf using RS and GIS", Journal of Geographic Space, 30, pp. 45-61 (2010).
13. Simon, P., Remote Sensing in Geomorphology, Oxford Book Company, New Delhi, India (2010).
14. DeWitt, H. and Weiwen Feng, J.R. \Semi-automated construction of the Louisiana coastline digital land-water boundary using Landsat TM imagery", Louisiana's Oil Spill Research and Development Pro-gram, Louisiana State University (2002).
15. Moore, L.J. \Shoreline mapping techniques", Journal of Coastal Research, 16(1), pp. 111-124 (2000).
16. Alesheikh, A., Alimohammadi, A. and GhorbanAli, A. \Monitoring lake Urmia shoreline using remote sensing", Geographical Sciences Magazine, 5, pp. 9-25 (2004).
17. Ghezelsoa, M. and Alaipanah, S.K. \Application of visual interpretation of satellite data in detection
S. Zeinali et al./Scientia Iranica, Transactions A: Civil Engineering 24 (2017) 1802{1809 1809
of shoreline changes", Symposium of Geomatics, 89, Tehran, Iran (2010).
18. Shayan, S., Yamani, M. and Khalili, Y. \Detecting of changing the northern coastline using RS and GIS techniques (Case study: Gorgan Bay)", 1st Interna-tional Conference on Environmental Crisis and Its Solutions, Ahvaz, Iran, pp. 3473-3481 (2012).
19. Ahmadi, M. and Narangifard, M. \Monitoring water level changes of Lake Maharlou using satellite data", 32nd National and the 1st International Geosciences Congress, Tehran, Iran (2013).
20. Yamani, M., Rahimi, S. and Goodarzimehr, S. \Peri-odic changes of the east strait of Hormoz Shoreline by remote sensing", Environmental Erosion Researches, University of Hormozgan, Bandar-e-Abbas, Iran, 4, pp. 5-22 (2013).
21. Qudah, O. and Harahsheh, H., Recession of Dead Sea Through the Satellite Images, Royal Jordanian Geographic Center, Amman, Yemen (1994).
22. White, K. and Asmar, H.M. \Monitoring changing position of coastline using thematic mapper imagery: an example from Nile Delta", Geomorphology, 29, pp. 93-105 (1999).
23. Makota, V., Sallema, R. and Mahika, C. \Monitoring shoreline changes using remote sensing and GIS: a case study of Kunduchi area", Western Indian Ocean Journal of Marine Science, 3(1), pp. 1-10 (2004).
24. Chalabi, A., Mohd-Lokman, H., Mohd-Suan, I., Karamali, M., Karthigeyan, V. and Masita, M. \Mon-itoring shoreline change using IKONOS image and aerial photographs: a case study of Kuala Terengganu area", Malaysia ISPRS Commission VII Mid-term Symposium, Enschede, Netherlands, pp. 8-11 (2006).
25. Rahnavard, M. \2D model of sediment transport in coastal zones using mike21: case study of Chabahar bay", M.Sc. Thesis, Shiraz: Shiraz University, Shiraz, Iran (2011).
26. Kamalian, R. and Safari, H. \Eect of Caspian Sea wa-ter level changes on Nowshahr Harbor sedimentation", 10th International Conferences on Coasts, Ports and Marine Structures (ICOPMAS2012), Tehran, Iran, pp. 210-217 (2012).
27. Koshravan, H. and Banihashemi, S.M. \Caspian rapid sea level changing impact on rivers mouth morphodynamic", 10th International Conferences on Coasts, Ports and Marine Structures (ICOP-MAS2012), Tehran, Iran, pp. 170-176 (2012).
28. Zeinali, S. \Simulation of coastal morphological evolu-tion: A case study of Chabahar bay", M.Sc. Thesis, Shiraz: Shiraz University, Shiraz, Iran (2013).
29. Mazer, A.S., Martin, M., Lee, M. and Solomon, J.E. \Image processing software for imagery spectrometry analysis", Remote Sensing of the Environment, 24(1), pp. 201-210 (1988).
30. Richards, J.A. \Feature reduction", In Remote Sensing Digital Image Analysis: An Introduction, 1 Edn., pp. 239-258, Springer-Verlag, Berlin, Germany (1999).
31. http://www.solver.com/xlminer/help/neural-networks-classication-intro
Biographies
Saeed Zeinali received his BSc degree in Civil En-gineering from Amirkabir University of Technology, Tehran, Iran, in 2010, and his MSc degree in Civil Engineering, in Hydraulic Structures, from Shiraz Uni-versity, Shiraz, Iran, in 2013. His master Thesis was on coastal morphological evolution modeling. Currently, he is a PhD student in Shiraz University.
Maryam Dehghani received her BS degree in Geodesy and Geomatics Engineering from Iran Univer-sity of Science and Technology, and her MSc and PhD degrees in Remote Sensing from K.N. Toosi University of Technology in Tehran, Iran, in 2004 and 2009, respectively. During her PhD studies, she received scholarships to carry out research at the University of Oxford and the University of Delft. From 2002 to 2008, she was working in the Remote Sensing group of the Geological Survey of Iran (GSI). She is currently an Assistant Professor at the Department of Civil and Environmental Engineering, School of Engineering, Shiraz University, Shiraz, Iran. Her main research interests are synthetic aperture radar interferometry (InSAR) and digital image processing.
Mohamad Amin Rastegar obtained his BSc degree from Hormozgan University in 2012, and his MSc degree in Civil Engineering focused on Environmental Engineering, in 2015. His thesis's major focus is on removing pollutants from wastewater and introducing new methods for wastewater treatment.
Morteza Mojarrad received his BS degree in 2010 from Persian Gulf University, Bandar Bushehr, Iran and his MSc degree in Environmental Engineering, from Shiraz University, Shiraz, Iran. His MSc thesis focused on studying the characteristics of well head protection area in inuence zone of an aquifer. He simulated a case study of Zarghan Basin. He started his PhD in KTH University in Sweden in 2015.