AMT-5 cruise report
115
0
0
Full text
(2) AMT-5 Cruise Report. Preface. prepared by Dr. Jim Aiken, Chief Scientist of PML’s AMT programme is an outstanding expresT hissionreport, of the technical and scientific achievements made in the course of the AMT-5 cruise, 14 September–17 October 1997, which has contributed strategic bio-optical and sea-truthing information to SeaWiFS. AMT has also provided a cost-effective basin scale platform of opportunity to develop wide-ranging initiatives on biogeochemical provinces, biogas production and exchange, plankton and pigment biogeography, and broad nutrient geochemistry for the upper layers of the North and South Atlantic Ocean. AMT will remain a springboard for data gathering and, increasingly, for process oriented research in CCMS’ new core strategic programmes due to start in 1999. I would like to congratulate Dr. Jim Aiken, associated colleagues, and all the collaborators from NASA, JRC, Italy, SOC and UK universities (UEA, Plymouth), who have contributed through their participation in AMT-5. I look forward to the seminal papers describing the exciting discoveries and achievements in the AMT programme. Plymouth, United Kingdom August 1998. — R.F.C. Mantoura Director, PML. program is a joint experiment with the British and is an unique opportunity to periodically samT hepleAMT the variety of oceanic bio-optical and atmospheric aerosol provinces of the North and South Atlantic -. Oceans. In fact, the transect traverses nearly 110◦ of latitude. The first cruise, AMT 1 (Robins et al. 1996), was documented in the SeaWiFS Technical Report Series (Prelaunch). To participate in these 5–6 week deployments requires a major effort for all those involved, especially those who deploy from foreign locations, as the SeaWiFS Project staff can testify. Despite the difficulties associated with frequent and prolonged travel, shipping, communications, and extended work at sea, AMT is providing a wealth of new data of exceptional quality for validation and algorithm development. Also, AMT is proving to be an invaluable test bed for refining measurement techniques and equipment designs. I want to thank our British colleagues, particularly the British Antarctic Survey and the Plymouth Marine Laboratory, for inviting the SeaWiFS Project to participate in the program. Greenbelt, Maryland August 1998. — C.R. McClain SeaWiFS Project Manager. ii.
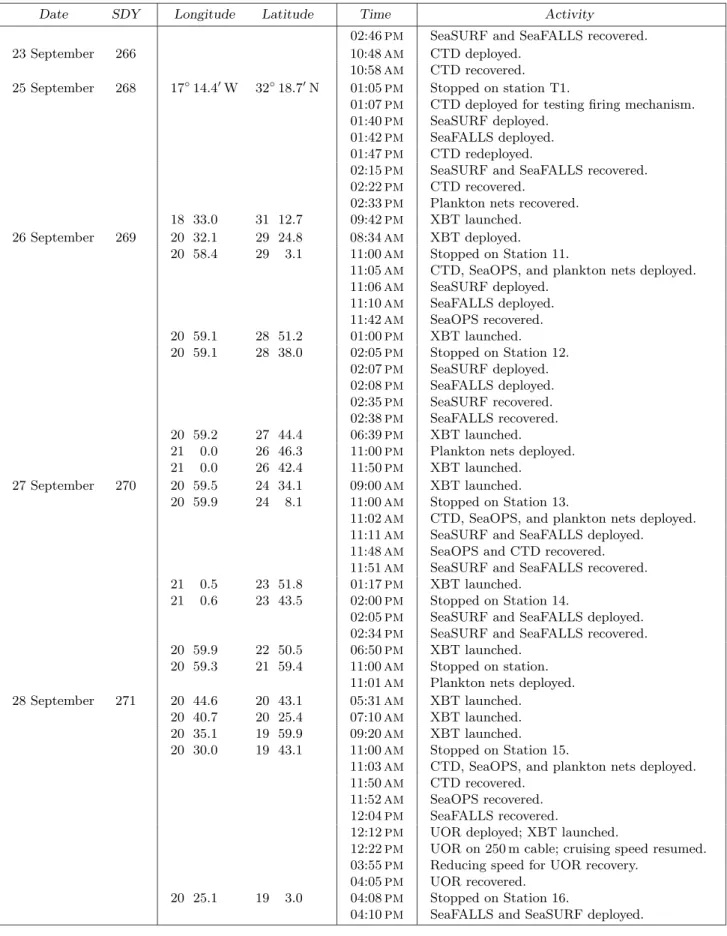
(3) Aiken et al.. Abstract This report documents the scientific activities on board the Royal Research Ship (RRS) James Clark Ross (JCR) during the fifth Atlantic Meridional Transect (AMT-5), 14 September to 17 October 1997. There are three objectives of the AMT Program. The first is to derive an improved understanding of the links between biogeochemical processes, biogenic gas exchange, air–sea interactions, and the effects on, and responses of, oceanic ecosystems to climate change. The second is to investigate the functional roles of biological particles and processes that influence ocean color in ecosystem dynamics. The Program relates directly to algorithm development and the validation of remotely-sensed observations of ocean color. Because the Sea-viewing Wide Field-of-view Sensor (SeaWiFS) instrument achieved operational status during the cruise (on 18 September), AMT-5 was designated the SeaWiFS Atlantic Characterization Experiment (SeaACE) and was the only major research cruise involved in the validation of SeaWiFS data during the first 100 days of operations. This third objective involved the near-real time reporting of in situ light and pigment observations to the SeaWiFS Project, so the performance of the satellite sensor could be determined.. 1. INTRODUCTION The Atlantic Meridional Transect (AMT) Program exploits the passage of the Royal Research Ship (RRS) James Clark Ross (JCR) latitudinally through the Atlantic Ocean between the United Kingdom (UK) and the Falkland Islands (approximately 52◦ N to 52◦ S) in support of British Antarctic Survey (BAS) research activities in the Antarctic and its environs.† In September, the JCR sails southward, sampling the boreal fall and the austral spring; the following April it returns to the UK, sampling the austral fall and the boreal spring. The cruise track crosses a range of ecosystems and biophysical regimes, within which conditions vary from subpolar to tropical, and from eutrophic shelf seas and upwelling systems to oligotrophic mid-ocean gyres. The JCR is an ideal platform for measuring physical, biological, and bio-optical properties and processes through these diverse ecosystems of the North and South Atlantic Oceans. The AMT Program goals are to: 1. Test and refine hypotheses on the responses of oceanic ecosystems and the coupled marine atmosphere to anthropogenically-forced environmental change; 2. Develop a holistic research strategy, integrating in situ measurements, remote sensing, and modeling; 3. Provide calibration and validation of new satellite sensors of ocean color, sea surface temperature and height, and solar radiation; 4. Improve the knowledge of marine biogeochemical processes, ecosystem dynamics, food-webs and fisheries, and characterize biogeochemical provinces; 5. Develop coupled physical–biological models of production and ecosystem dynamics; and † This publication constitutes an official Plymouth Marine Laboratory (PML) cruise report, and its contents have been approved by the Director, R.F.C. Mantoura.. 6. Quantify oceanic responses to changes in abundance of radiatively- and chemically-active trace gases. It has been an inherent goal of the AMT Program to examine the hypothesis of biogeochemical provinces and determine their characteristic properties. Traditionally, oceanographers have partitioned the oceans on the basis of physical and biological characteristics: for the former, topography, geostrophic flows, wind driven circulation, gyres, fronts, upwelling zones and patterns of seasonal stratification; for the latter, biological productivity, as well as phytoplankton and zooplankton assemblages and community structure. Taken together, this biophysical partitioning provides the descriptors of regional ecosystems or biogeochemical provinces, each with discrete boundaries and each having distinct flora and fauna. The concept of biogeochemical provinces has been promoted particularly as a means of evaluating patterns of basin-scale productivity from remotely-sensed measurements of ocean color, making use of province-specific physical and biological parameterizations (climatological values of the key variables). There have been four prior AMT cruises: AMT-1 Sep.– Oct. 1995; AMT-2 Apr.–May 1996; AMT-3 Sep.–Oct. 1996, and AMT-4 Apr.–May 1997. AMT-5, coinciding with the start of the operational phase of the Sea-viewing Wide Field-of-view Sensor (SeaWiFS) instrument (18 September 1997), started in Grimsby (UK) on 14 September 1997 and ended in Stanley (Falkland Islands) on 17 October 1997. In between, there was a fueling stop in Portsmouth (15–16 September) and a ship’s trials period off Madeira (23–25 September). AMT-5 was designated the SeaWiFS Atlantic Characterization Experiment (SeaACE) as the only major research cruise involved in the calibration and validation of SeaWiFS data during the first 100 days of operations. The specific objectives of SeaACE were to: 1. Derive and report downwelling irradiance, (Ed ), upwelled radiance (Lu ), and the diffuse attenuation. 1.
(4) AMT-5 Cruise Report coefficient, (Kd ), at the SeaWiFS instrument wavelengths;. 3. SeaWiFS Free-Falling Advanced Light Level Sensors (SeaFALLS) casts from the stern for the measurement of Ed (z, λ), Lu (z, λ), CT, plus F ; and. 2. Report measured phytoplankton pigments, by high 4. Repeated zooplankton net deployments from the performance liquid chromatography (HPLC) and forward crane. fluorometry, in particular, chlorophyll a and phaeopigments (where measured) for validating the Sea- The SBE CTD, SeaOPS, and SeaFALLS (along with their WiFS level -2 product; and solar irradiance reference sensors) were provided by the 3. Compare measured and retrieved values of pigments SeaWiFS Project; the former was a new instrument; the and the diffuse attenuation coefficient at 490 nm, latter two had been deployed on previous AMT cruises, but SeaOPS was equipped with more sensors than had K(490), for validation of the algorithms. been used in the past. In addition to providing validation data for SeaWiFS (McThe high quality of the ship’s crew (Appendix A) alClain et al. 1998), the AMT-5 cruise contributed to valilowed for the safe deployment of all four main instrument dation activities of the Topography Experiment (TOPEX) systems simultaneously; this was the primary reason why satellite and the Radiometric Observations of the Sea surstation time could be kept to the shortest time possible face and Atmosphere (ROSSA) project. without negatively impacting data collection opportunities. For AMT-5, the CTD and SeaOPS were deployed si1.1 Cruise Strategy multaneously and at similar descent rates, approximately −1 The inital strategy for AMT-1 and AMT-2, involved 0.25 m s . At the maximum depth for the optics cast, having only two extra passage days for scientific activities, usually the 1% light level, the CTD system was profiled and was based on one sampling station per day. Each sta- at a safe speed to the maximum depth of 250–600 m. The tion lasted less than one hour, and was complimented by two instrument systems were not synchronized for the up surface underway measurements using water from the non- casts. The zooplankton nets and SeaFALLS were profiled toxic supply, and was supplemented by one or two Undu- independently, but the latter was deployed simultaneously lating Oceanographic Recorder (UOR) tows into and out of with the SeaOPS down and up casts. Since the SBE CTD (equipped with 12×30 l water botthe station. By AMT-3, additional ship time had been intles) gave sufficient water that only one 45 min cast was creased to six days, so two daily stations were possible: the needed per station, contingency time for other activities primary (late morning) station provided water for producwas available. Extra casts were needed on three occasions tivity and other biological sampling along with a complete when bottles failed to close correctly at the deep chloroset of optical measurements; the secondary (early afterphyll maximum (DCM) and on the last three days when noon) station was restricted to optical instruments that the rich spring bloom waters of the Sub-Antarctic Convercould be deployed rapidly (free-fall profilers that could be gence Zone (SACZ) were sampled simultaneously with the deployed by hand). At the outset, the strategy for AMT-5 afternoon optical casts. The second station in the afterwas to plan for two optical stations per day, subject to noon was always timed to exploit the most favorable sky other constraints. conditions. In general, this worked well, and many of the The primary station commenced at approximately 1100 afternoon stations were in excellent cloud-free conditions; (ship’s time) to coincide with the SeaWiFS overpass. The on only a few occasions were conditions so unfavorable that principal objective was to acquire optical measurements at the afternoon station was cancelled. the SeaWiFS wavelengths and concurrent data on phytoWhen conditions were at their most favorable during plankton pigments and species, zooplankton, hydrographic the morning or afternoon station, full advantage was taken, properties, and water for primary productivity, biogases, and up to two hours were spent on optical casts, which reand nutrients. The main instruments deployed were as sulted in some of the best optical measurements of any follows: AMT cruise. In the southern-most end of the Brazil Cur1. Sea-Bird Electronics (SBE) 911plus CTD (conduc- rent, but still north of the confluence with the Falkland tivity, temperature, and depth) sensor deployments Current, the waters were consistently low in chlorophyll, from the dedicated midships gantry, with fluorome- so no afternoon stations were scheduled to save time for the ter, transmissometer, and photosynthetically avail- more interesting waters farther south. A total of 49 staable radiation (PAR) instruments, plus a 12×30 l tions was executed (46 full stations, 1 test station, and 2 bottle water sampler for phytoplankton pigments, trial deployments) during which data were acquired from productivity, etc., from 12 depths to 250–600 m; 32 CTD casts (31 SeaWiFS and 1 BAS to 2,000 m), 64 2. SeaWiFS Optical Profiling System (SeaOPS) casts SeaOPS casts, 152 SeaFALLS casts, and 52 Low-Cost from the (stern) starboard crane for the measure- NASA Environmental Sampling System (LoCNESS, anment of Ed (z, λ), Lu (z, λ), CT, plus chlorophyll fluo- other optical free-fall profiler) casts. This inventory of measurements, summarized in Table 1, made AMT-5 the rescence (F );. 2.
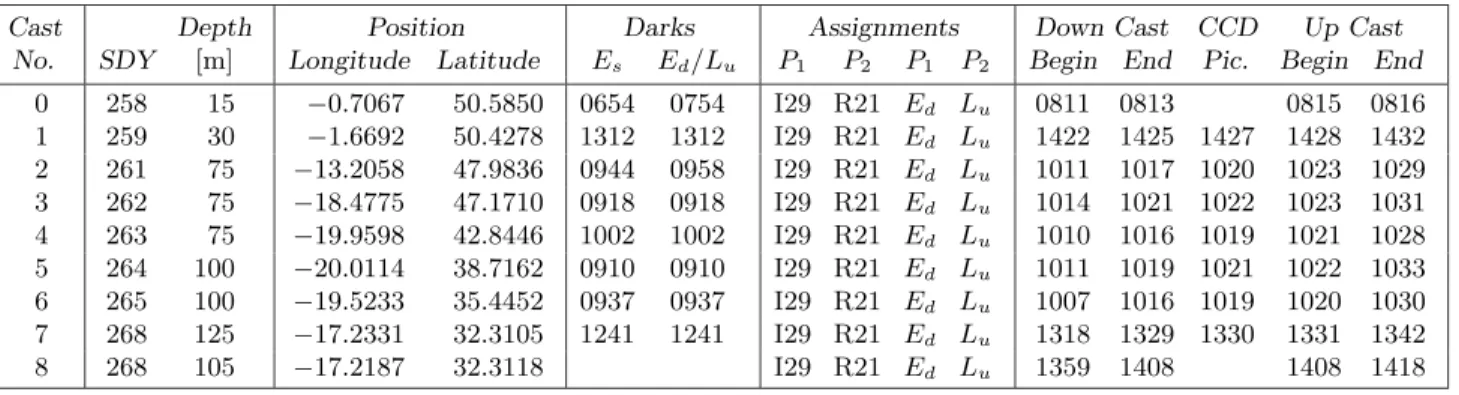
(5) Aiken et al.. Table 1. A summary of the station work executed during AMT-5. The HPLC column gives the surface chlorophyll a pigment concentration (mg m−3 ). The time entries are in Greenwich Mean Time (GMT). Date 15 16 17 18 19 20. Sep. Sep. Sep. Sep. Sep. Sep.. 21 Sep. 22 Sep.. 25 Sep. 26 Sep. 27 Sep. 28 Sep. 29 Sep. 30 Sep. 1 Oct. 2 Oct. 3 Oct. 4 Oct. 5 Oct. 6 Oct. 7 Oct. 8 Oct. 9 10 11 12. Oct. Oct. Oct. Oct.. 13 Oct. 14 Oct. 15 Oct. 16 Oct. 17 Oct.. SDY 258 259 260 261 262 263 263 264 265 265 265 268 269 269 270 270 271 271 272 273 273 274 275 275 276 276 277 277 278 278 279 280 280 281 281 282 283 284 285 285 286 286 287 287 288 288 289 289 290. Sta. Time 0 1 2 3 4 5 6 7 8 9 10 T1 11 12 13 14 15 16 T2 17 18 19 20 21 22 23 24 25 26 27 28 29 30 31 32 33 34 35 36 37 38 39 40 41 42 43 44 45 46. 0730 1422 1605 1008 1013 1010 1430 1010 0644 0907 1430 1347 1103 1400 1106 1400 1103 1600 1106 1104 1600 1102 1106 1640 1039 1610 1140 1600 1137 1700 1135 1135 1500 1145 1635 1145 1135 1200 1243 1755 1200 1600 1240 1640 1214 1709 1243 1615 1120. Longitude Latitude −0.717 −1.652 −8.457 −13.205 −18.482 −19.963 −19.962 −20.012 −19.530 −19.523 −19.145 −17.227 −20.968 −20.985 −20.998 −21.010 −20.528 −20.418 −20.010 −20.870 −21.177 −22.472 −24.163 −24.463 −25.663 −25.897 −27.368 −27.598 −29.115 −29.382 −30.705 −32.363 −32.547 −34.225 −34.557 −37.285 −40.977 −44.867 −48.860 −49.450 −51.923 −52.147 −54.455 −54.877 −56.700 −56.753 −57.660 −58.235 −57.703. 50.617 50.460 48.670 47.983 47.173 42.842 42.433 38.717 35.448 35.445 35.043 32.310 29.047 28.633 24.135 23.725 19.720 19.050 15.492 10.922 10.212 7.027 2.817 2.077 −0.778 −1.358 −4.787 −5.308 −8.967 −9.613 −12.877 −16.685 −17.147 −20.662 −21.082 −23.903 −27.690 −31.620 −35.477 −36.090 −38.835 −39.198 −42.238 −42.822 −46.045 −46.540 −49.795 −49.797 −51.665. CTD 1 2 3 4 5. SeaOPS SeaFALLS LoCNESS 0 1. 5. 8 9. 7– 8 9. 10. 10–11. 11. 12–13. 12. 14 15. 13 14. 0.790 0.336 0.341 0.285 0.140 0.121 0.111 0.085 0.071 0.065 0.063 0.073 0.055 0.161. 2 3 4. 6 BAS 7. 6. 15. 16–17 18–21 22 23–24. 16. 25–27. 17. 28. 18 19 20. 29–33 34 35 36–40. 21 22 23 24. 41 42 43 44. 25. 45. 26 27 28 29 30 31. 46–50 51–53 54–56 57–58 59–61 62–64. 1–3 4–7 8–9 10–11 12–14 15–20 21–23 24–28 29–31 32–37 38–39 40–41 42–43 44–45 46–48 49 50–53 54–59 60–62 63–72 73–76 77–79 80–81 82–85. 0.631 0.838. 86–89 90–100 101–102. 103–107 107–111 112–119 120–122 123–130 131–132 133–144 145 146–149 150–152. HPLC. 0 1–5 6–9 10–14 15–18 19–26 27–28 29–40 41 42–45 46–52. 0.230 0.228 0.141 0.164 0.095 0.116 0.081 0.137 0.079 0.057 0.058 0.066 0.048 0.053 0.056 0.061 0.103 0.300 0.209 0.354 0.243 1.400 1.023 0.814 1.212 0.857 0.663 0.937 0.556 0.539. 3.
(6) AMT-5 Cruise Report most productive for bio-optical data so far in the AMT After loading aviation fuel for the BAS Antarctic bases Program. on Monday afternoon and Tuesday morning, giving time for urgent repairs and modifications, the JCR departed Portsmouth at 1100 GMT 16 September; seawater systems 2. CRUISE TRACK and sensors were turned on at 1330 GMT and underway The AMT-5 cruise started in Grimsby on 14 Septem- sampling commenced (every 2 hours) for pigments, nutriber 1997 and had a refueling stop in Portsmouth on 15– ents, zooplankton, etc. Station 1 was conducted as planned 16 September. After Portsmouth, the vessel followed the at 1400 GMT southwest of the Isle of Wight in 40 m water. usual AMT cruise track westward to 20◦ W,47◦ N, with a The following instruments were deployed: short diversion on 17 September to answer and assist in a 1. SeaOPS using the 10 t crane (a completely successman-overboard distress call. After 20◦ W,47◦ N, the vessel ful operation); followed a southerly course until the enforced suspension 2. SBE CTD with one bottle at 2, 5, 10, 15, and 20 m, of scientific research for a ship’s trials period off Madeira and six bottles at 25 m (a successful CTD profile from 23–25 September. When the the research program resulted, but all of the water bottles leaked); resumed, the vessel continued the southerly course along the 20◦ W meridian, through the edge of the West African 3. Bongo zooplankton nets from the forward crane (the upwelling to 13◦ N, after which, the vessel altered course samples were collected successfully); and to the south–southwest for a way point approximately 200 4. The UOR, fitted with a fast repetition rate fluonautical miles east of Montevideo, Uraguay. From this rometer (FRRF), was launched and towed at 4 kts point, the course was almost due south to the Falkland Isfor 10 min to test the sensors and logging systems lands. The JCR arrived in Stanley during the morning of (which was only partially successful, because the 17 October and the expedition was terminated. A plot of FRRF did not activate). the complete ship’s track is shown in Fig. 1 and a summary The optical data were analyzed, quality assured, and reof the Scientific Bridge Log is given in Appendix B. Plymouth Marine Laboratory (PML) scientists and the ported to the SeaWiFS Project as another test calibration other members of the scientific party, including colleagues data set. Water from all depths was filtered for phytofrom the United States, Canada, Spain, Italy, and Switzer- plankton pigments, notably three depths within the first land, travelled to Grimsby on, or by, Wednesday 10 Sep- optical depth (2, 5, and 10 m). With repairs to the water bottles completed (the tentember. The scientific equipment from various scientific sion for the power chord closing mechanisms was set ininstitutes was unloaded Thursday morning and by the end correctly by the manufacturer), the scientific party was of the first day, most had been installed and the decks geared up for a complete station Wednesday morning. Unwere quite clear. This unexpectedly good situation, was fortunately, a man-overboard distress call from a Russian undoubtedly a result of the efforts of the many old hands sailing ship deflected the JCR from station sampling to a on board and the practice established from four previsearch and rescue mission. The JCR arrived at the site ous AMT cruises. With minor exceptions, most instruin just over 3 h (average speed 16 kts) and searched for ment systems were operational by Friday. The final scienover 3 h with the scientific party acting as lookouts. With tific preparations were completed prior to departure from the rescue effort called off by 1600 GMT, there was time Grimsby at 0400 GMT Sunday morning (14 September). The nontoxic water supply was turned on and the un- to deploy the repaired CTD (Station 2) for water samples derway sampling commenced at 0700 GMT on 14 Septem- to 100 m, SeaFALLS to check trim and descent rate, and ber, sequential day of the year (SDY) 257. There was two zooplankton nets; all were completed successfully. No no station sampling on Sunday, but with good progress optical data were reported to the SeaWiFS Project, but through the southern North Sea, the Straits of Dover, water samples were analyzed for phytoplankton pigments. A deterioration in the weather, force 6 with large swell, and the eastern English Channel, there was sufficient time to conduct a shake-down or test station (designated Sta- was the problem to contend with for Station 3 (1100 GMT) tion 0) just east of Portsmouth at 0730 GMT on Monday on Thursday 18 September (SDY 261), but the deployment morning. Station 0 produced almost zero data, because of the CTD, SeaOPS, and zooplankton nets went ahead the starboard crane for the SeaOPS rig spurted hydraulic without any major problems; SeaFALLS was not deployed oil over the deck and the CTD termination electrically because of the rough seas and poor illumination conditions. shorted. Eventually, there was a successful SeaOPS pro- The new CTD worked well with only minor water leakage, file, using the 10 t midships crane, but the CTD, although although, two separate endcaps sheared off during normal repaired, remained untested. On a positive note, it was usage. The UOR with the FRRF was deployed at the end valuable to trap these faults early, with ample time to of the station and was towed for about 2 h to test the sysmake repairs. Optical data from Station 0, were analyzed, tem. The FRRF data looked good, but there was some quality assured, and reported to the SeaWiFS Project as doubt about the data from the CT sensors. The first Seaa calibration data set (to test the agreed upon reporting WiFS image was received from the PML Remote Sensing formats and procedures). Group (RSG) for 16 September. The image showed a good. 4.
(7) Aiken et al.. Fig. 1. The AMT-5 cruise track.. 5.
(8) AMT-5 Cruise Report view of the English Channel, including the area around the Isle of Wight, the location of the station for that day. The poor weather continued through Station 4, 1000 GMT Friday 19 September, which made the execution of the main station difficult, but everything went ahead without major mishap. Two water bottles failed to fire at the depths triggered, although, subsequent investigation showed no cause for the failure. The CTD cast was to a depth of 250 m and lasted 45 min. SeaFALLS was not deployed due to the rough conditions, and the SeaOPS cast lasted only 35 min. The net casts for zooplankton became the longest activity on station which lasted about 1 h. The UOR was towed away from the station for 3 h and FRRF data were recorded. At the end of the tow, SeaFALLS was deployed to test and modify the trim and monitor the descent speed. Optics data for the first three casts, along with pigment data for the first three stations, were reported to the SeaWiFS Project, clearing the backlogs from the first few days and indicating that the data processing of optical data was fully operational. On board quality assurance of measured versus retrieved Kd (λ) data were in good agreement, confirming the veracity of both Kd and Lu data to a certain extent. Station 5 (Saturday 20 September) was the first station in fair seas and light winds, although clouds obscured the sun. Only SeaOPS was deployed during the morning optical station. Problems persisted with the CTD water sampler and four bottles did not fire at their triggered depths. On redeployment, the same four bottles malfunctioned; the suspicion was that excessive tension was to blame (although the tension was measured and found to be within specification) and a new arrangement for the bottle lanyards was prepared as a solution. The UOR was towed out of the station and recovered at 1400 GMT before the afternoon station; good FRRF data were acquired for the third day. Station 6 was restricted to the deployment of SeaFALLS and was the first station in sunshine (with some high cirrus). Continuing south along the 20◦ W line, Station 7 (20 September) proceeded as planned with the set routines of CTD, SeaOPS, nets, and SeaFALLS at 1100 GMT. An increasing number of bottle misfires meant that the CTD had to be redeployed to get water from the key depths missed around the chlorophyll maximum; fortunately, with plenty of time in hand for the leg to Madeira, there were no constraints on having a second CTD cast. The UOR was towed away from the morning station and recovered just before the afternoon SeaFALLS station (Station 8). Entering the Canary Islands, Azores, Gibraltar Observations (CANIGO) region, the first nighttime nets were taken at 2100 GMT. The final station before Madeira (Station 9) was at the CANIGO target position of 36◦ N. The BAS CTD was deployed to 2,000 m (some of the sensors on the SBE CTD had a depth limitation of 600 m); throughout the 2-hour deployment, multiple net hauls were executed. The SBE. 6. CTD and SeaOPS casts went ahead at 1000 GMT which were immediately followed by SeaFALLS deployments. Regrettably, one CTD bottle at the DCM did not fire, necessitating a second CTD cast. There was a second series of rapid SeaFALLS casts later on (Station 10). Since the exclusive economic zone (EEZ) off Madeira was nearby, there was no UOR tow after the station; the ship made full speed for the rendezvous and the dynamic positioning trials. Two days were spent in the vicinity of Madeira, during which time, any data backlog was processed, and further tests were made on the CTD (some under guidance from SBE by fax). A new sampling strategy was established, whereby of the top six bottles (numbers 7–12 which were nearly always reliable), two would be fired at the DCM and four would be spread through the surface layer; the bottom six, with the two most unreliable bottles (numbers 2 and 6), would be fired below these in the thermocline (the other two unreliable bottles, numbers 3 and 5, were in this bottom six). If the top six bottles fired reliably, a second CTD cast would not be needed. Unfortunately, the bottle spares ordered from the manufacturer when the endcaps sheared off did not reach Madeira before the JCR left Madeira. Departure from Madeira was delayed to mid-day on Thursday 27 September (SDY 270), 18 hours later than planned, so no regular station work was permitted. Some time was taken for equipment tests, however: the CTD was fired at the surface and at depth to confirm the unreliable bottle numbers. In addition, SeaOPS and SeaFALLS were tested for trim modifications. Friday 28 September (Station 11) established the pattern for the next few days, with the routine of previous AMT cruises getting set. With the clocks advanced by 2 h, stations started at 1000 ship’s time (1100 GMT) with a deep CTD to 600 m (still in the CANIGO region), a SeaOPS cast to 100 m, several SeaFALLS deployments to 150 m, and net casts to 200 m. With only one CTD cast (10 bottles fired reliably), the station was completed in about 1 h. At 1300 ship’s time, there was a second SeaFALLS station in good sky conditions, giving the best optics data of the cruise so far. Still in the CANIGO region, there was a night zooplankton net cast at 2200. An almost identical pattern was followed for Stations 13 (1100 GMT) and 14 (1600 GMT) on 27 September, and Stations 15 (1100 GMT) and 16 (1600 GMT) on 28 September, with excellent optical data being collected during clear sky conditions. All other activities went as planned, with CTD deployments to 600 m being the new set pattern. On Monday 29 September, the ship was in the EEZs between the Cape Verde Islands and Senegal, so no station was executed (no CTD); there were some test deployments of the SeaFALLS profiler which was exhibiting some problems with the auxiliary CT sensors. Another excellent day of clear sky conditions followed on 30 September (Station 17 at 1100 GMT and Station 18 at 1600 GMT) with a matching CTD cast..
(9) Aiken et al. Approaching the equator, the weather turned cloudy and overcast with occasional rain squalls, making the optical work difficult at times and less relevant to SeaWiFS validation objectives. Nevertheless, some acceptable casts were accomplished in between the clouds on 1 October (Station 19) and the complete overcast stations were used to intercompare radiometers (Stations 20 and 21 on 2 October). Over these 2 days, the CTD and water sampler worked perfectly (all 12 bottles fired), and the measurement of the pigments and accessory parameters proceeded unhindered. South of the equator, blue skies with a few fluffy clouds predominated; the conditions were excellent for SeaWiFS validation. Stations 22 and 23 on 3 October (SDY 276), interrupted only by the crossing the line ceremony, and Stations 24 and 25 on 4 October provided excellent conditions and lots of casts: at the main morning station (Station 24), there were 3 SeaOPS casts and 10 SeaFALLS casts, which were followed by 3 SeaFALLS casts during the afternoon (Station 25). The large number of casts will allow for an investigation into the broader issues of intra- and inter-pixel variability of optical properties over distances of 1–2 km. The following two days were hampered by more than the average amount of cloud cover. Two stations were completed on 5 October (Stations 26 and 27), but only one on 6 October (Station 28), with good illumination conditions for at least part of each station. Standard CTD casts to 600 m were completed satisfactorily on each day, with all 12 water bottles firing and closing reliably. Conditions were overcast for the morning station on 7 October (Station 29), so there was only one SeaOPS cast coincident with the CTD and zooplankton net casts; in the poor illumination conditions, SeaFALLS was not deployed. The UOR was towed from the station and recovered at 1500 GMT prior to the next station. In contrast, the afternoon station (Station 30) was completely cloud free, so there was a second SeaOPS cast to 150 m and four SeaFALLS casts to 200 m; all were rated as probably the best of the cruise to date. Even better sky conditions were encountered during Station 31 (1130 GMT) on the morning of 8 October (SDY 281), which was completely cloud-free. During this station, 5 SeaOPS casts and 11 SeaFALLS casts were executed; the resulting data set was probably the best optical data ever collected on an AMT cruise. The extra time for optics casts gave ample time for numerous zooplankton net casts and the CTD to be deployed to 600 m. Once again the UOR with FRRF was towed away from the station until midafternoon and produced good data. Cloudy conditions dominated the afternoon casts of SeaFALLS (Station 32), but useful data were acquired. SeaWiFS images transmitted to the ship showed the spring bloom was well advanced on the Patagonian Shelf. To make good speed as the JCR proceeded south in the Brazil Current towards the productive zones of the Patagonian Shelf, stations were restricted to only one in the morning with a duration of less than 1 hour. Cloudy conditions. hampered the SeaOPS casts (Station 33 on 9 October and Station 34 on 10 October), but the CTD and net casts were completed with no problems on both days. During Station 35 on 11 October (SDY 284), the CTD wire jammed (off a sheaf) when the CTD was at about 180 m. Unfortunately, the CTD cast had to be aborted and no water samples were obtained. The problem was rectified fairly quickly (100 min), but 200 m of cable had to be discarded and the CTD cable reterminated. Meanwhile, the other activities (SeaOPS and net casts) proceeded uninterrupted. Station 36 on 12 October proceeded smoothly with the CTD, zooplankton nets, SeaOPS, SeaFALLS, and LocNESS all deployed. With the ship back at regular speed, the UOR with FRRF was towed from the morning station to the early afternoon station. A SeaFALLS and LocNESS intercomparison was the feature of the afternoon station (Station 37), which was unfortunately dominated by cloud cover; for both of these stations, there was a significant rise in chlorophyll concentration to over 0.35 mg m−3 as the confluence was approached. Late night zooplankton net casts were also executed. Station 38 on 13 October (SDY 286) was the first in the high chlorophyll waters of the confluence, where the chlorophyll concentration reached 1.4 mg m−3 at the surface for the morning station. The heterogeneity of the region was illustrated by the variation in structure of temperature and chlorophyll derived from successive, closely-spaced vertical profiles with SeaFALLS and LoCNESS—five profiles in a row, within 40 min of one another, were all significantly different, some by a large amount. It was the same for the afternoon station (Station 39) when, like the morning, cloud-free skies provided excellent conditions for optical measurements. The UOR was towed again between stations, giving another series of data with the FRRF in waters of high activity for photosynthesis and primary productivity in the spring bloom. The following day (October 14) proved to be more of the same, with high chlorophyll concentrations and very dynamic physical conditions. The rapid deployment of expendable bathythermograph (XBT) probes through the confluence tracked 6 eddies clustered around a warm core ring, validating the structure in TOPEX imagery for the previous few days (which had been relayed to the vessel from a laboratory on shore). The highly complex vertical structures were reproduced in the phytoplankton taxa and pigment assays. Mostly cloud-free skies gave a large number of good optical profiles with SeaOPS, SeaFALLS, and LocNESS for both the morning and afternoon stations (Stations 40 and 41, respectively). The CTD was deployed to a depth of 600 m for both stations. For the third day in a row (15 October), the stations were in high chlorophyll water and, for at least part of each period, there was cloud-free, sunny skies providing very good optical conditions and excellent data. Once again,. 7.
(10) AMT-5 Cruise Report the CTD was deployed in the morning (Station 42) and afternoon (Station 43). By Stations 44 and 45, the transect had crossed the Falkland Current, although the water on the continental shelf (300 m) at 5.8◦ C was probably still influenced by it. Chlorophyll concentrations, although lower than recent days, were still moderate at approximately 1 mg m−3 . Good conditions prevailed for the optical casts and some of the best data ever obtained south of Montevideo was collected. The UOR was again towed between morning and afternoon stations and the CTD was deployed at both locations. Even more remarkable, for the final station just off Stanley on 17 October (SDY 290), blue skies allowed for a final cast of SeaOPS at 57.500◦ W,51.667◦ S (the most southerly station executed in the AMT Program) in high chlorophyll water. Unfortunately, the sun was rather low in altitude at 0900 ship’s time, which did not make for the best optical conditions. The CTD was not deployed and the scientific work was terminated after the station.. 3. RESEARCH REPORTS In this section, the individual research reports from the scientific groups participating in the AMT-5 cruise are presented.. 3.1 Physical Oceanography The primary physical oceanographic measurements during AMT-5 were of water properties and velocities; the former were measured by CTD and XBT casts, and the latter by an acoustic doppler current profiler (ADCP).. 3.1.1 Water Properties The CTD measurements were made by profiling a SBE 911plus when the ship was stationary. This usually involved daily stations in the late morning at 1000 or 1100 ship’s time. Also fitted to the CTD, were secondary temperature and conductivity sensors, a WETstar miniature fluorometer (Wet Labs, Inc.), a Cstar transmissometer (Wet Labs, Inc.), and a spherical PAR sensor (Biospherical Instruments, Inc.). With these dual CT sensors, the SBE 911plus instrument is self-checking and nominally selfcalibrating. The average difference between the primary and secondary sensors was seen to be 0.001◦ C in temperature (T ) and 0.005 in salinity (S). Salinity values were compared with 70 salinity bottle samples, taken from the top and deepest water bottles from each CTD cast, showing differences typically of less than 0.002. The CTD package included a rosette water bottle sampling system fitted with 12×30 l polyvinylchloride (PVC) bottles. For most of the cruise, there was one station late morning each day; there were afternoon CTD casts for the last three days (SDY 287–289) in the high chlorophyll regions at the southern end of the transect. The initial CTD. 8. casts were troubled by mechanical (and perhaps electrical) problems, which resulted in a number of bottles failing to close properly. The mechanical shortcomings were overcome by adjusting the tensioning in the bottle closing mechanisms (power chords) and altering the lanyard connections to the release latches. An intermittent electrical problem resulted in 1–4 of the release latches failing to fire on each of the first 10 casts. Extensive testing and communication with the manufacturer failed to isolate the problem; however, after cast 10, all latches fired consistently. From casts 5–7 there was insufficient water sampled at the chlorophyll maximum because the bottles failed to close, so a second cast was required. A summary of the CTD log is presented in Appendix C. For casts 1–8 and cast 31, the CTD was profiled to a depth of 250 m, while for casts 9–30, the CTD was profiled to a depth of 600 m. Data was recorded at 24 Hz via a SBE deck unit onto both a Dell PC and the shipboard computer level-C data logger using BAS Research Vessel Services (RVS) software. Station 23 was aborted at 200 m when the coaxial CTD cable frayed on the winch; no bottles were fired. The CTD was reterminated prior to cast 24. There was one deep CTD cast with a (BAS) Neil Brown Mk IIIB CTD to 2,000 m at 19.5233◦ W,35.4450◦ N, within the CANIGO area. A contour plot of the salinity to 200 m is shown in Fig. 2, the fluorometer to 200 m in Fig. 3, and the water transmission at 660 nm, in Fig. 4. During the cruise, a total of 70 Sippican T–5 XBTs and 66 Sparton T–7 XBTs were deployed (Appendix D). Temperature profiles were obtained down to a depth of 1,830 m for the T–5 probes with the ship slowed to 8 kts, and 760 m for the T–7 probes with no restriction on speed. Typically, the T–7 deployments were at 0700, 1300, 1900, and 2400 ship’s time each day. This strategy was altered for regions of special interest (e.g., frontal crossings), at which time T–5 probes were deployed at 50 km intervals. The regions targeted for analysis were: 38◦ N to 35◦ N, analysis of which showed evidence of the spreading Mediterranean Water centered at a depth of 1,000 m (Fig. 5); 10◦ N to 3◦ S, which resolved the currents in the equatorial zone (Fig. 6 and Section 3.2); and 38◦ S and 45◦ S at the confluence of the Brazil Current and Falkland Current systems (Fig. 7). Occasionally, T–7 XBTs were deployed at the daily station for intercalibration with the CTD. The preliminary analysis of the temperature of the CTD and XBT, shows a consistent structure, but, in general, the XBT values were approximately 0.5◦ C higher than the CTD. Contour plots of the temperature structure (surface to 750 m) for the Northern and Southern Hemispheres are shown in Figs. 8 and 9, respectively. No calibration correction has been applied to the XBT data shown in the contour plots. Near-surface T -S values were obtained from an SBE thermosalinograph (TSG) using water pumped in from a.
(11) Aiken et al.. 0. 35.8. 36.4 35.8. 36.4. .4. 36. .0 37. 8. 35.. Depth [m]. 36.4. 35.8. -100. 35.2 34.6. .0. 34.0. 35.8. 37. -50. -150. -200 50. 40. 30. 20. 10. 0. -10. -20. -30. -40. -50. Latitude [°] Fig. 2. A contoured vertical section of salinity from CTD casts (the dotted lines are the individual CTD stations).. 0. 2 0.. 0.3. 0.2. -50. 0.1. 0.2. 0.1. -100. 0.1 0.1. 1. 0. 1. -150 0.. Depth [m]. 0.1. -200 50. 40. 30. 20. 10. 0. -10. -20. -30. -40. -50. Latitude [°] Fig. 3. A contoured vertical section of chlorophyll fluorescence from station casts (in volts).. 9.
(12) AMT-5 Cruise Report. 0 95. .0. 0 95.. .0. -50. 94.0. 95. 95 .0. 94.0. .0. 96.0. 96. .0. 96.0. 98.0. -150. 95.0. -100 97.0. Depth [m]. 92. .0. 93. -200 50. 40. 30. 20. 10. 0. -10. -20. -30. -40. -50. Latitude [°] Fig. 4. A contoured vertical section of transmittance (%) from station profiles.. -250. 13.0. 13.0. 12.0. 14.0. 12.0. Depth [m]. -500 11.0. 11.0. -750 .0. 10. 11.0. -1,000. 10.. 0 9.0. 9.0. -1,250. 8.0. 8.0. 38.5. 38.0. 37.5. 37.0. Latitude [°] Fig. 5. A contoured XBT section (◦ C) showing Mediterranean Water at 1,000 m (the dotted lines are the individual XBT casts). 10.
(13) Aiken et al.. 0. 28 .0 2 224.0 . 0 20. 18 0 .0. -25. 28.0. .0. -75. 24.0 26.0. 20.0. -100. 24.0. 0 14.. 18.0. 22.0 20.0 18.0. 16.0. -125 11. 10. 9. 8. 7. 6. 5. 4. 3. 2. 1. .0. .0. 22.0. 16. 16. Depth [m]. 26. -50. 0. -1. Latitude [°] Fig. 6. A contoured XBT section (◦ C) through the equatorial region.. 0 10.0. 18.0. 8.0 6.0. 12.0 10.0. 4.0. 6.0 8.0. Depth [m]. 14. 16.0. -250. .0. 18.0. -500 8.0 6.0. -750. 4.0. -1,000. -1,250 -34. -35. -36. -37. -38. -39. -40. -41. -42. -43. -44. -45. Latitude [°] Fig. 7. A contoured XBT section (◦ C) through the confluence region.. 11.
(14) AMT-5 Cruise Report. 0. .0. 0. .0. 19.. 17. 15.0. 19 17 .0 .0. 15 17.0. .0. -100 13.0. Depth [m]. 23. .0 231.0 2. .0 21. 19.0. -50. 27.0 25.0. 13.0. -150. -200 50. 45. 40. 35. 30. 25. 20. 15. 10. 5. 0. -5. Latitude [°] Fig. 8. A contoured XBT section (◦ C) of the Northern Hemisphere.. 0. 18 20.0 16 .0 .0. 0. 20.. 24.0. .0. 18. 16.0. .0. 22. 22. -100. 14.0 12.0 10.0 8.0 6.0. .0. -50. Depth [m]. 26.0. 26.0. -150 14.0. -200 5. 0. -5. -10. -15. -20. -25. -30. -35. -40. Latitude [°] Fig. 9. A contoured XBT section (◦ C) of the Southern Hemisphere.. 12. -45. -50.
(15) Aiken et al. hull-mounted tube 7 m below the surface. A measurement depth of 100 m. At a depth of 200 m north and south of the was made every 5 s, which was logged into the ship’s com- equator, there are the narrow and swift North Equatorial puter system. Undercurrent (NEUC) and South Equatorial Undercurrent (SEUC), respectively. 3.1.2 Water Velocities The discharge from the Amazon River is carried northwestward and then eastward by the NECC, whereupon it The JCR has a hull-mounted 150 kHz Research Designs combines with the excess in precipitation over evaporation Instruments ADCP unit. The transducer is enclosed in an limited to a depth of approxioil-filled sea chest recessed into the hull to protect it from found in this region. It is ◦ mately 100 m at about 25 C (Emery and Dewar 1982) and ice. This chest is enclosed by a 33 mm thick window of a salinity less 35.0 (Müller-Karger et al. 1988). low density polyethylene and filled with silicone oil. The The NECC is prevented from flowing north by the east– ADCP unit uses a Doppler shift of the signals reflected west orientation of the African coastline; however, some of from four, pulsed acoustic beams radiating out and downit does escape north and combines with the NEUC to drive wards to derive subsurface currents. The method relies ◦ ◦ W,10 N. Because of the oba cyclonic gyre centered at 22 on particulate material in the water to scatter the acousserved doming of the thermocline in the summer, the gyre tic signals. The acoustic frequency employed is optimal for is known as the Guinea Dome. The associated circulation scattering from particles of the dimensions of zooplankton. Data were collected at 2 min intervals in 64 8 m bins. reaches to depths of 150 m and exists throughout the year, The ADCP data obtained during AMT-5 were logged and although, it weakens in winter. archived for subsequent processing. Distinct patterns of zooplankton migration were observed on a diel time scale as the zooplankton migrated to depth during the day and returned to the surface waters (within the ADCP range) by night. The combination of the special housing of the ADCP with high ship speed and very low particle concentrations during the day resulted in signal returns that were undetectable for large parts of the transect within the oligotrophic gyres.. 3.2 TOPEX It is particularly difficult to directly validate satellite altimetric measurements over the oceans due to the ever changing topography of the sea surface. In many areas, ocean topography maps often appear to be composed of many chaotic features, whereas in other regions, definite strong and coherent features are apparent. During AMT-5, a concerted effort was made to validate sea surface height (SSH) anomaly maps derived from the TOPEX altimeters using in situ measurements derived from XBT, CTD, and underway T -S measurements. TOPEX maps of SSH anomaly were used to identify the major features of the AMT-5 transect, which were then used to devise an appropriate in situ sampling strategy to resolve the major features seen in the imagery. The Atlantic equatorial current system displays an eastto-west, and west-to-east banded structure which dominates the surface flow and hydrography of the region. The North Equatorial Current (NEC) is a region of broad uniform westward flow north of 10◦ N. The easterly flowing North Equatorial Counter Current NECC, is highly seasonal and weakest in February when the trade winds in the Northern Hemisphere are strongest. The South Equatorial Current (SEC) is a broad and uniform westward flow, and extends from approximately 3◦ N to at least 15◦ S. The strongest equatorial current is the westward flowing Equatorial Under Current (EUC) centered on the equator at a. 3.2.1 Along-Track SSH The TOPEX satellite was launched in August 1992 and carries the most precise radar altimeters available to date. Two altimeters (C-band and Ku-band) are operated in tandem to facilitate the corrections required to compensate for the delay of the radar pulse caused by variations in ionospheric structure. Further corrections for the effect of tropospheric signal attenuation are undertaken using data derived from an on board microwave radiometer which determines the integrated water vapor content of the atmosphere. Extremely precise orbit tracking and position systems including a laser retroreflector array (for orbit tracking and height determination), a Doppler orbitography and radio-positioning system, plus an experimental global positioning system (GPS), allow the TOPEX satellite orbit to be maintained to within ±500 m. Operating in a 10-day repeat cycle, the TOPEX altimeters provide near-complete coverage of the world ocean between 66◦ N and 66◦ S having an equatorial track spacing of approximately 300 km. The precise orbit determination and novel atmospheric correction strategy adopted by the TOPEX mission, when referenced to the most current geoidal model, means that estimated SSH anomaly data have an accuracy of better than 5 cm. The region of the Atlantic equatorial current system was selected to validate along-track SSH anomaly data derived from the TOPEX altimeter. TOPEX along-track data were spatially interpolated to produce two-day analysis maps at the University of Colorado Center for Astrodynamics Research (CCAR). These data were then supplied to the JCR in near-real time via electronic mail (e-mail) communications. A combination of in situ profiling and underway instruments were used to resolve the vertical and horizontal structure of the region. Temperature profiles were obtained down to a depth of 1,830 m using T–5 XBTs. The. 13.
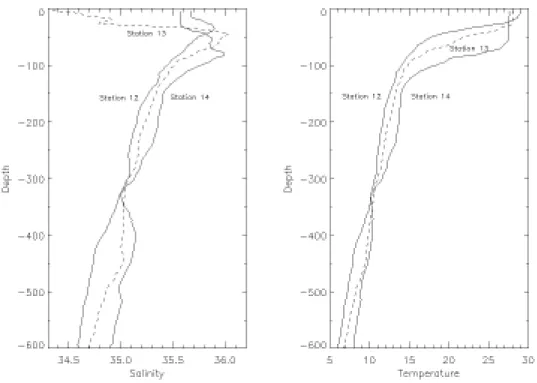
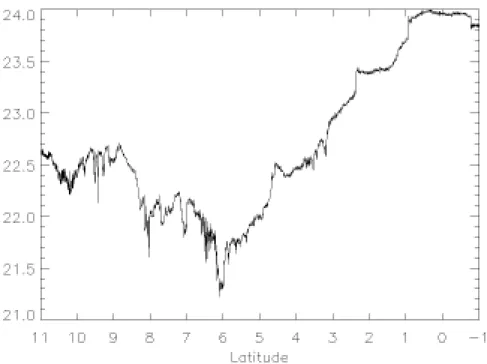
(16) AMT-5 Cruise Report deployment of the T–5s began as the vessel crossed over the Guinea Dome at approximately 20◦ W,10◦ N, continuing at 50 km intervals until the equator. In total, 25 XBTs were deployed through the region. Near-surface T -S values were obtained from the TSG. A measurement was made every 5 s, which was logged on the ship’s main computer system. The density of the surface waters was derived from the near-surface T -S values. CTD profiles were made with the SBE 911plus when the ship was stationary, which was deployed at three stations marked in Fig. 10 at 20.87◦ W,10.92◦ N, 22.47◦ W,7.03◦ N, and 24.16◦ W,2.82◦ N to a depth of 600 m. Figure 10 shows the TOPEX and second Earth Resources Satellite (ERS-2) analysis derived on 28 September 1997 for the region 12◦ N to 1◦ S. The AMT-5 cruise track has been overlaid onto this image together with the position of CTD Stations 12, 13, and 14 (heavy circles) and the XBT profiles (squares) completed within the region shown by the image. The TOPEX data reveals an east–west band of positive SSH anomaly greater than 10 cm in the latitude range of 9–4◦ N. CTD Stations 12 and 14 straddle the positive anomaly to the north and south, respectively, and CTD Station 13 was made in the central region. Complemented by two-hourly XBT casts and underway sampling, these stations were considered adequate for the validation of the SSH anomaly feature seen in Fig. 10. Figure 6 shows the XBT section derived from 25 XBT casts between the latitudes of 12◦ N and 1◦ S along the transect shown in Fig. 10. Within this figure, all of the major equatorial current features are resolved, including the Guinea Dome at 9◦ N, the NECC bounded by the 28◦ C isotherm between 8–3◦ N extending to a shallow depth of 40 m, the EUC shown by a deepening of the thermocline and a separation of the isotherms at 4–1◦ N, and the SEC together with the equatorial upwelling seen at 1◦ N. The NECC and associated currents are best resolved by salinity and density differences rather than by the temperature structure alone. CTD Stations 12, 13, and 14 are shown in Fig. 11. The salinity casts are shown in Fig. 11a and clearly reveal the NECC as a strong surface feature having a marked halocline at a depth of 30 m (Station 13). Station 12 reveals the NEC as a subsurface salinity maximum at a depth of 30 m, whereas Station 14 shows the characteristic deepening of the mixed layer and salinity maximum of the EUC at a depth of 50–100 m. Figure 11b shows the associated temperature cast data and reveals the NECC as a shallow (30 m) warm layer. As the NECC has a component of less dense water originating from the Amazon outflow, the surface density has been computed from underway temperature and salinity data from 7 m in depth, which is presented in Fig. 12. Here, the NECC is seen between 8.5–4.5◦ N with a low density core located between 6–7◦ N. These data are in excellent agreement with the position of the NECC, seen as positive SSH anomaly data shown in Fig. 10, and clearly demonstrate the ability of the TOPEX altimeter to locate major geostrophic current features.. 14. 3.2.2 Conclusions TOPEX along-track SSH anomaly data have been interpolated to produce two-day analysis maps which were supplied to the AMT-5 team in near-real time by the CCAR via e-mail communications. These images highlight the two-dimensional oceanographic surface structures which describe the context of the physio-chemical and biological ocean–atmosphere data sets recorded during the AMT-5 experiment. In particular, these data have been useful for determining the large-scale geostrophic current systems in the tropical regions where ocean color and thermal imagery are difficult to obtain due to the large amounts of cloud cover characteristic of these regions. Throughout the AMT-5 experiment, XBT profiles and CTD casts were made, which were used to validate the TOPEX sea surface height anomaly maps. Imagery supplied on 28 September 1997 clearly highlighted the NECC as the most dominant feature of the AMT-5 transect between 0–12◦ N and was chosen as a target area for TOPEX validation. In situ data sets, including XBT and CTD casts at regular intervals, as well as continuous underway sampling, were used to produce T -S sections and surface density measurements along the AMT-5 cruise track between 10◦ N to 1◦ S. These data clearly reveal the NECC characterized by warm less-saline waters. SSH anomaly maps derived from TOPEX for the same region clearly show the NECC as a positive SSH anomaly, and the position of the NECC suggested by the TOPEX data agrees exceptionally well with the in situ data. Satellite altimeter data provide an unprecedented view of the ocean surface providing information on the dynamics of geostrophic current systems through differences of ocean surface topography manifested in images of SSH anomaly. Vertical sections of the T -S structure of the North Atlantic equatorial current system between 12◦ N and 1◦ S identify the features seen in TOPEX SSH anomaly data as the NECC.. 3.3 ROSSA In order to understand the regulation of heat, momentum, and gas transfer, improved modeling of the processes defining the structure and state of the air–sea interface is required, which in turn, requires comprehensive in situ validation data sets. The current understanding of these processes remains poor, because of the limited availability of existing in situ data sets; however, data sets of this nature are required as a forcing function to atmospheric and climate models. In the case of coupled ocean–atmosphere models, understanding and quantification of the processes occurring at the air–sea interface are critical, because it is through this thin layer that all ocean–atmosphere heat, gas, and momentum exchange occurs. Many satellite instruments have complementary spectral wavebands and viewing geometries which provide both regional and global.
(17) Aiken et al.. Fig. 10. TOPEX/ERS-2 SSH analysis supplied to the JCR for 28 September 1997. Solid circles show CTD stations and open squares show the position of XBT casts along the AMT-5 transect.. Fig. 11. Salinity casts made at Stations 12, 13, and 14 along the AMT-5 transect (left panel) and the corresponding temperature casts (right panel).. 15.
(18) AMT-5 Cruise Report. Fig. 12. Underway density computed from the 7 m temperature and salinity data along the AMT-5 cruise track. coverage. Observations of the integrated atmospheric wa3.3.1 SOSSTR ter vapor content or estimates of the surface wind speed, This is the second ROSSA experiment to be executed surface roughness, air temperature, cloud cover, and dywithin the AMT Program. ROSSA has a number of obnamic structure of the ocean are all possible. jectives. The objective of the ROSSA activity within the AMT 1. Measure the sea surface skin temperature (SSST) of Program is to increase the understanding of the air-sea the air–sea interface, atmospheric humidity, longinterface by obtaining detailed in situ oceanographic and wave downwelling infrared, shortwave solar radiameteorological observations of both the interface itself plus tion, and bulk sea surface temperature measurethe general structure of the deeper ocean and upper atmoments (BSST) for the investigation of heat and gas sphere which define the behavior of the physio-chemical exchange between the ocean and atmosphere. and biological processes occurring at the air-sea interface. These data are collected for use with contemporaneous 2. Provide the mean atmospheric conditions of the and spatially coincident satellite observations from the NaAMT-5 experiment, from upper air profiles of temtional Oceanic and Atmospheric Administration (NOAA) perature and humidity, which are required to valAdvanced Very High Resolution Radiometer (AVHRR), idate the atmospheric transmission models and alERS-2 Along-Track Scanning Radiometer (ATSR), the gorithms used by satellite sensors (in both the ineighth Geostationary Operational Environmental Satellite frared, microwave, and visible spectral wavebands), (GOES-8), the Meteorological Satellite (METEOSAT) inwhich account for the atmospheric attenuation of frared radiometer, the TOPEX radar altimeter, and the water-leaving signals. Special Sensor for Microwave/Imaging (SSM/I) microwave 3. Provide a precision BSST measurement of the upper radiometer. When used synergistically, this combination 0.5 m of the sea surface. of satellite and in situ observation allows for a more com4. Validate (and calibrate) SSST measurements deplete description of the sea surface and atmosphere to be rived from the GOES-8, NOAA AVHRR, ERS-2 obtained. Of particular importance is the need to develop ATSR, and METEOSAT satellite infrared radiometechniques to derive estimates of the heat flux across the ters. air–sea interface from satellite data alone, and to under5. Validate new technology for the measurement of the stand the physio-biochemical processes which have a surSSST deviation with the aim of deploying semiface interface expression (e.g., biological slick material) by autonomous infrared radiometer systems on ships combining in situ and satellite data. The AMT program of opportunity. is ideally suited to this task.. 16.
(19) Aiken et al. 6. Validate TOPEX altimeter measurements using a combination of XBT and CTD casts together with underway T -S sampling. A new single-channel, broadband (8–12 µm) infrared radiometer system has been specifically developed through a joint effort of the CCAR and the Southampton Oceanography Centre (SOC), which aims to provide an autonomous system for accurately determining (0.1 K) the SSST. AMT-5 is the first deployment of this system which will be used in a more widespread ship of opportunity sampling program based at the University of Colorado. The ship of opportunity sea surface temperature radiometer (SOSSTR) consists of two TASCO THI-500L infrared radiometer heads (PRL 500L) mounted in a weatherproof enclosure together with a calibration subsystem, data logging, and communication package. The SOSSTR system uses a two-point continuous calibration obtained by viewing one of two precision blackbody cavities maintained at different temperatures. The blackbody units are attached to an armature which rotates 360◦ in approximately 12 minutes, thereby providing a complete end-toend calibration cycle for both radiometer heads. The internal temperature of the instrument is monitored by three separate platinum resistance temperature (PRT) sensors located at different points within the instrument enclosure. The radiometer output signals, together with instrument thermometry and housekeeping data, are sampled at 16 bits via a Campbell Scientific AM416 multiplexer to a CR10x data logger. Data are logged in real time to a workstation located in the Underway Instrumentation and Control (UIC) room via a dedicated RAD SRM6A/F shorthaul modem link run through the ship’s scientific wiring. The CR10x uses onboard 2 Mbyte random access memory (RAM) which acts as a ring buffer in case of communication problems between the UIC and the instrument. This provides over 5 h of onboard data storage should a communication problem occur. The configuration described above provides large flexibility in terms of real-time data access and instrument control, which can all be achieved using the workstation connection. The SOSSTR instrument was installed on the forward mast of the JCR to view the sea surface at an angle of 38◦ from nadir and the sky at the complementary vertical angle using a small laser unit. After initial setup and laboratory calibration of the radiometers and PRT sensors using an SIS T416 digital reversing thermometer and a blackbody unit, the instrument was thoroughly tested on the Grimsby-to-Portsmouth leg. Several problems were encountered including communication, operation, and instrument thermal stability issues. These were traced to a faulty Earth connection and the system was operated continuously for the remainder of the AMT-5 cruise. Additional optical alignment experiments were undertaken in situ off Madeira based on discrepancies in the analyzed data, but no adjustment to the optical train was required. The instrument proved to be robust against inclement weather. conditions, including heavy tropical rainfall events and up to force 8 sea conditions. Viasala RS-80 radiosonde packages measuring atmospheric temperature, pressure, and relative humidity were deployed every day. These data were logged to a Viasala PP-11 PTU preprocessor deck unit and finally to a personal computer (PC). Processing software to generate geophysical variables from the raw data were written during the cruise in the Interactive Data Language (IDL). Figure 13a shows the positions of all the radiosonde releases completed during the AMT-5 cruise, and Fig. 13b shows a sample of the processed vertical profiles of potential temperature and specific humidity obtained on SDY 280. The batch of RS-80 sondes supplied by BAS from the UK meteorological office were more consistent this year, and only one sonde was rejected because of faulty sensors. It is recommended that a future installation of the receiving antenna be located at a higher part of the ship, ideally on the main mast, due to reception difficulties in certain conditions. For example, when the sonde flew to starboard, significant reception deterioration was encountered due to shielding by the ship’s superstructure. All data were reported in near-real time to the UK meteorological office as part of the ship’s meteorological program.. 3.3.2 Radiation Measurements An Eppley longwave (5.0–50.0 µm) pyrgeometer and shortwave pyranometer (0.3–3.0 µum) were installed in the JCR foremast bird table using custom gimbal mounts. Because of the difficulty of installing and removing a larger mount bracket, which was attached to the top of the bird table during AMT-3, the instruments were directly attached to the side of the mast. Data were logged to a Campbell Scientific CR10x data logger installed at the foremast first stage. Because of data logger problems, these data were available for only the Madeira-to-Stanley leg. Calibration of the pyranometer was a straightforward application of predetermined calibration coefficients; however, in the case of the pyrgeometer measurements, recent evidence suggested that solar heating of both the instrument case and of the filtered hemisphere directly contribute to the measured signal as errors. A correction for these effects will be derived after the Eppley pyranometer has been calibrated at the SOC Institute of Oceanographic Sciences (IOS) pyrgeometer calibration facility. A second Kipp and Zonen CM-10 pyranometer, owned by BAS and logged by the Oceanlogger system, was installed in the first stage island of the JCR foremast. The instrument was not mounted on gimbals and suffered from shading by the foremast. This effect is difficult to correct for, since signal bias depends not only on the direct shading of the mast but also on any reflection that may occur from the white paint of the mast structure. A full analysis of the differences between the BAS and CCAR Eppley radiometers will be undertaken in the future to correct the BAS pyranometer data.. 17.
(20) AMT-5 Cruise Report. a. b. Potential Temperature [°C] 0. 50. 100. 150. EEE EE EE GGGGGGGGGGGGGGGGGGGGGGGGG G G G EE G GGGG EE GGGGGG G G E 200 E GGG EE G EE G GG EE GG EE G EE GGG E G 400 E EE GGG G EE EE GGGG G G EEEE GG EEEEE GGG 600 E GG EEEE EEEE GGG GG EEEEEEE GGG EEEE GG EEEE 800 E EEEEEEEEGGEGEGGGGGGGEEEEEEEEEEEE EEEEEEEEE EEEEEEE GGG EEEEE G EEEEEEEE GG GG EEEEEEEEEE G EEE G 1000. Pressure [mb]. 0. 0. 4. 8. Specific Humidity [g c. E. Temperature Residual [°C]. 0.0. -0.4. E EE EEEEEEEEE E EEEEEEEEEEEEEEEEEEEEEEEEEEEEEE E E E EEEEEEEE EEEE EEEEE E E E E E EEEEEEEEEEEEEEEEEEEEEEEEEEEEEEEEEEEEEEEEEEEEEEEEEEEEEEEEEEEEEEEEEEEE EEEEEEEE E EE EEEEE E E EE E EEEEEEEE E EE EE E EE EEEEEEEEEEEEEEEEEEEEEEEEEEEEEEEEEEEEEEEEEEEEEEEEEEE EEEE E EEEEEEEEEEEEEEEEEEEEEEEEEEEEEEEEEEEEEEEEEEEEEEEEEEEEEEEEEEEEE EEE EE EEE EEEEEEEEEEE EEEEEEEEEEEEEEEEEEEEEEEEEEEEEEEEEEEEEEEEEEEE E E E E E EEEEEEEEEEEE EEE E EEE E EEE E E E E E E E EEE EE E E EEEEEEEE EE E E EEEEEE EEEE E E E E. -0.5 260. 265. -0.1. -0.2. -0.3. 12. kg-1]. 270. 275. 280. 285. 290. E E EEEE E EEEEEEEEEEEEEEEEEE E EE EEEEEEEEEEEEEEE EEEE. 295. 300. SDY [1997]. Fig. 13. SOSSTR summaries for AMT-5: a) the positions of all the radiosonde releases, b) potential temperature (squares) and specific humidity (circles) as a function of pressure, and c) the temperature difference (residual) between the SST and the hull mounted temperature probe.. 18.
(21) Aiken et al. Near-surface BSST measurements have been obtained from an IOS trailing thermistor sensor deployed from the port side of the JCR. The thermistor cable is attached to a heavy 12 mm steel cable having a counterweight attached to its length at approximately 2 m from the tether point. The tether was from a 3 m scaffold pole deployed on the port side of the ship. This configuration resulted in superior streaming of the sensor at a depth of approximately 0.05–0.1 m. Data was logged continuously to the Oceanlogger system (channel SP3) for the entire AMT-5 cruise via a Rhopoint frequency module after signal conditioning. BSST data derived from this sensor were accurate to 0.02 K after the following polynomial coefficients were applied to the logged frequency data: PDM009 calibration run number SP21897A (08–19–1997) C0 = 65.39008, C1 = −0.108196, C2 = 1.258201 × 10⁻⁴ , and C3 = −9.341802 × 10⁻⁸ . Significant temperature differences in excess of 1 K were found when the trailing thermistor data were compared with the scientific BSST data. These were due to the vertical stratification of the water column and highlight the need for this type of independent temperature sensor, especially for air–sea exchange studies. In order to check the accuracy of the ship’s BSST (7 m temperature), periodic bucket casts were made throughout the cruise. The in situ sensor on the JCR is difficult to calibrate because of its installation location. The 5 m CTD temperatures can be used, although, the ship is no longer moving through the water during CTD deployments. The primary aim of the science PRT is to apply a correction to the more accurate and precise TSG located within the ship, which derives a more precise BSST having a warm bias due to water flowing through the ship’s internal pipes and pumping system. As shown in Fig. 13c, the simple correction shows a distinct nonlinearity with the BSST itself. Bucket SST observations made on a daily basis show that the science PRT is accurate to within the tolerances of the bucket determination (±0.1 K). The quadratic coefficients required to correct the T -S data for ship warming are as follows: C0 = 0.410645, C1 = 0.991333, and C2 = −2.38419 × 10⁻⁵ .. 3.3.3 Meteorological Observations Since the BAS Viasala HMP-30 humidity sensor (osmotic type) was unavailable, a World Ocean Circulation Experiment (WOCE) standard IOS psychrometer unit was installed ino the JCR foremast in a clean air stream. The unit used an electric fan to aspirate a wet and dry PRT sensor located in a robust sun shield. These data were logged via Rhopoint modules to the Oceanlogger system (channels SP1 and SP2) for the entire AMT-5 transect. Wet and dry bulb air temperatures (accurate to better than 0.02 K) were obtained by applying the following calibration coefficients to these data streams: psychrometer IO2001 wet-bulb calibration run number TW22397A. (08–19–1997) C0 = −10.17774, C1 = 3.778868 × 10⁻² , C2 = 2.720534 × 10⁻⁶ , and C3 = −3.03224 × 10⁻¹⁰ ; and psychrometer IO2001 dry-bulb calibration run TD00897A (08–19–1997) C0 = −10.18599, C1 = 3.809756 × 10⁻² , C2 = 2.238674 × 10⁻⁶ , and C3 = −1.021467 × 10⁻¹⁰ . During the cruise, the bridge officers kept an hourly log of the general atmospheric conditions including cloud type and amount, swell direction and magnitude, and sea state. This is available on request as an American Standard Code for Information Interchange (ASCII) text file.. 3.3.4 Satellite Data Sets Several satellite data sets, including GOES-8, NOAA AVHRR ERS-2 ATSR, SSM/I and the METEOSAT sensors, are available to the AMT-5 cruise participants (on request).. 3.4 In-Water Optics As with many of the other types of measurements collected during AMT-5, optical data were collected underway and on station. The UOR and a hand-held sun photometer provided the majority of the former; whereas, the latter were provided principally by three different multispectral profiling systems: SeaOPS, SeaFALLS, and LoCNESS (Appendix E). SeaOPS was deployed using a winch and crane, whereas, SeaFALLS and LoCNESS are tethered systems that were deployed by hand. The crane used with SeaOPS had about a 10 m reach over the side of the ship, and the tethered systems were at least 30 m away before any data were collected. All of the in-water profiling instruments collected Ed (z, λ) and Lu (z, λ) data. Underway and station surface (solar) irradiance data were provided by an in-air irradiance sensor, Es (0+ , λ), that was mounted on the port trawl post mast, as part of SeaOPS; the SeaWiFS Square Underwater Reference Frame (SeaSURF), which is composed of an in-water irradiance sensor, Ed (0- , λ), suspended below a tethered, square floating frame; the SeaWiFS Buoyant Optical Surface Sensor (SeaBOSS), which is composed of an in-air irradiance sensor, Es (0+ , λ), fitted inside a buoyant collar, so it can be deployed on a mast or as a tethered buoy; and a PAR sensor (with a deck cell) which was integrated into the CTD system. The redundancy in optical instruments deployed on AMT cruises is a direct consequence of the weaknesses and strengths associated with winch and crane deployment systems versus tethered or free-fall systems. Optical instruments deployed with crane and winch systems potentially suffer from more disadvantages than advantages: 1. Cranes have a limited reach, so ship shadow can be a problem. 2. The ship is not decoupled from the ocean surface, so roll and pitch can cause measurement problems (particularly for irradiance sensors).. 19.
(22) AMT-5 Cruise Report 3. Winches and cranes are sophisticated electromechanical systems, so there is a continuing vulnerability associated with breakdowns, this is especially so with the hydraulic subsystems.. station scheduling can be kept informal with the ship being stopped only when the illumination conditions are optimal. Since station time is limited during AMT cruises, it is not always apparent immediately before a station which system will produce the best data. Part of the difficulty 4. Winches and cranes require relatively lengthy arises from the competing requirements of all of the instrupreparation time for operations to begin and mentation that is deployed at each station and the vessel end, which means a quick cast during optimal maneuvers (to counter wind, wave, and current effects) sky conditions is difficult to achieve. which are required to maintain station. Profilers require 5. The instruments are not lowered into the water the vessel to stay clear of the instruments which usually until they are far from the side of the ship, so means some forward motion is needed. Unfortunately, forthere is very little chance of them being damaged ward motion is not always an option, since the other inby wave action. struments can be negatively affected by this movement. If conditions permitted, the daily station included simulta6. Many winches have relatively low descent and neous SeaOPS and SeaFALLS (and at times LoCNESS) ascent rates, so the cycle rate for a complete cast casts, and when conditions prevented simultaneous casts, is relatively long. (A long cycle rate means cloud SeaOPS was deployed first, and the tethered instruments contamination during a cast is very likely. This were deployed soon after. means the cast must be temporarily stopped to All of the radiometers used with the UOR, SeaOPS, allow the cloud to pass, which in turn adds to and SeaFALLS, including any spares, were manufactured the time required.) by Satlantic, Inc.† (Halifax, Canada). This commonality Tethered (or free-fall) systems, in comparison, have more in equipment was not by accident; the AMT optical scienstrengths than weaknesses: tists decided this was the easiest way to ensure redundacy A. The reference(s) and profiler are deployed away and intercalibration. The UOR and SeaOPS use 7-channel from the ship clear of any ship-induced perturocean color radiance series 200 (OCR-200) sensors, as well bations to the light field. as 7-channel ocean color irradiance series 200 (OCI-200) sensors. The OCI-200 and OCR-200 radiometers use 16B. The profiler is not subject to wave action, but bit analog-to-digital (A/D) convertors and are capable of it must be properly trimmed to ensure minimal detecting light over a four decade range. SeaFALLS, Seatilts during descent. SURF, and SeaBOSS are all equipped with 13-channel OCI C. A free-floating reference is not decoupled from and OCR series 1000 radiometers, which employ 24-bit surface motion, but engineering solutions and A/D converters, and are capable of detecting light over a deployment practices can be adopted to reduce seven decade range. this effect. A spare OCR-200 (S/N 035) and OCI-200 (S/N 029) D. There is a direct cable connection between the were taken on AMT-5 to provide redundancy for the UOR instruments and the data acquisition units, so and SeaOPS. All of the series 200 radiometers made meathere is no complicated (hydraulic) machinery surements in the same seven spectral bands (approximately or electrical (slip ring) connection which can re412, 443, 490, 509, 555, 665, and 683 nm), which were quire long repair times in the event of a failure. selected to support SeaWiFS calibration and validation activities (McClain et al. 1992); in comparison, the seE. The cable is usually a lighter weight material R ries 1000 radiometers cover the SeaWiFS bands plus other †), and is more easily than steel (e.g., Kevlar° parts of the spectrum in greater detail. damaged in comparison to the standard hydroTowards the end of the cruise, SeaOPS was reinstruwire used with winch systems. mented with spare components. The original SeaOPS light F. The instruments are usually hand lowered close sensors and data acquisition unit were used to build LoCto the side of the ship, so they are vulnerable to NESS which is very similar to SeaFALLS in looks and funcdamage by wave action. tions. Daily monitoring of the calibration of the UOR, G. Deployment and recovery can be accomplished SeaOPS (and LoCNESS), SeaFALLS, SeaBOSS, and Seawith only two scientists (and no crew), so a rapid SURF radiometers was provided by the SeaWiFS Quality cycle rate can be achieved. Monitor (SQM), which was used on AMT-3 (Hooker and Aiken 1998) and AMT-4. The latter is particularly important, because it means casts can be executed in between cloud passage and more casts can be done in a particular unit of time. It also means † Identification of commercial products and equipment to ade† Kevlar is a registered trademark of E.I. du Pont de Nemours and Company, Wilmington, Delaware.. 20. quately specify or document the experimental problem does not imply recommendation or endorsement, nor does it imply that the equipment identified is necessarily the best available for the purpose..
Figure
![Fig. 18. The correlation of fluorometrically determined chlorophyll a and HPLC total chlorophyll a [f (x) = 0.8809x + 0.00883 and R 2 = 0.9555].](https://thumb-us.123doks.com/thumbv2/123dok_us/8403734.2232722/35.918.123.798.213.892/fig-correlation-fluorometrically-determined-chlorophyll-hplc-total-chlorophyll.webp)

+7


Related documents
June, 2015 Economic parameter of maize sheller for custom hire service in Bangladesh Vol.. 2 147 2.1
Ministry of National Defence, in cooperation with the Ministry of Science and Higher Education launched a pilot programme of voluntary military training for students under the
With the expansion of the online and also the style of programme users, internet search effectiveness and user satisfaction are often improved by.. Recent approaches to
This investigation aimed to analyze the photocatalytic disinfection of Escherichia coli and to evaluate the effect of photocatalyst concentration, UV illumination
The lower RLS values for stabilized samples cured under UMD for 14 days as compared to samples cured under UMD for 7 days and immersed in water for another 7 days may be due
Additionally, OECD’s neoliberal approach for taking up human capital theory through its ‘global competence’ PISA education solution causes power relations between OECD and.
The purpose of our study was to evaluate and compare the cerebral macro- and microvascular architecture of rats in two different models of permanent middle cerebral artery
Both children and adolescents with ADHD and a primary diagnosis of affective psychoses, adjust- ment reaction, or depressive disorder had longer LOSs and higher costs compared
