RICE-HUSK ASH-CARBIDE-WASTE STABILIZATION OF RECLAIMED
ASPHALT PAVEMENT
J. E. Edeh
1,*, I. Samson
2and A. Terhemba
3.1,3DEPT. OF CIVIL ENGINEERING.,UNIVERSITY OF AGRICULTURE,MAKURDI,BENUE STATE.NIGERIA.
2DEPT. OF CIVIL ENGINEERING,BENUE STATE MINISTRY OF WORKS AND TRANSPORT,MAKURDI,BENUE STATE.NIGERIA.
E-mail adddreses:
1[email protected],
2[email protected],
3[email protected]
ABSTRACT
This paper present results of the laboratory evaluation of the characteristics of carbide waste and rice husk ash stabilized reclaimed asphalt pavement waste with a view to determine its suitability for use as flexible pavement material. The mixtures were subjected to British Standard heavy compactive effort to determine the compaction characteristics, California bearing ratio, durability and water absorption. Test results showed that the maximum dry density increased while optimum moisture content decreased with carbide waste content and lower rice husk ash contents at any fixed reclaimed asphalt pavement content in the mixes. Optimum California bearing ratio values of 62.0 % (unsoaked) and 66.0 % (soaked for 24 hours) were recorded for 75% RAP + 25% CW mix, with minimum water absorption of 5.7 % and resistance to loss in strength of 84.1 %, hence the recommendation of the mixture for use as sub-base material in flexible pavement construction.
Keywords: Carbide waste, Flexible pavement material, Reclaimed asphalt pavement, Rice husk ash and Stabilization
1. INTRODUCTION
Increasing industrial and agricultural processes across the globe have significantly increased industrial and agricultural wastes generation which most often have negative impact on the environment. The economic utilization of these wastes for beneficial engineering purposes has prompt an investigation into the stabilization potentials of rice-husk ash (RHA) and carbide-waste (CW) in reclaimed asphalt pavement (RAP) [1].
Rice-husk is the outer cover of rice grains which has a very high concentration of silica as major compound. It is an agricultural waste obtained by milling of rice. In Nigeria, rice is cultivated in large quantity in the North-West and North-Central regions, which contributes about 4.7 million tons to the world rice production and makes her the second and the sixteenth largest producer of rice in Africa and the world, respectively [2]. Rice-husk when burnt in the open environment produces another residue called rice-husk ash. The ashes have chemical and mineralogical and morphological characteristics that vary with the equipment and the process temperature
[3]. Rice-husk when burnt at temperature T≤ 7000C produces high content of amorphous silica. At temperature above 7000C crystalline silica is produced. The ashes produced at this temperature have high silica content ranging from 80 % to 95 % [4]. The ashes are resistant to chemical etching (acid slag) and thermal shock (temperature variation above 600oC) and have low thermal conductivity and low mechanical properties. Mishra et al [5] in their work on the study of physical and thermal properties of rice-husk as related to its industrial application, reported that rice-husk ash have thermal conductivity of 0.065 Wm-1k-1. Many other researchers gave value of thermal conductivity of rice-husk ash in the range 0.01 - 0.15 Wm-1k-1. The low thermal conductivity for the ashes confirms the idea that the ashes are excellent raw material value of thermal insulator fabrication [6].
Carbide-waste (CW) is the by-product of calcium carbide, obtained from the production of acetylene gas (C2H2) used in welding works. The chemical composition of carbide waste as presented by Al-Khaja [7] shows that carbide lime waste contains Copyright© Faculty of Engineering, University of Nigeria, Nsukka,
Print ISSN: 0331-8443, Electronic ISSN: 2467-8821 www.nijotech.com
65.05 % CaO, 0.97 % MgO, 0.64 % SO3, ˂0.10 % SiO2, ˂1.22 % Al2O3, 0.02 % Fe2O3 and a loss on ignition value of 27.92 %. Carbide waste is disposed in the environment without adequate treatment. On entering into the soil, it contribute to soil nutrient enrichment and also to the accumulation of toxic compounds in biomass and sediments. The infiltration of these substances leads to the death of soil living biota [8]. The term "RAP" is an acronym for reclaimed asphalt pavement. This means the reuse of the bituminous mixture of highway wearing cover that was removed during the rehabilitation of the wearing course after its life span. The removed asphalt pavement is termed RAP [9, 10]. When properly crushed and screened, RAP consists of high quality, well graded aggregates coated by bitumen cement [11]. Basically, the constituent materials for RAP are bitumen (since majority of bitumen has been lost by the process of photo-oxidation overtime), tar and aggregates.
The significance of this work is the development of an alternative road building material made of RAP stabilized with RHA-Carbide waste (CW) for use as highway pavement materials that will lead not only to economic solution [12], but also reduction in the amount of waste materials requiring disposal during construction work [13].
2. MATERIALS AND METHODS 2.1 Materials
2.1.1 Reclaimed Asphalt Pavements
Reclaimed asphalt pavement (RAP) used for this study was obtained from the scarified road surfacing and wearing courses spoiled along Makurdi - Otukpo road at Lower Benue River Basin Development Authority (latitude: 7º 45' 00'' N, longitude: 8º 34' 00'' E) in Makurdi, Benue State, North Central Nigeria. The RAP
was crushed using a hand-hammer, from its “lump” state to smaller sample sizes passing through a 20 mm aperture sieve in accordance with ASTM C702-98 [14].
2.1.2 Rice Husk Ash
Bulk samples of the rice husk ash (RHA) was obtained from the rice mill dump at Naka (Latitude: 7°37'55.06"Longitude: 8°12'59.62") the head-quarter of Gwer-West Local Government Area of Benue State, North Central Nigeria. The percentage passing 6.3 mm aperture sieve was used for this work.
2.1.3 Carbide Waste
The carbide waste (CW) used for this study was obtained from the mechanic workshop at Lafia park ((latitude: 7º 45' 00'' N, longitude: 8º 34' 00'' E) along Makurdi-Lafia road in Makurdi, Benue State, North Central Nigeria. The sample sizes passing through a 6.3 mm aperture sieve in accordance with ASTM C702-98 [14] was air-dried in the geotechnical laboratory of the University of Agriculture, Makurdi, before it was use for the tests.
2.2 Methods
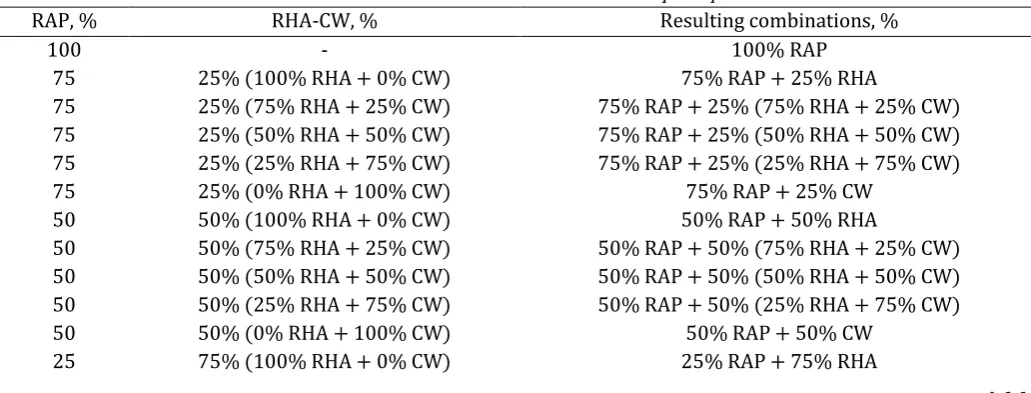
Samples of RAP and CW + RHA mixes were tested to determine their index properties, particle size distribution, soil classification, specific gravity, water absorption and compaction characteristics in accordance with BS 1377 [15] and standard ASTM codes. RAP in stepped concentration of 25 % (i.e., 0, 25, 50, 75, to 100 %) was stabilized with reconstituted CW + RHA mixes with the peak proportion determined during the preliminary mix design tests (see Table 1). The specification relating to the use of these indices for highway design and construction in Nigeria are given in FMW&H [16].
Table 1: Carbide waste-rice husk ash stabilized reclaimed asphalt pavement mix ratios
RAP, % RHA-CW, % Resulting combinations, %
100 - 100% RAP
75 25% (100% RHA + 0% CW) 75% RAP + 25% RHA
75 25% (75% RHA + 25% CW) 75% RAP + 25% (75% RHA + 25% CW)
75 25% (50% RHA + 50% CW) 75% RAP + 25% (50% RHA + 50% CW)
75 25% (25% RHA + 75% CW) 75% RAP + 25% (25% RHA + 75% CW)
75 25% (0% RHA + 100% CW) 75% RAP + 25% CW
50 50% (100% RHA + 0% CW) 50% RAP + 50% RHA
50 50% (75% RHA + 25% CW) 50% RAP + 50% (75% RHA + 25% CW)
50 50% (50% RHA + 50% CW) 50% RAP + 50% (50% RHA + 50% CW)
50 50% (25% RHA + 75% CW) 50% RAP + 50% (25% RHA + 75% CW)
50 50% (0% RHA + 100% CW) 50% RAP + 50% CW
RAP, % RHA-CW, % Resulting combinations, %
25 75% (75% RHA + 25% CW) 25% RAP + 75% (75% RHA + 25% CW)
25 75% (50% RHA + 50% CW) 25% RAP + 75% (50% RHA + 50% CW)
25 75% (25% RHA + 75% CW) 25% RAP + 75% (25% RHA + 75% CW)
25 75% (0% RHA + 100% CW) 25% RAP + 75% CW
0 100% (100% RHA + 0% CW) 100% RHA
0 100% (75% RHA + 25% CW) 75% RHA + 25% CW
0 100% (50% RHA + 50% CW) 50% RHA + 50% CW
0 100% (25% RHA + 75% CW) 25% RAP + 75% CW
0 100% (0% RHA + 100% CW) 100% CW
2.2.1 Physical Properties
The particle size distribution curve of RAP, CW, RHA and the various RAP + CW + RHA mixes were determined in accordance with ASTM D6913-04 [17]. Test mix proportions for the Atterberg limit determinations were prepared on a percent by dry weight basis using the material passing the 0.425 mm sieve in accordance with ASTM D4318-10 [18].These tests were carried out on the various RAP + CW + RHA mixes. and the results show that the mix proportions were non-plastic and possess no cohesion. Hence, Atterberg limits were taken as non plastic [19].
About 50-100 g of oven-dried sample of RAP, CW, RHA and the various RAP +CW + RHA mixes were passed through a sieve with a 2.36 mm sieve aperture, and the specific gravity determined in accordance to procedures outlined in ASTM C 127 [20].
2.2.2 Compaction
Moisture-density relationships were determined for the various RAP + CW + RHA mixes using the modified Proctor compaction achieved using a 4.5 kg rammer falling through a height of 45 cm onto five layers, each receiving 25 uniformly distributed blows [21].
2.2.3 California Bearing Ratio
The California bearing ratio (CBR) test was performed on the various RAP + CW + RHA mixes in accordance with ASTM D1883 - 99[22]. Some of the specimens compacted for the CBR tests were wrapped in an air and water-tight cellophane bags for 24 hours (unsoaked condition) while the other specimens were completely soaked in water for 24 hours (soaked condition) before the CBR specimens were tested. The ratio is determined at penetrations of 2.5 and 5.0 mm and the highest value was used [23].
2.2.4 Durability
Durability assessment of the various RAP + CW + RHA mixes were carried out using the aggregate impact value (AIV) method following the procedures described in BS 812-112 [24]. The compacted specimens were cured under uniform moisture distribution (UMD) for 7 days after which a part of each compacted mix proportion was then partially immersed in water for another 7 days as compared to the composite material cured under uniform moisture distribution (UMD) for 14 days, and subjected to aggregate impact test. This action breaks the aggregate to a degree that is dependent on the impact resistance of the material. This degree was assessed by performing sieve analysis on the impacted specimen and was taken as the aggregate impact value (AIV). The degradation in terms of increased percent passing sieve 2.36 mm aperture, of the composite materials after impact, represent the loss in strength of the RAP + CW + RHA mixes and the AIV corresponding to 100 – resistance to loss in strength (RLS, %) for the two test conditions were compared. The water absorption characteristic was assessed as the difference in weight of the samples before immersion in water and the weight of the same samples after 7 days immersion in water, expressed as percentage of the original weight of samples before immersion in water.
3.RESULTS AND DISCUSSION
3.1 Oxide Composition of Carbide Waste and Rice Husk Ash
ASTM C618-92a [25] specification for coal fly ash, the CW used for this study falls under class C and like fly ash, is self-cementing while RHA has calcium oxide (CaO) content of 1.45 % and the silicon oxide (SiO2) content is 74.15 %. The CaO/SiO2 ratio, which is indicative of cementing potential, is 0.0196, SiO2 + Al2O3 + Fe2O3 = 75.35 %. Loss on ignition (LOI), which is the indication of the amount of unburned carbon in the RHA is 2.85 %. According to ASTM C 618-92a [25] specification for coal fly ash, the RHA used for this study falls under class F and like coal fly ash, is not self-cementing.
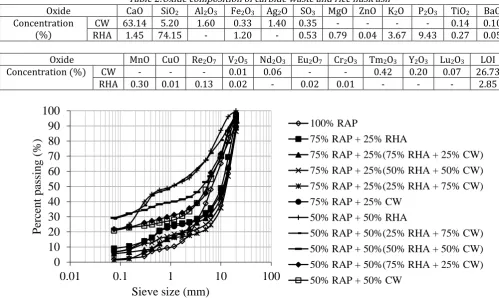
3.2Particle Size Distribution
The particle size distribution curves of the various RAP + CW + RHA mixes are shown in Figures 1 and 2. The gradation of 100 % RAP is composed of 94.80 % coarse particles (78.2 % gravel and 16.6 % sand) and 1.8 % fines with coefficient of uniformity, Cu = 9.0 and coefficient of curvature, Cz = 1.6, and falls under the American Association of State Highway and Transportation Officials (AASHTO) classification of A-1-a (granular materials). Because 100% RAP satisfy the requirements of grading (Cu>4 and 1<Cz<3), it is described as well graded GRAVEL. 100% CW is composed of 57.25 % coarse particles and 46.8 % fines with coefficient of uniformity, Cu = ∞ and
coefficient of curvature, Cz = 0, and falls under the AASHTO classification of A-4 (silt materials). 100% CW does not also satisfy the requirements of grading (Cu>4 and 1<Cz<3), hence, it is described as poorly graded silty SAND. 100% RHA is composed of 71.2 % coarse particles and 28.8 % fines with coefficient of uniformity, Cu = ∞ and coefficient of curvature, Cz = ∞, and falls under the AASHTO classification of A-2-4 (silty sand materials). 100% RHA does not satisfy the requirements of grading (Cu>4 and 1<Cz<3), hence, it is described as poorly graded silty soil. The particle size distribution of the various RAP + CW + RHA mixes shows that it is composed of 48.2 – 86.0 % coarse aggregates and 1.4 – 51.8 % fines, with coefficient of uniformity, Cu in the range 0 – ∞ and coefficient of curvature, Cz in the range 0 – ∞, and falls under the AASHTO classification in the range A-4 (silt materials) to A-1-a (granular materials). The various RAP + CW + RHA mixes can be described in the range of poorly graded silty SAND to poorly graded gravelly SAND and are rated in the range of fair to excellent highway material [19]. The improved particle size grading of the RAP + CW + RHA mixes may be due to flocculation and agglomeration of the particles of CW, RHA and RAP into larger effective particle size [26].
Table 2:Oxide composition of carbide waste and rice husk ash
Oxide CaO SiO2 Al2O3 Fe2O3 Ag2O SO3 MgO ZnO K2O P2O3 TiO2 BaO
Concentration (%)
CW 63.14 5.20 1.60 0.33 1.40 0.35 - - - - 0.14 0.10
RHA 1.45 74.15 - 1.20 - 0.53 0.79 0.04 3.67 9.43 0.27 0.05
Oxide MnO CuO Re2O7 V2O5 Nd2O3 Eu2O7 Cr2O3 Tm2O3 Y2O3 Lu2O3 LOI
Concentration (%) CW - - - 0.01 0.06 - - 0.42 0.20 0.07 26.73
RHA 0.30 0.01 0.13 0.02 - 0.02 0.01 - - - 2.85
Figure 1: Particle size distribution curves for 100 % RAP and the various RAP + CW + RHA mixes.
0
10
20
30
40
50
60
70
80
90
100
0.01
0.1
1
10
100
P
erc
ent
pa
ssi
ng
(%
)
Sieve size (mm)
100% RAP
75% RAP + 25% RHA
75% RAP + 25%(75% RHA + 25% CW)
75% RAP + 25%(50% RHA + 50% CW) 75% RAP + 25%(25% RHA + 75% CW)
75% RAP + 25% CW 50% RAP + 50% RHA
50% RAP + 50%(25% RHA + 75% CW)
50% RAP + 50%(50% RHA + 50% CW) 50% RAP + 50%(75% RHA + 25% CW)
Figure 2: Particle size distribution curves for 100% CW, 100% RHA and the various RAP + CW + RHA mixes.
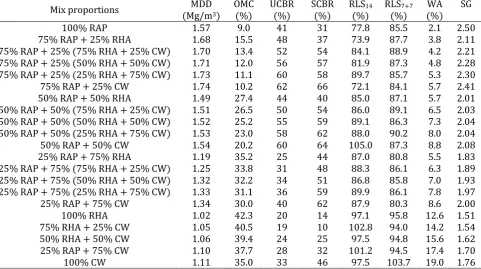
Table 3: Variation of maximum dry density (MDD), optimum moisture content (OMC), California bearing ratio (CBR), resistance to loss in strength (RLS) and water absorption (WA) of various CW + RHA stabilized RAP mixes.
Mix proportions MDD
(Mg/m3)
OMC (%)
UCBR (%)
SCBR (%)
RLS14
(%)
RLS7+7
(%)
WA (%)
SG
100% RAP 1.57 9.0 41 31 77.8 85.5 2.1 2.50
75% RAP + 25% RHA 1.68 15.5 48 37 73.9 87.7 3.8 2.11
75% RAP + 25% (75% RHA + 25% CW) 1.70 13.4 52 54 84.1 88.9 4.2 2.21
75% RAP + 25% (50% RHA + 50% CW) 1.71 12.0 56 57 81.9 87.3 4.8 2.28
75% RAP + 25% (25% RHA + 75% CW) 1.73 11.1 60 58 89.7 85.7 5.3 2.30
75% RAP + 25% CW 1.74 10.2 62 66 72.1 84.1 5.7 2.41
50% RAP + 50% RHA 1.49 27.4 44 40 85.0 87.1 5.7 2.01
50% RAP + 50% (75% RHA + 25% CW) 1.51 26.5 50 54 86.0 89.1 6.5 2.03
50% RAP + 50% (50% RHA + 50% CW) 1.52 25.2 55 59 89.1 86.3 7.3 2.04
50% RAP + 50% (25% RHA + 75% CW) 1.53 23.0 58 62 88.0 90.2 8.0 2.04
50% RAP + 50% CW 1.54 20.2 60 64 105.0 87.3 8.8 2.08
25% RAP + 75% RHA 1.19 35.2 25 44 87.0 80.8 5.5 1.83
25% RAP + 75% (75% RHA + 25% CW) 1.25 33.8 31 48 88.3 86.1 6.3 1.89
25% RAP + 75% (50% RHA + 50% CW) 1.32 32.2 34 51 86.8 85.8 7.0 1.93
25% RAP + 75% (25% RHA + 75% CW) 1.33 31.1 36 59 89.9 86.1 7.8 1.97
25% RAP + 75% CW 1.34 30.0 40 62 87.9 80.3 8.6 2.00
100% RHA 1.02 42.3 20 14 97.1 95.8 12.6 1.51
75% RHA + 25% CW 1.05 40.5 19 10 102.8 94.0 14.2 1.54
50% RHA + 50% CW 1.06 39.4 24 25 97.5 94.8 15.6 1.62
25% RAP + 75% CW 1.10 37.7 28 32 101.2 94.5 17.4 1.70
100% CW 1.11 35.0 33 46 97.5 103.7 19.0 1.76
UCBR (%) = Unsoaked California bearing ratio; SCBR (%) = Soaked California bearing ratio.
3.3 Specific Gravity
The specific gravity values of 100% RAP, 100% CW and 100% RHA are 2.50, 1.76 and 1.51, respectively. The specific gravity of RAP falls outside the recommended range of 1.94 – 2.30 stated in FHWA [11]. The specific gravity values of the various RAP +CW + RHA mixes show increased values with increased CW content and decreased RHA content in the mixes for a fixed percentage of RAP in the mixes and also decrease with decreased content of RAP in the mixes. The specific gravity values for the various RAP + CW + RHA mixes varies between 1.54 and 2.41
with a peak value of 2.41 recorded for 75% RAP + 25% CW mix while the least value of 1.54 was recorded for 75% RHA + 25% CW mix (see Table 3). The increased specific gravity of CW + RHA stabilized RAP may be attributed to fine particles of the CW and RHA filling the void spaces between the larger particles of RAP, leading to increased density of the soil matrix [10].
In Table 3, RLS14 (%) is the Resistance to loss in strength for mix samples cured under uniform moisture distribution (UMD) for 14-days., RLS7+7 (%) is the Resistance to loss in strength for mix samples
0
10
20
30
40
50
60
70
80
90
100
0.01
0.1
1
10
100
P
erc
ent
pa
ssi
ng
(%
)
Sieve size (mm)
25% RAP + 75% RHA
25% RAP + 75%(75% RHA + 25% CW)
25% RAP + 75%(50% RHA + 50% CW)
25% RAP + 75%(25% RHA + 75% CW)
25% RAP + 75% CW
100% RHA
75% RHA + 25% CW
50% RHA + 50% CW
25% RHA + 75% CW
cured under uniform moisture distribution (UMD) for 7-days and immersed in water for another 7-days and SG is the Specific Gravity.
3.4 Compaction Characteristics
Compaction of the samples were carried out using the British Standard heavy, BSH (modified Proctor, MP) compaction energy to obtain moisture – density relationships. The test results show a trend of increase in the maximum dry densities (MDD) of the CW + RHA stabilized RAP mixes with a corresponding decrease in the optimum moisture contents (OMC) as the CW content increased and the RHA content decreased in the CW + RHA mixes for any fixed RAP content. (see Table 3). The values of MDDs and OMCs for 100% RAP, 100% CW and 100% RHA were found to be; 1.57 Mg/m3 and 9.0 %, 1.11 Mg/m3 and 35.0 %, and 1.02 Mg/m3 and 42.3 %, respectively. For the various RAP + CW + RHA mixes, the MDD increase from 1.05 to 1.74 Mg/m3 with corresponding OMC values that decreased from 40.0 to 10.2 % for 75% RHA + 25% CW and 75% RAP + 25% CW, respectively. The reason deduced for the inverse trend between OMC and MDD of the mixture is that as the RHA content increased and the CW content decreased in the RAP + CW + RHA mixes, the surface area of particles increased due to higher RHA content, which require more water to lubricate the entire matrix of the mixture to complete the chemical process of hydration and cation exchange that leads to strength gain [27]. The increased MDD with a corresponding decrease in OMC of the mixtures at higher CW and RAP contents in the RAP + CW + RHA mixes may be attributed to insufficiency of water in the mixtures, resulting in self-desiccation and consequently lower hydration. It is known that if no water movement to and from CW paste is permitted, the reaction of hydration use up the water until too little is left to saturate the soil surfaces and the relative humidity within the paste decreases [27].
3.5 California Bearing Ratio
The various RAP + CW + RHA mixes shows that for a fixed RAP content in the mixes, the values of the unsoaked and soaked california bearing ratio (CBR) increased with increased CW and decreased RHA contents in the mixes while the CBR values decreased with decrease in RAP and increased CW + RHA contents in the mixes (see Table 3). The unsoaked and soaked CBR values for 100% RAP, 100% CW and 100% RHA are 41.0 and 31.0 %, 33.0 and 46.0 %, and 20.0 and 14.0 % respectively (see Table 3). The
variations of CBR with the various RAP + CW + RHA mixes are in the ranges; 19.0 – 62.0 % (Unsoaked) and 10 – 66 % (soaked). The peak unsoaked and soaked CBR values of 62.0 and 66.0 %, respectively, were recorded for 75% RAP + 25% CW, while the least unsoaked and soaked CBR values of 19.0 and 10.0 % were recorded for 75% RHA + 25% CW mixes respectively. The optimum CBR values of 62 (unsoaked) and 66 % (soaked for 24 hours) recorded for 75% RAP + 25% CW mix proportion satisfy the requirement for highway subbase material [16]. The variation in the CBR is more likely due to agglomeration of the heterogeneous materials of the CW + RHA stabilized RAP mixes [28] and the uniform distribution of the CW + RHA in the mixture [29]. The higher values of CBR for soaked compared to the unsoaked conditions may be due to pozzolanic strength gain attributed to complete chemical process of hydration and cation exchange, leading to the formation of calcium silicate hydrates and calcium aluminate hydrates [26] while the lower values of CBR for soaked compared to the unsoaked conditions may be attributed to the reaction between the hydrated lime with tricalcium aluminate and water to form tetracalcium aluminate hydrate which forms a protective coating on the surface of unhydrated grains of tricalcium aluminate, thus slowing down the rate of hydration of tricalcium aluminate to form the strength producing compound of tetracalcium aluminate hydrate [27].
3.6 Durability Characteristics
The results did not show any particular trend in the values of the RLS with the mixes. However, all the various RAP + CW + RHA mixes, except the100% RAP and 75% RAP + 25% RHA mixes, satisfy the durability requirement [30]. The lower RLS values for stabilized samples cured under UMD for 14 days as compared to samples cured under UMD for 7 days and immersed in water for another 7 days may be due to increased contact areas between the coarse aggregates of various content of RAP + CW + RHA mixes, leading to increased finer particles of the mix proportions [31] while the higher RLS values for stabilized samples when cured under UMD for 7 days and immersed in water for another 7 days as compared to the values for stabilized samples cured under UMD for 14-days is more likely due to agglomeration of the heterogeneous materials of the RAP + CW + RHA mixes [28] and the uniform distribution of the CW + RHA mixes in the mixture [29], facilitating cohesion and frictional resistance between the soil particles in contact and the pozzolanic strength gain due to complete chemical process of hydration of lime in the mixes [26], the main factors responsible for strength of soil.
3.7 Water Absorption Characteristics
The water absorption characteristics for 100% RAP, 100% CW, 100% RHA and the various RAP + CW + RHA mixes, compacted at their respective OMCs are also presented in Table 3.The results show that water absorption increased with decreased RAP and RHA contents, and increased CW content in the RAP + CW + RHA mixes.
The water absorption of 100% RAP, 100% CW, and 100% RHA are 2.06, 18.95 and 12.63 % respectively, while the values for the various RAP + CW + RHA mixes are in the range 3.84 – 17.44 %. The least value of 3.84 % was recorded for 75% RAP + 25% RHA mix while the highest value of 17.44 % was recorded for 25% RHA + 75% CW mix. The increased water absorption, resulting from higher CW content, may be attributed to the increased surface area of the particles in the mixture which require more water to lubricate the entire matrix of the mixture, facilitating the complete chemical process of hydration and cation exchange that leads to strength gain [27].The lower water absorption with increased RHA and RAP contents may however, be attributed to the lime content of the mixture requiring more water to lubricate the entire soil matrix, in order to enhance compaction, in addition to the water taken up by the CW + RHA hydration reaction [27,32].
4. CONCLUSIONS
Laboratory procedures have been used to assess the suitability of RAP +CW + RHA mixes as alternative highway pavement materials. The particle size distributions and specific gravity of RAP improved tremendously with the CW + RHA treatment.
The compaction characteristic was affected by the proportions of RAP + CW + RHA in the mixes. The MDD increased as the OMC decreased with increased CW content and decreased RHA at any fixed RAP content in the mixes.
The optimum CBR of 62.0 % (unsoaked) and 66.0 % (soaked) recorded for the 75% RAP + 25% CW mix, achieved with RLS of 84.1 % and maximum WA of 5.7 %, at its OMC, can be used as sub-base material in road construction. The optimum RAP + CW + RHA mix, is durable as highway construction material with insignificant water absorption.
Further work may be encouraged to assess resilient modulus of this material under cyclic load.
5. REFERENCES
[1] Joel, M. and Edeh, J. E. "Soil Modification and Stabilization Potential of Calcium Carbide Waste", Advanced Materials Research, Vol. 824, 2013, pp. 29-36, [2] Kadiri, F. and Eze, C. “Effects of Paddy Rice Production
on the Welfare of Farmers and the Determinants of the Achievements of Paddy Rice Farmers in Niger Delta Region of Nigeria”, Journal of Economics and Sustainable Development, Vol.6, Number 4, 2015, pp. 202-209, ISSN 2222-1700 (Paper) ISSN 2222-2855 (Online), (www.iiste.org)
[3] Fa-Zhi Zhang, Kato, T., Fuji, M. and Takahashi, M. “Gelcasting Fabrication of Porous Ceramics using a Continuous Process”, Journal of the European Ceramic Society, Vol. 26, Number 4, 2006, pp. 667-671. [4] Galassi, C. “Processing of Porous Ceramics: Piezoelectric
Materials”, Journal of the European Ceramic Society, Vol. 26, Issue 14, 2006, pp. 2951-2958, Published by Elsevier.
[5] Mishra, P., Chakraverty, A. and Banerjee, H.D. “Studies on Physical and Thermal Properties of Rice Husk Related to its Industrial Application”, Journal of Material Science, Vol. 21, 1986, pp.2129- 2132
[6] Gorthy, P. and Pudukottah G. M. “Production of Silicon Carbide from Rice Husks”, ChemInform Abstract: ChemInform, Vol. 30, Issue 36, 1999, pp. 1522-2667, Copyright © 1999 WILEY-VCH Verlag GmbH & Co.
KGaA, Weinheim,
http://dx.doi.org/10.1002/chin.199936018,no. doi:10.1002/chin.199936018.
[8] Abiya, S. E., Odiyi, B. O. and Salau, I. O. “Effect of calcium carbide waste on the growth and biomass of Okra (Abelmoschusesculentus l. Moench) “, IOSR Journal of Environmental Science, Toxicology and Food Technology (IOSR-JESTFT), e-ISSN: 2319-2402,p- ISSN: 2319-2399.Vol. 9, Issue 1, Ver. III, Jan. 2015, pp. 68-71 www.iosrjournals.org
[9] Federal Highway Administration, FHWA, User Guidelines for Byproducts and Secondary Use Materials
in Pavement
Construction.http://www.rmrc.unh.edu/tools/uguideli ne/rap133.asp.pdf, Accessed on July 15, 2008.
[10] Osinubi, K. J. and Edeh, J. E. “Reconstituted Coal Ash Stabilization of Reclaimed Asphalt Pavement,” Geo-Frontier 2011 on Advances in Geotechnical Engineering, Geotechnical Special Publication, J. Han and D. E. Alzamora, Eds., Vol. 211, ASCE Press, Reston, VA, 2011, pp. 1172–1181.
[11] Federal Highway Administration, FHWA, Pavement Recycling Executive Summary and Report. FHWA-SA-95-060, Washington, DC., 1995.
[12] Anouksak, T. and Direk, L. “Stabilisation of Reclaimed Asphalt Pavement using Foamed Asphalt”, Proceedings in the Technology and Innovation for Sustainable Development Conference (TISD 2006), Sponsored by Faculty of Engineering, KhonKaen Univ., Thailand, Jan. 25–26, 2006.
[13] Schroeder, R. L. (1994). “The Use of Recycled Materials in Highway Construction”, Federal Highway Admin., Vol. 58, Number 2, 1994.
[14] ASTM C702–98, “Standard Practice for Reducing Samples of Aggregate to Testing Size”, Annual Book of ASTM Standards, Vol. 04, Number 02, ASTM International, West Conshohocken, PA, pp. 1-4, 2003. [15] BS 1377, “Methods of Test for Soils; for Civil
Engineering Purposes”, Technical Information Services Department, CNL Technical Information Services, BSI Publications, 389 Chiswick High Road London W4 4AL, 1990..
[16] Federal Ministry of Works and Housings, FMW&H, Roads and Bridges, Nigerian General Specification, Federal Ministry of Works and Housings, Abuja, Nigeria, 1997, pp. 13–25.
[17] ASTM D6913–04, “Standard Test Methods for Particle-Size Distribution (Gradation) of Soils Using Sieve Analysis”, Annual Book of ASTM Standards, Vol. 04, Number 02, ASTM International, West Conshohocken, PA, pp. 1-34, 2009.
[18] ASTM D 4318–10, “Standard Test Methods for Liquid Limit, Plastic Limit, and Plasticity Index of Soils”, Annual Book of ASTM Standards, Vol. 04.02, ASTM International, West Conshohocken, PA, pp. 1-16, 1994. [19] Das, B. M. Principles of Geotechnical Engineering, 4th
ed., PWS, Boston, 1998.
[20] ASTM C127–07, “Standard Test Method for Density, Relative Density (Specific Gravity), and Absorption of
Coarse Aggregate”, Annual Book of ASTM Standards, Vol. 04.02, ASTM International, West Conshohocken, PA, pp. 1-6, 1994.
[21] ASTM D 698-07e1, “Standard Test Methods for Laboratory Compaction Characteristics of Soil Using Standard Effort (12 400 ft-lbf/ft3 (600 kN-m/m3))”, Annual Book of ASTM Standards, Vol. 04.02, ASTM International, West Conshohocken, PA, pp. 1-13, 1994. [22] ASTM D1883-99, Standard Test Method for CBR
(California Bearing Ratio) of Laboratory-Compacted Soils. Annual Book of ASTM Standards, Vol. 04.02, ASTM International, West Conshohocken, PA, pp. 1-9, 1994. [23] Head, K. H. Manual of Soil Laboratory Testing. Vol. 2,
Pentech Press Ltd., London. 1994.
[24] BS 812-112. “Methods of Determination of Aggregate Impact Value (AIV)”, Technical Information Services Department, CNL Technical Information Services, BSI Publications, 389 Chiswick High Road London W4 4AL, 1990.
[25] ASTM C618-92a, “Standard Specification for Fly Ash and Raw or Calcined Natural Pozzolan for Use as Mineral Admixture in Portland Cement Concrete”, Annual Book of ASTM Standards, Vol. 04.02, ASTM International, West Conshohocken, PA, pp. 1-3, 1994. [26] Little, D. N. Evaluation of Structural Properties of Lime
Stabilized Soils and Aggregates. Summary of Findings Prepared for National Lime Association, Vol. 1, Published by National Lime Association, Arlington, Virginia, USA, 1999.
[27] Osinubi, K. J. “Influence of Compaction Delay on the Properties of Cement Stabilized Lateritic Soil”, Journal of Engineering Research, Vol. 6, Number 1, 1998, pp. 13–25.
[28] Hatipoglu, B., Edil, T. B., and Benson, C. H. “Evaluation of Base Prepared from Rd. Surface Gravel Stabilized with Fly Ash,” Proceedings of GeoCongress 2008: Geotechnics of Waste Management and Remediation, New Orleans, LA, March 9–12, 2008, pp. 288-295. [29] Li, L., Benson, C. H., and Edil, T. B. “Properties of
Pavement Geomaterials Stabilized with Fly Ash”, World of Coal Ash (WOCA), Jointly sponsored by American Coal Ash Association, Aurora, Colorado and University of Kentucky Center for Applied Energy Research, Lexington, Kentucky, USA, May 4–7, 2009.
[30] Ola, S. A. “Need for estimated cement requirements for stabilization of laterite soil”, Transportation Engineering Journal, ASCE, Vol.100, Number 2, 1974, pp. 379-388.
[31] Osinubi, K. J., Edeh, J. E. and Agada, O. J. “Rice husk ash stabilization of reclaimed asphalt pavements.” Journal of ASTM International. Vol. 9, No. 1, 2012, JAI 103752. [32] Osula, D. O. A. “Evaluation of Admixture Stabilization