ISSN: 2349-4468 International Journal of Advances in Management, Economics and Entrepreneurship
Available online at:
www.ijamee.info
RESEARCH ARTICLE
Investment Behaviour and Satisfaction of Salaried Employees: A Study
with Reference to Selected Employees in Mangalore City)
Ishwara P*
Department of Commerce, Mangalore University, Mangala Gangaotri, Konaje, Karnataka, India.
*Corresponding Author: E-mail:[email protected]
Abstract
In this research paper an attempt has been made to study the behaviour and level of satisfaction toward various investment alternatives by salaried class employees. Man works to earn income to meet his own needs. Every man has unlimited wants and to satisfy these wants, he works continues for a long time. Income earning is the predominant and prime motive in everybody‟s life. Individuals normally take their own time to settle down in a job and to become successful investors. Though the prime objective of income earning is to pay for his demands, still income has got a different role to play. The desire to earn and save for future needs dominates the minds of the income earners. Further, there is no guarantee that surplus will result into savings. Financial markets are the backbone of an economic system and aids in the allocation of share capital across the productive sectors of the economy. This allocation of resources helps to sustain healthy climate for savings and investment. The financial system has to be more dynamic than the real system as it has to continuously respond to the needs of the economy to help it to achieve its goals. In the modern financial system there are so many investment avenues to choose from today in financial market and it has become difficult for anyone to decide about these avenues. Some of these investment avenues offer attractive returns but with high risks and some offer lower returns with very low risks. Hence, this research paper concentrates salaried class employees‟ behaviour and level of satisfaction towards financial, non- financial and physical assets.The study reveals that is identified that the majority (60%) of the respondents behave in a positive way while choosing their investments. It is found that majority of the respondents have less awareness about the marketable securities and only (4%) of the respondents have awareness about the marketable securities. In short, only limited numbers of respondents have complete knowledge about the marketable securities. It is observed that majority of the respondents do not have complete awareness about the all non-marketable securities. It is found that majority (96%) of the respondents have awareness about the physical assets.
Keywords: Investmentbehaviour, Financial assets, Salaried employees, Non-Marketable securities, Physical assets
Introduction
Savings and Investments are activities important and integral to men and women. Every individual has a tendency to save for various reasons. They may be for short term purposes like paying for a holding or for buying a car or they may be made for long term purposes such as constructing a house or providing for retirement. Sometimes savings are made simply to meet unknown contingencies. Apart from the above, there are two types of organization namely manufacturing industry and service industry, which are existing in our country to cater to the needs and wants of the people and which helps on the economic growth of the nation. Whatever may be the type of the organization, they need capital to carry their business activity. At the same time, the capital available is not sufficient to run their organization. Modern technology and growing expectations of the people call for a heavy dose of
intermediaries. If enough savings are accumulated, the next important thing is to invest them in constructive assets so as to generate further value. All savings are not an investment. Savings only become investment if a person makes decision to forego the use of the money saved for a period of time, in the hope of earning a return. At the same time, these investments do not always originate from savings. There are many people who sometimes quite unexpectedly receive lump sums which are surplus to their immediate requirement. This investment is more important than savings to create further value and achieve the economic development of individual and nation. Thus, prosperity of the economy is closely linked with the ability of the public to save and invest in productive assets for an uninterrupted supply of capital. To survive and develop in this competitive business world, capital must be made available at a reasonable rate without conditions attached to it.
Financial markets are the backbone of an economic system and aids in the allocation of share capital across the productive sectors of the economy. This allocation of resources helps to sustain healthy climate for savings and investment. The financial system has to be more dynamic than the real system as it has to continuously respond to the needs of the economy to help it to achieve its goals. In the modern financial system there are so many investment avenues to choose from today in financial market and it has become difficult for anyone to decide about these avenues. Some of these investment avenues offer attractive returns but with high risks and some offer lower returns with very low risks.
Statement of the Research Problem
Man works to earn income to meet his own needs. Every man has unlimited wants and to satisfy these wants, he works continues for a long time. Income earning is the predominant and prime motive in everybody‟s life. Individuals normally take their own time to settle down in a job and to become successful investors. Though the prime objective of income earning is to pay for his demands, still income has got a different role to play. The desire to earn and save for future needs dominates the minds of the income earners. Further, there is no guarantee that surplus will result into savings. Willingness to save is more important than capacity to save. It is true say that when there is willingness to save, the capacity to save can be created. Savings by itself do not provide any return. It merely provides safetyman would like to see that this savings yields some return. Further, he has reached a
stage where the rate of return decides the investments. In the Indian context, savings from all quarters are the need of the hour. Though 70 percent of our population lives in villages and mainly depends on agriculture, the savings from the agriculture sector is not enough due to uneconomic operations of the farms and same is the situation of public sector undertakings. Further, savings of businessmen and the self-employed are not stable and un- assured because it is subject to the condition of business. The salaried class has fixed sources of income and supplemented by additional income from other sources. The salaried class investors with assured monthly income could be regular savers. Various studies at micro level confirm the role of salaried class investors in providing the financial resources to the industrial sector. But the level of savings can be still being augmented from salaried class if the financial system is made more attractive to them. Keeping in view of the potential savings of salaried class investors, this study is promoted to understand the behaviour and to what extent salaried class employees satisfied towards various investment avenues.
Objectives of the Study
The primary objective of this paper is to study the investment behaviour and level of satisfaction towards financial, non-financial and physical assets of investment avenues among salaried employees working in different government offices in Mangalore City. The following are specific objectives of the study
To study investment behaviour of the salaried class employees
To measure and assess satisfaction level of salaried class employees towards various investment avenues.
To give some useful suggestions.
Research Methodology
This study is focusing on the behaviour and satisfaction of salaried class people and it will be helpful to identify the better investment options in the market. The study is based on primary and secondary data. Primary data have been collected from 100 respondents through a structured questionnaire covering salaried government employees in Mangalore City. A sample of 100 respondents was selected from Mangalore City using convenience-sampling technique. Out of the 100 respondents, 68 respondents working as a teaching professions, 12 are in managerial level,8
respondents coming under the
of satisfaction and behaviour of the respondents, Investors Satisfaction and Behaviour Inventory put to use. The respondents were asked to indicate their awareness toward marketable, non-marketable and physical assets.
Results and Discussions
Investment BehaviourIn order measure the investment behaviour of salaried class employees, Investment Behaviour
Inventory has been used. In this inventory there are 30 statements relating to investment decision, holding period, revision of investment, sources of funds, preference of return, motives for investment, and source of information. The respondents were asked to indicate their views and perception towards investment by indicating 1 to 5 scores. 1 for Strongly Disagree (SDA) and 5 for Strongly Agree (SA). Higher the scores indicates that positive sign in investment behiour.
Table1: Investment behaviour of salaried class employees
Behavior of the Investor SDA 1 DA 2 N 3 A 4 SA 5
I take decision on saving after
getting full information. 0 0 4(8%) 30(60%) 16(32%)
I consult my family members before
taking investment decision. 6(12%) 2(4%) 4(8%) 28(56%) 10(20%) I make my investment decision on
my own. 4(8%) 10(20%) 10(20%) 20(40%) 4(8%)
I make investment only at the end of
the year. 4(8%) 4(8%) 18(36%) 12(24%) 0
I prefer investment where there is
no loss in capital. 4(8%) 0 4(8%) 26(52%) 14(28%)
I review my investment decision
frequently. 0 10(20%) 6(12%) 28(56%) 4(8%)
I feel I am making good investment
decision. 0 2(4%) 22(44%) 14(28%) 10(20%)
I borrow money for making
investment. 4(8%) 14(28%) 6(12%) 16(32%) 0
Investment decision will have
impact on life style. 0 4(8%) 10(20%) 24(48%) 10(20%)
I prefer investment opportunities with potentially large return even if they are more risky.
4(8%) 22(44%) 10(20%) 8(16%) 4(8%)
I am getting good return because I
have taken calculated decision. 0 6(12%) 16(32%) 22(44%) 2(4%) Return is determined by external
and uncontrollable factors. 0 10(20%) 12(24%) 24(48%) 4(8%) Having the right investment is
important for being accepted. 0 6(12%) 14(28%) 24(48%) 4(8%) Publicity gives information and helps
us to take good investment decision. 0 2(4%) 6(12%) 28(56%) 12(24%) Publicity and agents are pushing me
to make investment. 0 4(8%) 10(20%) 28(56%) 6(12%)
I do save more as and when I get
extra income. 0 2(4%) 6(12%) 34(68%) 6(12%)
Increase in income is not helping to
increase investment. 4(8%) 22(44%) 10(20%) 8(16%) 2(4%) Saving will increase only when there
is an increase in stable permanent income.
0 8(16%) 10(20%) 22(44%) 8(16%)
I save more when the interest rate is
more. 2(4%) 12(24%) 8(16%) 20(40%) 6(12%)
I forgot my present consumption for
the purpose of future consumption. 6(12%) 14(28%) 14(28%) 10(20%) 2(4%) I forgot my present consumption for
the purpose of setting future return. 0 4(8%) 8(16%) 32(64%) 4(8%) Good investment opportunities
induce me for making investment. 2(4%) 4(8%) 14(28%) 20(40%) 6(12%) Technology provides me investment
over period of time.
I never withdraw my investment
before maturity. 2(4%) 12(24%) 6(12%) 22(44%) 4(8%)
I never indulged in any speculative
transactions. 2(4%) 8(16%) 8(16%) 22(44%) 8(16%)
I never put all money in a single
investment option. 4(8%) 2(4%) 16(32%) 24(48%) 2(4%)
I feel my investment decision should
not be criticized. 2(4%) 12(24%) 20(40%) 14(28%) 0
Once I decide about my investment option I will choose that option again and again.
6(12%) 14(28%) 12(24%) 6(12%)_ 4(8%)
The feel of thrill is essential while
making investment. 2(4%) 4(8%) 10(20%) 28(56%) 4(8%)
Source: Primary data
From the above table, it is clear that most of the respondents expressed their views positively towards investment activities.
Investment Satisfaction
Table 2: Level of satisfaction about the investments in marketable securities
Investment Avenues HS S N DS HDS
Financial Assets Marketable Securities
1.Corporate Bonds/Debentures 0 2(4%) 2(4%) 18(36%) 8(16%)
2.Public sector Bonds 0 6(12%) 2(4%) 16(32%) 8(16%)
3.Preference shares 0 0 2(4%) 6(12%) 22(44%)
4.Equity shares 0 2(4%) 24(8%) 24(48%) 10(20%)
Source: Primary data
From the above table, it is clear that out of 100 respondents, the majority of the respondents are not only less aware about the investment avenues
but also they are less satisfied about their investment in marketable securities.
Table 3: Level of satisfaction towards investment in non-marketable securities
Investment Avenues HS S NO DS HDS
Non-Marketable Securities
1.National Savings Scheme 4(8%) 0 2(4%) 16(32%) 12(24%)
2.National Savings Certificates 2(4%) 2(4%) 0 26(52%) 6(12%)
3.Provident Funds/Pension
Funds 10(20%) 0 0 28(56%) 8(16%)
4.Bank Deposits 0 0 4(8%) 28(56%) 14(28%)
5.NBFC Deposits 2(4%) 12(24%) 0 14(28%) 2(4%)
6.Post Office Savings Bank
Account 10(20%) 0 2(4%) 18(36%) 8(16%)
7.Corporate Fixed Deposits 0 0 0 16(32%) 16(32%)
8.Life Insurance Policies 6(12%) 0 2(4%) 12(24%) 20(40%)
9.Mutual Funds and Unit Trust
of India 0 10(20%) 0 18(36%) 12(24%)
10.Private Limited Companies
Shares 0 4(8%) 0 8(16%) 22(44%)
11.Chit Funds 0 6(12%) 24(48%) 6(12%) 0
12.Foreign Currency 0 8(16%) 22(44%) 2(4%) 2(4%)
13.Commodity Markets 0 4(8%) 24(48%) 2(4%) 0
Source: Primary data
It is found from the above table that out of 100 respondents,64% of them are lies below the average and 36% of them lies above the average in case of level of level of satisfaction about their investments in non- marketable securities.
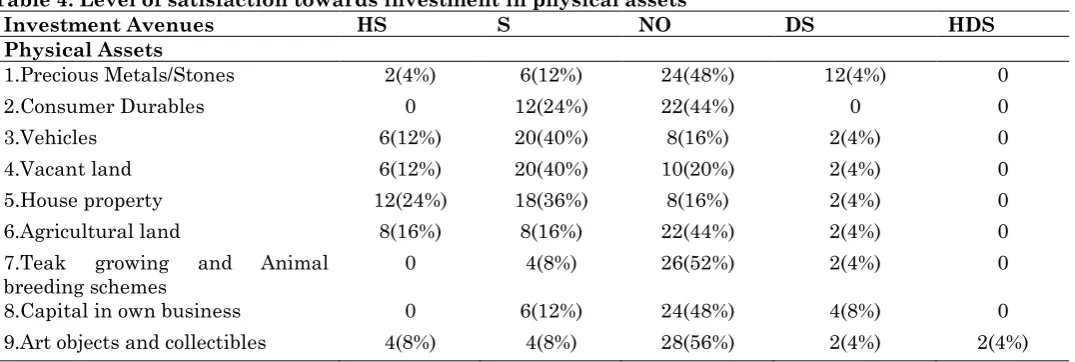
Table 4: Level of satisfaction towards investment in physical assets
Investment Avenues HS S NO DS HDS
Physical Assets
1.Precious Metals/Stones 2(4%) 6(12%) 24(48%) 12(4%) 0
2.Consumer Durables 0 12(24%) 22(44%) 0 0
3.Vehicles 6(12%) 20(40%) 8(16%) 2(4%) 0
4.Vacant land 6(12%) 20(40%) 10(20%) 2(4%) 0
5.House property 12(24%) 18(36%) 8(16%) 2(4%) 0
6.Agricultural land 8(16%) 8(16%) 22(44%) 2(4%) 0
7.Teak growing and Animal
breeding schemes 0 4(8%) 26(52%) 2(4%) 0
8.Capital in own business 0 6(12%) 24(48%) 4(8%) 0
9.Art objects and collectibles 4(8%) 4(8%) 28(56%) 2(4%) 2(4%) Source: Primary data
It is found from the above table that out of 100 respondents, 12% of them are lies below the average and 88% of them lie above the average in case of level satisfaction towards their investments in physical assets.
It concluded that the 88% of respondents are satisfactory on their investment and only 12% of respondents perceived and reported to have lower degree of „satisfaction on their investment in physical assets [1-3].
Major Findings
Majority of the respondents (40%) are in the age group of below 30 years and 36%of the respondents are in the age group of 30-40 years. It is found that 60% of the respondents are male
and the remaining female.
It is identified that 72% of the respondents are married and the remaining (28%) of the respondents are unmarried.
It is found that (60%) of the respondents are post-graduates.
It is observed that all the respondents are working in government sector.
It is observed that (68%) of the respondents are teachers and (12%) of the respondents are Managers.
It is identified that (44%) reside in urban areas and (32%) respondents reside in semi-urban areas.
It is found that respondents 28% belong to the family size of 4 members, (24%) belong to the family size of 5 members and rest of the respondents belong to the family size of 3 members.
It is observed that 36 % respondents are from families with single earning member and rest respondents are from a family of 2 earning members.
It is identified that the majority (60%) of the respondents behave in a positive way while choosing their investments.
It is clear that most of the respondents expressed their views positively towards investment activities.
They are less satisfied about their investment in marketable securities.
It concluded that the 36% of respondents are satisfied on their investment in non- marketable securities and 64% of respondents‟ satisfaction is poor.
It found that majority of the respondents satisfied towards their investment in physical assets.
Suggestions
Based on the study, the following suggestions are offered:
Investment procedures must be clear and simple to attract more investors.
Financial Institutions must organise some “financial literacy campaign” as many people still unaware about the marketable and non-marketable securities.
Financial Institutions have to provide better facilities to the investors as many people are not satisfied with their investments in marketable and non- marketable securities.
The financial institutions should enhance the quality of service and more personalized service should be given to investors to build trust and long run relationship.
References
1. Dhivya. R, Shekar C (2010) Investor‟s preference towards financial investments. Indian Journal of Finance, 138:39-42.
2. Cheng Li (2010) Savings, Investment and Capital mobility within China. china economic Review, 21(1):14-23.