867
Available online at http://ijdea.srbiau.ac.ir
Int. J. Data Envelopment Analysis (ISSN 2345-458X)
Vol.3, No.4, Year 2015 Article ID IJDEA-00346, 7 pages
Research Article
Estimating Most Productive Scale Size with Double
Frontiers in Data Envelopment Analysis using
Negative Data
Fereshteh Roozbeh
a, Robabeh Eslami
a*, Mahnaz Ahadzadeh Namin
b(a) Department of Mathematics, South Tehran Branch, Islamic Azad University, Tehran, Iran.
(b) Department of Mathematics, Shahr-e-Qods Branch, Islamic Azad University, Tehran, Iran.
Received 19 November 2015, Revised 10 February 2016, Accepted 21 May 2016
Abstract
In this paper, it is assumed that the “Decision Making Units“(𝐷𝑀𝑈𝑠) are consist of positive and negative input and output. Firstly, the optimistic and pessimistic models have been suggested by using negative data and then units with most productive scale size are measured in optimistic and pessimistic models. These productive values are compared with double frontiers and Hurwicz’s Criterion to obtain DMU with MPSS.
Keywords
:
Data envelopment analysis; Most Productive Scale Size; Optimistic efficiency; Pessimistic efficiency; double frontiers; Negative data .*
Corresponding Author: [email protected]
868 One of the most common
DEA
models is theCCR model, which was initially proposed by Charnes, Cooper and Rhodes [1], in 1978 to measure the efficiency of a set of DMUs.This
model is the extension of Farrel measure used for multiple inputs and outputs and it deals with the calculation of radial efficiency in PPS under Constant returns to scale (CRS) and it has two characteristics of input orientation (envelopment form), and output orientation (multiplier form), that all the input and output values are non negative, whereas in many applications, the negative inputs and outputs could be appear as loss when the net profit is an output variable. Later on, various approaches presented which have the way for using negative data in this model and other models like the Semi-Oriented measurement. The DEA was presented based on the need for scientific method to analyze economic unit’s performance. Therefore, returns to scale (
RTS
) as an economical concept could be evaluated under DEA models. Indeed, returns to scale is related to the economical interpretation of the efficiencies ofDEA. Returns to scale is the effect of means of production over production and has three type of “increasing”, “decreasing” and “constant”. In special case, if a DMU has a Constant returns to scale (CRS) – when any multi of inputs, Produce the same multi of outputs, than the DMU in this state, has the highest MPSS which represent a very important in DEA and connected with theRTS. TheDEA by Banker (1984). Later, Cooper et al. (1996) provided a fractional objective function model for determining theMPSS. Jahanshahloo and Khodabakhshi (2003) proposed an input-output orientation model for estimating the MPSS with a linear objective function. Banker et al. (2004) reviewed of the development of MPSS as one part of the literature review of RTS. Khodabakhshi (2009) discussed the estimation of the MPSS when the stochastic data are obtained (see [7]). However, all the papers about the MPSS in DEA are based on the optimistic point of view. Since the performances of decision making units ( DMUs) can also be measured from the pessimistic point of view (see [5]). Since, the results of MPSS application in different evaluation system might give different results, hence by applying Double Frontiers and Hurwicz’s Criterion, the performance of each unit is assessed in both optimistic and pessimistic point of view (see [3], [4]).
The purpose of this paper is to study the MPSS with double frontiers data envelopment analysis by using negative data.
2. Data Envelopment Analysis using negative
data
Suppose we have
j
1,...,
n
, DMUs as,
X Yj, j
, where Xj
x1j,x2j,...,xmj
is avector of observed inputs and
1 , 2 ,...,
j j j sj
Y y y y is a vector of observed
F. Roozbeh, et al /IJDEA Vol.3, No.4, (2015). 867-873 869 * 1 1 1 1 2 2 1 1 1 1 1 2 2 1 . . ; ; (2) ; ; ; ;
0 ; 1,...,
o n
j ij io j
n
j ij ko j
n
j ij ko j
n
j rj ro j
n
j rj to j
n
j rj ro j
j Max
s t x x i I x x k K x x k K y y r R y y t T y y t T
j n
efficiency comparisons is assumed to haveused the same inputs and produced the same outputs (see [2]). Suppose, without disturbing the generality of the problem:
{ / ij 0; 1,..., }
I i x i n
s
DMU and negative for others} k= {i/ xij
can takes positive values for some when
I
K
And I K {1, 2,..., }m And suppose:{ / rj 0; 1,..., }
R r y j n
T={r/ yrj can takes positive values for some
s
DMU and negative for others} when
R
T
AndR
T
{1, 2,..., }
r
Let us define
x
kj
x
1kj
x
kj2 for kK when there inx
1kj
0
andx
kj2
0
for allj
1,...,
n
and1 0
0 0
kj kj
kj
kj
x if x x
if x
&
2 0 0
0 kj kj kj kj if x x
x if x
And
y
tj
y
1tj
y
tj2 for tT when there in1
0
tj
y
andy
tj2
0
for all j1,...,n and1 0
0 0
tj tj tj
tj
y if y y
if y
&
2 0 0
0 tj tj tj tj if y y
y if y
Now the CCR model under evaluations as
o
DMU with semi positive and negative inputs and outputs which has been defined by Emrouznejad et al., [2] is presented as follows:
(1)
3. Estimating Most Productive Scale Size
with Double Frontiers in Data Envelopment
Analysis using negative data
3.1. We name model (1) as CCR optimistic
model under evaluation as DMUowith semi positive and negative inputs and outputs. And in pessimistic CCR model under evaluation as DMUo with semi positive and negative inputs and outputs as follows:
(2) * 1 1 1 1 2 2 1 1 1 1 1 2 2 1
. . ; (1)
;
;
;
;
; 0 ; 1,...,
o n
j ij io j
n
j ij ko j
n
j ij ko j
n
j rj ro j
n
j rj to j
n
j rj ro j
j
Min
s t x x i I
x x k K
x x k K
y y r R
y y t T y y t T
870
Definition 1: If
o* in the model (1), is equal to one, then DMUo is MPSS in themeasurement of optimistic model.
Definition 2: If
*j is the optimal solution to model (2) under evaluation DMUj(1,...,
j
n
) and
h*
Max
{
*j/
j
}
, thenh
DMU is called MPSS in the pessimistic measurement.
Definition 3: The double frontiers approach,
consider two efficiency frontier for decision making units, that one of them is efficiency frontier corresponding the best or optimistic efficiency and the other, is inefficiency frontier that is defined as an input frontier. This frontier represents the worst efficiency or pessimistic efficiency.
The common measurement ofDEA, only consider relative efficiencies one single group ofDMU, while the pessimistic efficiencies were neglected in those approaches. In fact, if we suppose relative optimistic and pessimistic efficiencies simultaneously, then all decision making units could be classified without any more need in calculations and manager’s knowledge of himself in giving priority. On the other side, the optimistic and pessimistic from various view point ends to two types of Rankings for units. Therefore, we need to have a general measurement performance to achieve a comprehensive Ranking. The application of a geometric mean can be considered as one of these methods which were introduced by
Wang et al. (2007). The obtained efficiency defines a set of efficient units which these units have a better relative efficiency while the obtained inefficiency defines a set of units which have relative more weak performance. Hence, usually the best decision making units could be selected among the set of efficient units.
3.2. Hurwicz’s decision rule
The Hurwicz’s rule is a procedure applied within the decision making process under uncertainty (DMUU). This uncertainty is a consequence of the fact that it is not able to anticipate the future effectively. One may just forecast various phenomena and events, but in many cases it is extremely difficult to estimate the exact value of particular parameters (temperature, company profit, size of the mature crops, demand for a product, product prices, production costs etc.). If these data were known, it would be easy to indicate the best alternative (decision), e.g. the best investment strategy. But when many future factors are not deterministic at the time of the decision, the decision maker (DM ) has to choose the appropriate alternative on the basis of some scenarios (states of nature, events) predicted by experts, him or herself (Hurwicz 1951) (see [6]).
Hurwicz’s criterion method is an optimistic and pessimistic method that this procedure usually leads to reasonable answers. Hurwicz
F. Roozbeh, et al /IJDEA Vol.3, No.4, (2015). 867-873
871 weighted average of the security and the optimism levels (Ij;j1,...,n).
Now Hurwicz’s criterion hj express as
follows:
(1 ) ,
j j j
h
w
m jWhere hj is the Hurwicz’s criterion and
is the coefficient of pessimism which fulfills the following condition:
[0, 1], the parameter
is close to 0 for extreme optimists. Also wj and mj are the worst and the best values results could be appeared, respectively.The most well-known Hurwicz’s criterion, suggested by Hurwicz (1951), selects the minimum and the maximum payoff to each given actx, and then associates to each act to attain the following index of any two acts:
max( ) (1
x
) min( )
x
The one with the maximum index would be preferred.
In the Hurwicz’s criterion, the parameter
, which reflects the degree of the decision maker’s optimism, is determined by the decision maker. Since different decision makers have different criteria, it is difficult to determine the appropriate value of
. By varying the value of
, the Hurwicz’s criterion becomes various decision rules, e.g., when
=0, it comes out the pessimistic criterion; when
=1, the criterion becomes the optimistic criterion. In fact there is many Hurwicz’s criterion. (Hurwicz, 1951, 1952).In this paper in order to take both advantages of the two measurements, we employ the Hurwicz’s criterion for determining the final efficiency of allDMUs.
3.3. A double frontiers measurement
Since the optimistic efficiency measurement and the pessimistic efficiency measurement are two different decision making criteria. As different measurements reflect different information on different frontiers, any measurement which considered only one of them is biased. This may lead us to think that the two measurements should be considered together for identifying the best
DMU
which represents theMPSS
. Based on this idea, the following part is to construct a double frontiers approach for examining theMPSS
.Wang and Chin (2007), Wang and Lan (2011) used geometric method to combine both information on optimistic frontier and pessimistic frontier. Then Wang and Chin (2009) proposed a new method to obtain a double frontiers approach.
Using the Hurwicz’s criterion to integrate the optimistic and the pessimistic efficiency measurements, it has obtained standardized synthesis efficiency as follows:
(1
)
;
[0,1]
pes
j opt
j pes j
j
Max
Where
jpes stands for pessimistic efficiency872 model optimistic CCR and
j stands for the standardized synthesis efficiency of the double frontiers approach of the DMUj.4. Numerical example
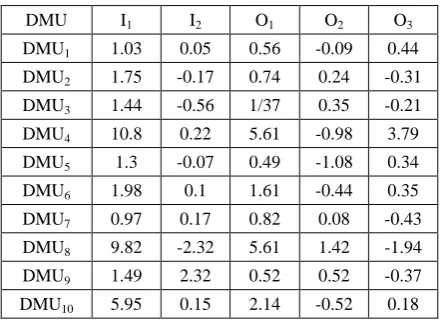
In this example, we make a comparison with 10 DMUs,where there are one positive input
(cost), one non-positive input ( effluent ), one positive output (saleable output) and two non-positive outputs ( methane and co2) that the
data set of “the notional effluent processing system” extracted from Sharp et al (2006).
Table 1: Notional effluent processing system O3 O2 O1 I2 I1 DMU 0.44 -0.09 0.56 0.05 1.03 DMU1 -0.31 0.24 0.74 -0.17 1.75 DMU2 -0.21 0.35 1/37 -0.56 1.44 DMU3 3.79 -0.98 5.61 0.22 10.8 DMU4 0.34 -1.08 0.49 -0.07 1.3 DMU5 0.35 -0.44 1.61 0.1 1.98 DMU6 -0.43 0.08 0.82 0.17 0.97 DMU7 -1.94 1.42 5.61 -2.32 9.82 DMU8 -0.37 0.52 0.52 2.32 1.49 DMU9 0.18 -0.52 2.14 0.15 5.95 DMU10
Table 2: Three different measurements and the MPSS Double frontiers Efficiency MPSS CCR-RB Pessimistic Efficiency MPSS CCR-R Optimistic Efficiency MPSS DMU 0.762987 1
1 MPSS DMU1
0.5141072 1
0.56242 DMU2
1 MPSS 1.90849 MPSS
1 MPSS DMU3
0.878375 1.44425
1 MPSS DMU4
0.761987 1
1 MPSS DMU5
0.761987 1
1 MPSS DMU6 0.706262 1 0.888555 DMU7 0.598633 1.13895 0.60047 DMU8 0.761987 1
1 MPS DMU9
0.578377 1
0.63278 DMU10
The results achieved in table No.2, shows that from optimistic view point, the “DMU3” has a
efficiency value equal to one, and at the same time from pessimistic viewpoint it is a MPSS (because it has the maximum efficiency value among other decision making units) and in double frontiers approach, it has the highest efficiency among the other DMUs.
5. Conclusions and Future extension
In this paper, it has been estimated the MPSS by using the pessimistic and optimistic CCR model and a double frontiers approach with negative inputs and outputs.
F. Roozbeh, et al /IJDEA Vol.3, No.4, (2015). 867-873
873
References
[1] Banker, R.D.,
1984
a
. Estimating most productive scale size using Data envelopment analysis. European Journal of Operational Research,17,35 44.[2] Emrouznejad, A., Anouze, A.L., Thanassoulis, E., 2009. Interfaces with other Disciplines: A semi-oriented radial measure for measuring the efficiency of decision Making units with negative data, using DEA.
European Journal of Operational Research
200(2010), 297-304
[3] Hurwicz, L.,
1951
. Optimality Criteria for Decision Making Under Ignorance. Cowles Commission Discussion Paper, Chicago, p.370
.[4] Hurwicz, L.,
1952
. A Criterion for Decision Making Under Uncertainty. Technical Report 355 . Cowles Commission. [5] Wang, Y.M. Chin, ks ., Yang, JB. 2007. Measuring the performances of decision- Making units using geometric average efficiency. Journal of the operational Research Society, 58,929-937.[6] Gaspars-wieloch , Helena., 2013. Modifications of the Hurwitz’s decision rule. Pozan University of Economics, al. Niepodeglosci 10, 61-875 Pozan, Poland. [7] Wang, Y.M., Lan, Y.X., 2013. Estimating most Productive Scale Size with double Frontiers data envelopment analysis.