ISSN-L: 2501 - 1235 Available on-line at: www.oapub.org/edu
doi: 10.5281/zenodo.1443211 Volume 4 │ Issue 11 │ 2018
A COMPARATIVE STUDY OF MENTAL TOUGHNESS
BETWEEN INDIVIDUAL GAME AND TEAM GAME PLAYERS
Elroy Pintoi Goa Multi-Faculty College, Dharbandora, Goa, 403406, India
Abstract:
The purpose of this study was to compare the Mental Toughness between Individual Game and Team Game players. For the purpose of this study a total of 120 subjects (N=120) were chosen, Individual Game (n=60) and Team Game (n=60). The subjects were chosen using Quota sampling technique. Mental Toughness was measured using Dr. Alan Goldberg Questionnaire (1998) which consisted of thirty questions measuring five attributes namely Reboundability, Pressure Handling Ability, Concentration, Confidence and Motivation. Independent sample ‘t’ test was used to compare the Mental Toughness between Individual Game and Team Game players. The results showed that there is a significant difference between Team Game Players and Individual Game players in terms of Reboundability, Pressure Handling and Overall Mental Toughness with Team Game players scoring higher in all three attributes. Whereas there was no significant difference in terms of Concentration, Confidence and Motivation but Team Game players scored higher in motivation and Individual Game players scored higher in concentration, whereas both groups had the same score for confidence. The higher Mental Toughness of Team Game Players compared to Individual Game players can be attributed to the team Game settings associated with team games wherein the players continuously receive support from other members of the team.
Keywords: mental toughness; reboundability; concentration; confidence; pressure handling ability; motivation; team game; individual game
1. Introduction
Sport is becoming an integral part of human life. From very simple beginning, it has now become highly organized activity of human society. The success and failure of an athlete is dependent on the combination of physical ability, conditioning, training, mental preparation and the ability to perform well under pressure. Competitive sports
demand a high level physical ability, and at the same time, they require a sharp mental focus. In a world where many athletes are physically, technically and tactically increasingly similar, it is the mind which offers perhaps the greatest scope for a competitive advantage. In today’s competitive world, it is very difficult to stay mentally tough and perform under tremendous pressure. More physical and mental energy is needed and for this, it is essential to be mentally tough hence, mental toughness is on high demand. Player are subject to performance evaluation by coaches, manager, fellow team-mates, spectators, press and media which occur before, during and post-performance. Player are expected to make a split second judgment and accurate movement or reaction to the opponent’s move, often under immense pressure and tough situation, which can have far reaching effects with games at all levels. It is essential to be aware of the importance of sport psychology to assist athletes to perform sport skills better. There are also variety of factors in sport disciplines and competition in terms of the type of sports because athletes experience specific psychological behaviors. The demands in team sports are different from that of individual sports. The nature of sports makes an individual to behave in a certain manner. In group sports like football, basketball, handball and others the nature of these sports causes the athletes to commit many fouls during competition, as a result they experience negative emotion and show problematic behaviour. In contrast, in individual sports, athletes depend on to their individual abilities. In individual sports, performance criteria is one dimensional while in group sports performance depends on the teammates performance. In team sports, athletes are involved with teammates and spend a lot of time practicing with teammates and have more interaction with one another, in contrast in individual sports athletes spend a lot of time alone in practicing .In some of individual sports athlete have more time for mental skills practice and they do so in a quiet environment while distraction and loss of concentration are part of the team sports. In individual sports, the outcome is either winning or losing and there isn’t tie, but in team sports all three results are possible.
1.1 Mental toughness
toughness is imperative for peak sport performance. Gould, Hodge, Peterson, and Petlichkoff (1987), Gould, Eklund, and Jackson (1993a), Williams (1998), and Gould, Dieffenbach, and Moffett (2002), all state that mental toughness is an important psychological characteristic of sport performance.
2.Methodology
2.1 Method
For the present study, descriptive comparative method was used. It was used to assess the mental toughness of Individual Game and Team Game players and to compare between the two groups.
2.2 Sampling Technique
For the present study, the researcher used Quota sampling technique to select the sample from the population because the entire population for the study was not known. The Quota sampling was used so as to ensure that both contact game and non-contact game players are included in the study.
2.3 Population
All the players that have represented their state and who fall in the age group of 19 to 22 years. Also the players were expected to have at least 3 years playing experience.
2.4Sample
From the population 120 subjects were chosen for the present study. Individual Game 60 players and Team Game 60 players. The subjects were selected as given in the table below.
Table 1: Distribution of Sample
Individual Game Team Game
Contact Game Non-Contact Game Contact Game Non-Contact Game
Boxing Wrestling Badminton Shooting Football Hockey Cricket Volleyball
15 15 15 15 15 15 15 15
2.5 Tools used for data collection
highlights that particular area as a mental weakness that needs to be addressed. A score of 26-30 indicates strength in overall mental toughness. Scores of 23-25 indicates average to moderate skill in mental toughness. Scores of 22 or below mean that you need to start putting more time into the mental training area.
2.6 Procedure
To enhance the cooperation of the subjects the researcher personally met the subjects, explained the purpose of investigation and gave a clear instruction regarding the method for answering the questions. The researcher distributed the questionnaire booklet for marking the responses. The researcher in person in a face to face relationship administered the entire questionnaire. The subjects went through the instructions, read each statement carefully and indicated their responses. All the filled in questionnaires were collected from the subjects and scoring was done according to the scoring key. Usually an individual took 5 to 10 minutes in completing the test.
2.7 Statistical tools
To evaluate the score of mental toughness descriptive statistics were used. The ‚independent sample t test‛ was applied to find out the significant differences between Individual Game and Team Game players. To test the hypotheses, the level of significance was set at 0.05.
3. Results
Table 2: Descriptive statistic of Reboundability between Individual Game and Team Game Players
Game Type N Mean Std. Deviation Std. Error Mean
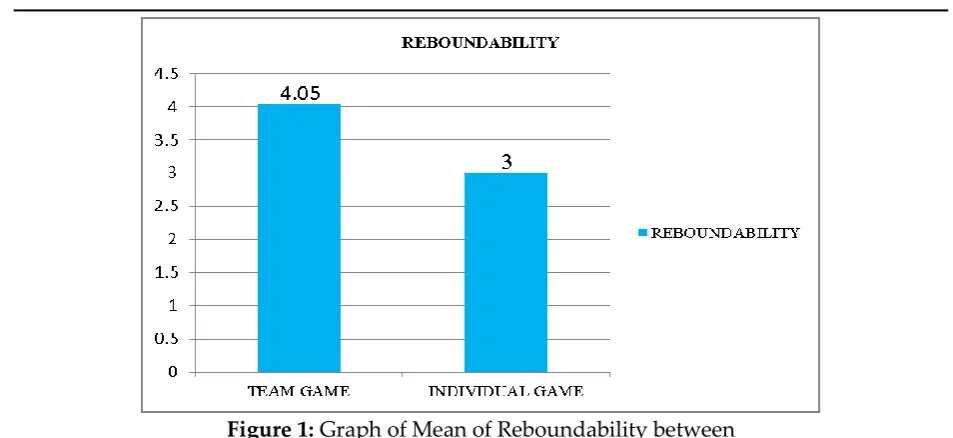
Reboundability Individual 60 3.00 1.008 .130
Team 60 4.05 1.111 .143
Figure 1: Graph of Mean of Reboundability between Individual Game and Team Game Players
The above graph shows the Mean of Reboundability of Individual Game and Team Game players. It can be seen that the mean score of Team Game players is 4.05 which is higher than Individual Game players who have a mean score of 3.
Table 3: Descriptive statistic of Pressure Handling between Individual Game and Team Game Players
Game Type N Mean Std. Deviation Std. Error Mean
Pressure Handling Individual 60 4.18 .965 .125
Team 60 4.28 1.027 .133
Table 3 shows the descriptive statistics of Pressure Handling of Individual Game and Team Game Players. Team Game players possess higher level of Pressure Handling ability than Individual Game players.
Figure 2: Graph of Mean of Pressure Handling between
The above graph shows the Mean of Pressure Handling of Individual Game and Team Game players. It can be seen that the mean score of Team Game players is 4.28 which is higher than Individual Game players who have a mean score of 4.08.
Table 4: Descriptive statistic of Concentration between Individual Game and Team Game Players
Game Type N Mean Std. Deviation Std. Error Mean
Concentration Individual 60 4.33 1.003 .129
Team 60 4.12 1.075 .139
Table 4 shows the descriptive statistics of Pressure Handling of Individual Game and Team Game Players. Individual Game players show higher level of Concentration than Team Game players.
Figure 3: Graph of Mean of Concentration between
Individual Game and Team Game Players
The above graph shows the Mean of Concentration of Individual Game and Team Game players. It can be seen that the mean score of Team Game players is 4.12 which is lower than Individual Game players who have a mean score of 4.33.
Table 5: Descriptive statistic of Confidence between Individual Game and Team Game Players
Game Type N Mean Std. Deviation Std. Error Mean
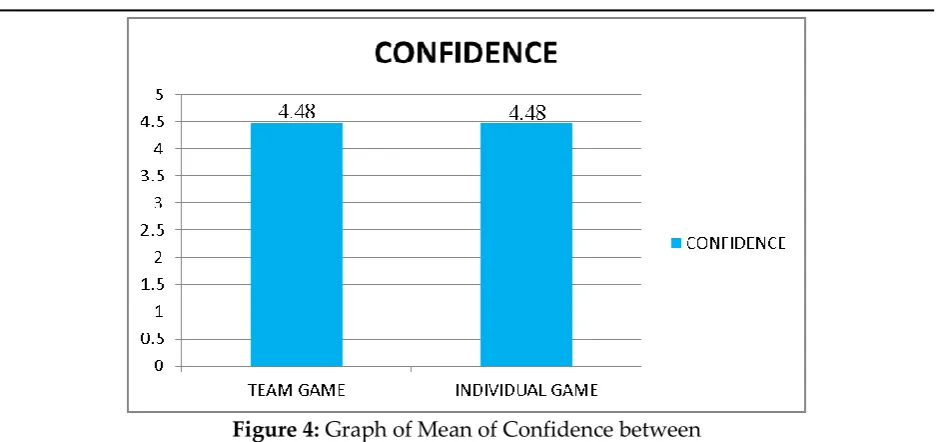
Confidence Individual 60 4.48 .930 .120
Team 60 4.48 1.017 .131
Figure 4: Graph of Mean of Confidence between Individual Game and Team Game Players
The above graph shows the Mean of Confidence of Individual Game and Team Game players. It can be seen that the mean score of Team Game players is 4.48 which is same as Individual Game players who have a mean score of 4.48.
Table 6: Descriptive statistic of Motivation between Individual Game and Team Game Players
Game Type N Mean Std. Deviation Std. Error Mean
Motivation Individual 60 4.57 .963 .124
Team 60 4.98 .813 .105
Table 6 shows the descriptive statistics of Pressure Handling of Individual Game and Team Game Players. Team Game players possess higher level of Motivation than Individual Game players.
Figure 5: Graph of Mean of Motivation between
The above graph shows the Mean of Motivation of Individual Game and Team Game players. It can be seen that the mean score of Team Game players is 4.98 which is higher than Individual Game players who have a mean score of 4.57.
Table 7: Descriptive statistic of Mental Toughness between Individual Game andTeam Game Players
Game Type N Mean Std. Deviation Std. Error Mean
Mental toughness Individual 60 20.57 1.798 .232
Team 60 21.92 2.102 .271
Table 7 shows the descriptive statistics of Overall Mental Toughness of Individual Game and Team Game Players. Team Game players possess higher level of Mental Toughness than Individual Game players.
Figure 6: Graph of Mean of Mental Toughness between
Individual Game and Team Game Players
The above graph shows the Mean of Mental Toughness of Individual Game and Team Game players. It can be seen that the mean score of Team Game players is 21.92 which is higher than Individual Game players who have a mean score of 20.57.
3.1 Testing of Hypothesis
Table 8: Comparison of Reboundability between
Individual Game and Team Game Players
F Sig. t df Sig.
(2-tailed)
Mean Difference
Std. Error Difference
Reboundability
Equal variances assumed
.636 .427 -5.420 118 .001 -1.050 .194
Equal variances not assumed
Table 8 shows the statistical analysis for Reboundability using independent sample t test. Since the significant value is greater than 0.05 equal variance is assumed. The calculated t value (-5.420) for df 118 shows that there is a significant difference in Reboundability between Individual Game and Team Game players at 0.05 significance level (p=.001). Hence the null hypothesis is rejected the research hypothesis is accepted.
Table 9: Comparison of Pressure Handling between
Individual Game and Team Game Players
F Sig. t df Sig.
(2-tailed) Mean Difference Std. Error Difference Pressure Handling Equal variances
assumed .321 .572 -.550 118 .584 -.100 .182 Equal variances
not assumed -.550 117.556 .584 -.100 .182
Table 9 shows the statistical analysis for Pressure Handling using independent sample t test. Since the significant value is greater than 0.05 equal variance is assumed. The calculated t value (-.550) for df 118 shows that there is no significant difference in Pressure handling ability between Individual Game and Team Game players at 0.05 significance level (p=.584). Hence the null hypothesis failed to be rejected and research hypothesis is rejected.
Table 10: Comparison of Concentration between
Individual Game and Team Game Players
F Sig. t df Sig.
(2-tailed) Mean Difference Std. Error Difference Concentration Equal variances
assumed .000 .996 1.142 118 .256 .217 .190 Equal variances
not assumed 1.142 117.434 .256 .217 .190
Table 10 shows the statistical analysis for Concentration using independent sample t test. Since the significant value is greater than 0.05 equal variance is assumed. The calculated t value (1.142) for df 118 shows that there is no significant difference in Concentration between Individual Game and Team Game players at 0.05 significance level (p=.256). Hence, the null hypothesis failed to be rejected and research hypothesis is rejected.
Table 11: Comparison of Confidence between
Individual Game and Team Game Players
F Sig. t df Sig.
(2-tailed) Mean Difference Std. Error Difference Confidence Equal variances
assumed .830 .364 .000 118 1.000 .000 .178 Equal variances
Table 11 shows the statistical analysis for Confidence using independent sample t test. Since the significant value is greater than 0.05 equal variance is assumed. The calculated t value (0.000) for df 118 shows that there is no significant difference in Confidence between Individual Game and Team Game players at 0.05 significance level (p=1.000). Hence, the null hypothesis failed to be rejected and research hypothesis is rejected.
Table 12: Comparison of Motivation between
Individual Game and Team Game Players
F Sig. t df Sig.
(2-tailed) Mean Difference Std. Error Difference Motivation Equal variances
assumed 6.269 .014 -2.561 118 .012 -.417 .163 Equal variances
not assumed -2.561 114.759 .012 -.417 .163
Table 12 shows the statistical analysis for Motivation using independent sample t test. Since the significant value is greater than 0.05 equal variance is assumed. The calculated t value (-2.561) for df 118 shows that there is a significant difference in Motivation between Individual Game and Team Game players at 0.05 significance level (p=0.012). Hence, the null hypothesis rejected and research hypothesis is accepted.
Table 13: Comparison of Mental Toughness between
Individual Game and Team Game Players
F Sig. t df Sig.
(2-tailed) Mean Difference Std. Error Difference Mental Toughness Equal variances
assumed 2.473 .119 -3.781 118 .001 -1.350 .357 Equal variances
not assumed -3.781 115.2
40 .001 -1.350 .357
Table 13 shows the statistical analysis for Mental Toughness using independent sample t test. Since the significant value is greater than 0.05 equal variance is assumed. The calculated t value (-3.781) for df 118 shows that there is a significant difference in Motivation between Individual Game and Team Game players at 0.05 significance level (p=0.001). Hence, the null hypothesis rejected and research hypothesis is accepted.
4.Discussion
attributes. Whereas there is no significant difference between Individual Game and Team Game players when it comes to Pressure Handling, Concentration and Confidence.
5.Conclusion
From the findings of the study, we can conclude that there is a significant difference in Mental Toughness between Individual Game and Team Game players wherein Team Game players possess a higher level of Mental Toughness. Also, there is a significant difference between Individual Game and Team Game players in terms of two attributes of mental toughness which are Reboundability and motivation with Team Game players attaining higher scores in both. The literature says that in Team Games athletes are involved with teammates and spend a lot of time practicing with teammates and have more interaction with one another hence the better Reboundability, Motivation and Pressure Handling ability can be attributed to this particular fact wherein the teammates motivate each other and also help them to come out of setbacks. From literature, it can also be observed that in individual sports, the outcome is either winning or losing and there isn’t tie, but in team sports, all three results are possible hence, there is less pressure on the Team Game players so we can conclude that the better pressure handling ability of Team Game players is due to this fact. Some of individual sports athlete have more time for mental skills practice and they do so in a quiet environment while distraction and loss of concentration are part of the team sports, therefore we can conclude that higher concentration of Individual Game players because of this particular reason. Finally, we can conclude by saying that as the Team Game players scored high in most of the attributes of Mental Toughness and the Team Game settings influence better Mental Toughness of individuals hence in this study we can see that the Mental Toughness of Team Game players is higher. Also as (Bull et. al., 2005) observed on the basis of research that there is also the potential for difference in mental toughness from one sports and event to the other we can see that in this research the researcher has found a significant difference in Mental Toughness between Individual Game and Team Game players.
References
Asamoah, B., (2013): The role of mental toughness, psychological skills and team cohesion in soccer performance.
Balaji, P., et. al.: Mental Toughness Differentials Among Cricket Players at Different Age Groups, Recent Research in Science and Technology, 2011, vol. 3, no. 6, 54-56.
Beck, N, M., (2012): Mental toughness: an analysis of sex, race, and mood.
Bull, Shambrook, James, & Brooks. (2005): Towards an understanding of Mental Toughness in high school boys' basketball Connole, Ian ProQuest Dissertations and Thesis; 2010.
Clough, P., Earle, K., & Sewell, D. (2002): Mental Toughness: The concept and its measurement. In I. Cockerill (Ed.), Solutions in sport psychology (pp. 32-45). London: Thomson.
Connole, I., (2009): Towards an understanding of mental toughness in high school boys' basketball.
Creasy, J. W., (2005): An Analysis of the Components of Mental Toughness in Sport. Golby, J. et. al., (2003): Mental toughness and hardiness at different levels of rugby
league, Personality and Individual Differences, no. 37, 933-942.
Gupta, S.: A critical analysis of mental toughness and will to win between throwers and jumpers: a psychological probe, International journal of behavioral social and movement sciences, 2013, vol. 2, no. 2, 162-168.
Gymbrah, M., (2013): Psychological profile assessment of mental toughness among senior high school football players in Ghana, European Journal of business and management, 2013, vol. 1, 3,136-151.
Javeed, Q. S.: A study of personality need dimensions among individual and team game players, Indian Streams Research Journal, 2013, vol. 3, no. 5, 1-4.
Jones, G., Connaughton, S, D., (2007), ‚A Framework of Mental Toughness in the
World's Best Performers‛
http://journals.humankinetics.com/TSPvolume21issue2june.
Kajbafnezhad, H.,(2011): Difference between Team and Individual Sports with Respect to Psychological Skills, Overall Emotional Intelligence and Athletic Success Motivation in Shiraz City Athletes, Journal of Basic and Applied Scientific Research, 2011, vol.1, no.11,1904-1909.
Kathuria, S., & Nanda, I, K.,(2012): A comparative study on selective psychological variables among team game and individual game athletes, European Journal of business and management, 2013, vol. 5, no. 23,1-3.
Mattie, P., (2009): Examining the Relationship between Imagery Use and Mental Toughness.
Middleton, S. C., et. al., (2004): Discovering Mental Toughness: A Qualitative Study of Mental Toughness in Elite Athletes.
Omar-Fauzee, M.S., et. al., (2010): Mental Toughness among Footballers: A Case Study, International Journal of Academic Research in Business and Social Sciences January 2012, Vol. 2, No.1, 639-658.
Pattison, S., (2011): The Development and Implementation of a Mental Toughness Training Programme for Young Cricketers.
Sharma, S., et. al.: Association of Selected Psychological factor among Individual and Team Game, Research Journal of Physical Education Sciences, 2013, Vol.1, no. 4, 1-5.
Solanki, A. S., et. al.: Comparative Study of Mental Toughness between The Players Of Taekwondo And Cricket, Indian Streams Research Journal, 2013, Vol. 3, No. 11. Stonkus, M. A., (2011): The development and validation of the inventory of mental
toughness factors in sports (IMTF-S).
Creative Commons licensing terms