Clinical Trials: Publication Bias and the Food and Drug Administration
Amendments Act of 2007
By Quang Pham
A Master’s Paper submitted to the faculty of the University of North Carolina at Chapel Hill
in partial fulfillment of the requirements for the degree of Master of Public Health in
the Public Health Leadership Program
Chapel Hill 2012
Advisor
Date
Second Reader
I
Abstract
Background
Publication bias of clinical trials can lead to increased harms and costs for patients and society. Attempts to reduce publication bias and its effects have focused on increasing the transparency of conducting clinical trials. The Food and Drug Administration Amendments of 2007 (FDAAA 2007) requires the registration of the results of applicable trials on ClinicalTrials.gov, a publicly accessible database. It is unclear whether or not registering results of clinical trials will decrease publication bias by increasing rate of publication in a peer-reviewed journal.
Methods
I conducted a cross-sectional analysis of all clinical trials dealing with the primary treatment and/or prevention of cancer registered on ClinicalTrials.gov and completed from October 2007 to December 2009. I used Medline, Cochrane Library, EMBASE, and CINAHL to search for a corresponding publication for each of the included trials. I used a logistic regression model, adjusted for identified covariates, to examine the relationship between having registered results and having a corresponding publication.
Results
A total of 371 trials were included for the analysis. When adjusted for enrollment size, study phase, and funding type, trials without registered results publish 66.2% of the time, and trials with registered results publish 72.9% of the time, p= 0.21. In comparing the registered outcomes with the published ones, 120 of 124 trials (96.7%) reported the same primary outcome(s). Of the 120 that reported the same primary outcomes, 12 (17.5%) showed discrepancies in the reported results and the published results. Among the 128 trials with a corresponding publication, there does not appear to be a relationship between funding type and the probability of publishing a favorable outcome.
Discussion
II
Acknowledgements
III
Table of Contents
Text
1. Background 1
2. Methods 3
3. Results 8
4. Discussion 10
5. References 22
Tables and Figures
1. Figure 1 16
2. Table 1 17
3. Table 2 18
4. Table 3 19
5. Table 4 20
6. Table 5 21
7. Table 6 21
Appendices
1. Appendix A: Supplementary Tables 23
Background
Publication bias is the act of not publishing studies with unfavorable results, selectively publishing favorable outcomes, and misrepresenting or misinterpreting data to make the results more favorable. Publication bias can harm patients, impede the progress of medical knowledge, and substantially increase costs. Since the proper practice of medicine is evidence-based, publication bias may begin a chain of events leading to an incomplete and/or biased body of evidence and, in practice, to prescribing ineffective or even harmful medicines. Two well-publicized examples are Merck’s recall of Vioxx (an arthritis drug) due to its increased risk of causing cardiovascular disease and the surrounding debates about the concealment of these data; and the lawsuit against GlaxoSmithKline charging them for concealing the lack of efficacy data and increased likelihood of suicide associated with the use of Paxil (an antidepressant) (1). Other cases include published literature demonstrating an overall 32% greater effect size of a range of antidepressants when compared to FDA-registered studies (2); and an analysis of previously unpublished studies of rosiglitazone (a diabetes drug) showing that it may cause a higher risk of myocardial infarction and death than had been previously reported (3).
2 In an effort to increase transparency in clinical trials and to curb publication bias, the
International Committee of Medical Journal Editors (ICMJE) in 2005 required the registration of the characteristics of clinical trials before the start of the trials as a prerequisite for publishing in ICMJE-associated journals (4). From May to October 2005, trial registrations grew significantly in compliance with the new policy (5). Building on ICMJE’s example, the Food and Drug Administration Amendments Act of 2007 included and expanded this requirement (FDAAA 2007)(6). Among other changes, FDAAA 2007 requires the registration on a dedicated website, ClinicalTrials.gov, of the results of applicable trials (phase II and beyond interventional studies; studies involving drugs, biologics, and medical devices regulated by the FDA; studies having at least one site in the United States or conducted under an investigational new drug application or investigational device exemption; and studies initiated after September 27, 2007 or ongoing as of December 27,2007) within a set time frame after trial completion (7). Failure to do so is met with substantial penalties, including a charge of $10,000/day for each day of non-compliance (7). FDAAA 2007 makes the results of clinical trials publicly available regardless of whether the trials are published in a peer-reviewed journal. Of important note, ICMJE acknowledges the complementary roles of registering results and publications and does not consider the former to be a previous publication (8).
The registration of results is a great step toward increasing transparency. However, the law simply requires the registration of the results (non-peer-reviewed), without their much needed
accompanied commentaries and explanations. Furthermore, in the absence of a full study protocol, the validity and reliability of the results become difficult to assess. In inexperienced hands, results by themselves can harm more than help patients. Thus, peer-reviewed publications remain crucial to our understanding of the results and implications of clinical trials. Compared to trials registered in
3 transparency –making the results publicly available, removing the incentives to conceal or manipulate their presentation–increases the publication rates of clinical trials in peer-reviewed journals.
This paper seeks to measure the effects of FDAAA 2007 on publication bias by addressing this question; Compared to clinical trials without registered results, do clinical trials with registered results have a higher rate of publication in a peer-reviewed journal? The inquiry also yields two related
secondary questions: For trials with registered results and a corresponding publication, how well do the results of the registered primary outcome(s) match with the published results? And for all trials with a corresponding publication, is there a relationship between funding type and whether a trial is more likely to favor the experimental arm (i.e. drug or biologic)? I limit the present test of these questions to clinical trials of the primary treatment or prevention of cancer because cancer is a leading cause of morbidity and mortality, and drugs and biologics used to treat cancer tend to create a heavy price burden for patients.
Methods
Selection of Trials
With the goal of capturing as many completed trials with registered results as possible, I searched ClinicalTrials.gov on 03/03/2012 with the following limits and terms: closed studies (recruitment has ended), exclude unknown recruitment status, interventional studies, neoplasm, biologic OR drug, phase II, III, IV, NIH, US Fed, industry, other, and received from 03/29/2000 to
12/31/2011. This search strategy captures all interventional trials involving the treatment or prevention of cancer with either a drug or biologic, from all phases beyond I, with any funding source, and
4 Microsoft Excel. I then filtered the trials to include only those with a primary completion date and completion date between October 2007 and December 2009 (to allow two years to post results and to publish, and FDAAA 2007 only applies to studies completed after late September 2007). I sorted the resulting trials into two cohorts: those with registered results and those without registered results. For the trials without results, I used a random number generator to choose a starting point, and sampled every 3rd trial to obtain a relatively even number of trials in each cohort.
Searching for Publications
I searched for a corresponding publication for each trial using a systematic approach adapted from Bourgeois and his colleagues (10). In particular, I searched the same databases, allowed at least two years for the completed trials to get published, and used their strategy of searching using key words derived from the drug(s) and/or biologic(s), investigators, and disease of interest being studied for each clinical trial. During this search, I excluded trials studying the treatment of the secondary symptoms of cancer (e.g. anemia, imaging, pain, etc.) and those that were terminated, withdrawn or suspended. I first looked at ClinicalTrails.gov to see if it cited a publication for the trial. If ClinicalTrials.gov did not include such information, I proceeded to search Medline with the CinicalTrials.gov identification number. If this did not produce a publication, I searched for the trial Principal Investigator’s (last name), the trial condition (i.e. cancer type), and the drug or biologic of interest. If I found a potential article, I matched its characteristics with the descriptors of the trial, including location, enrollment number, primary and secondary outcomes, doses of the drug, etc.
5 trial. I saved all publications I did find using the clinicaltrials.gov ID number as an identifier. To make sure that I was not giving undue time for publication to some trials but not others, I censored the publication data with an endpoint of February 29th, 2012 (e.g. an article published after that date is considered as not having a publication). Figure 1 shows the selection process and the number of trials this process produced.
Searching for FDA Approval
To determine the FDA approval status of the drug and/or biologic used in each trial, I searched the FDA site at http://www.accessdata.fda.gov/scripts/cder/drugsatfda/. The search engine of this particular segment of the site does not cover biologics, so if the initial search turned up nothing, I searched the entire FDA site broadly. If an experimental drug did not have a name, I used a drug portal from the national library of medicine (http://druginfo.nlm.nih.gov/drugportal/drugportal.jsp) to check for corresponding names. Often times, each drug has multiple names and labels. In such situations I downloaded all the labels into a common directory. If it happened that the FDA did not have a single label for the drug of interest, I used Google and the National Cancer Institute to identify the relevant information. To determine FDA approval, I matched the formulation (i.e. injection vs. PO or x-month depot) and the disease for which the drug and/or biologic is being used with the indications and use found in FDA drug and/or biologic label(s). All drugs and/or biologics in the trial needed to be FDA approved before I considered the entire trial to be considered “FDA approved”.
Matching Registered with Published Outcomes
6 if the publication reported the same outcome(s) as did the registered trial. I then determined if the results of the published outcome(s) match the results of the registered outcome(s).
Determining the Influence of Funding and Favorable Outcomes
For the subset of trials with a corresponding publication, I examined whether the publication favors the experimental drug/arm for the primary outcome(s). This data subset included all the 300 trials without registered results that had a corresponding publication and a random 33% sample of the initial 339 trials with registered results with a corresponding publication. This method gives a more representative sample of all trials completed from October 2007 to December 2009. For trials with a single arm and without a test of statistical significance, I based my judgment on the authors’ conclusion. In such cases, I considered terms such “promising” and “encouraging” as favorable and “modest” and “moderate” as unfavorable. For trials with multiple arms, I looked for a statistically significant difference between the arms in the primary outcome of interest.
Creating a Trials Codebook
7 A colleague, Dane Meredith, repeated an analysis of a random 10% (64) subset of the original 639 trials to determine if they were relevant, marked as completed, or had a corresponding publication. I disagreed on the classification of 5 (7.8%) of the trials. After discussion, I was not required to change my initial classification of any trials.
Statistical Analysis
I used Stata 12.0 (College Station, Texas) to analyze the data. The outcome for the primary research question is a publication that corresponds to the trial. The main independent variable for this analysis is having registered results. I included additional variables in the analysis in order to assess their potential to confound the relationship between registered results and corresponding publication. These other variables are enrollment size, phase of the clinical trial, funding source, intervention design, allocation type (randomized or not), the use of masking, having one or multiple study sites, having a US study site, FDA approval status, the time (in months) elapsed from completing the data collection for the primary outcome to the date of our publication search, and the time elapsed from trial completion to the date of my publication search.
I first generated frequency distributions of all variables to examine the characteristics of the trials and to assess the effects of missing data and extreme values. Given the non-parametric
8 adjusted for covariates identified from the bivariate analyses. The data dictated treating trial phase and funding type as nominal variables; in particular, because only three trials were either entirely funded by the federal government or by a combination of industry, NIH, and other sources. The final logistic regression model adjusts for enrollment size, trial phases, and funding type, and it drops an additional two observations for which trial enrollment size data are missing. A two-sided sample size calculation with alpha=0.05 estimated that I would need a total of 330 trials to have a power of 0.80 to detect a 15% difference in publication status.
I used a similar approach to analyze the relationship between reporting a favorable conclusion (outcome of interest) and funding type (main independent variable). Since a favorable conclusion leads to FDA approval (FDA approval status lies on the causal pathway), I did not adjust for FDA approval. In the final model, I also adjusted for randomization and intervention design. The test of how well
registered and published outcomes match results from a careful comparison of the two reported sets of findings for any apparent discrepancy, including any presentation that appears to emphasize a more favorable result in publication than was evident in the registered results; see the next section for examples.
Results
9 corresponding publication; the trials enrolled a median of 59 patients; and more than half of them were in phase IIAs the table makes clear, a large majority of the trials (89%) did not use any form of masking and almost three quarters of them were funded in part or in whole by industry. More than half of the trials had a single group assignment (i.e. single arm in the study), and the sample does not appear to be affected by any right censoring in terms of time to publication for trials completed by 2009 (83 and 85 trials completed by 2008 and 2009 had a corresponding publication, respectively).
Tables 3 and 4 show that trials with registered results had more patients enrolled (77 vs. 46), and they were more likely to be funded solely by industry (70.3% vs. 28.6%). This disparity most likely results from the fact that the overwhelming preponderance of trials in the entire sample is industry-sponsored. Registered trials were more likely to be of drugs with FDA approval (37.4% vs. 12.5%), and a greater proportion of registered trials had more than one study site (70.2 vs. 53.6%). Statistically significant covariates included the phases of the trial, the enrollment size, and the funding type; funding type may be significant because of the maldistribution of the data. Table 5 shows, ceteris paribus, an almost 10% differential in publication, favoring trials with published results; this difference is rendered insignificant by controlling for enrollment size, study phase, and funding type. Almost all registered trials, 120 of 124, reported the same primary outcome(s) in the registry as they did in their
corresponding publication. Of the four trials that did not report the same primary outcome(s), one trial did not report the results for one arm of its trials; one trial did not report the second stage of its trial; one trial, with very confusing registered primary outcomes, did not report all of its primary outcomes; and the remaining trial was included as a part of a pooled analysis and did not report the primary outcome of the separate trial.
10 that seem to lower the efficacy of the experimental drug/biologic; and 5 (23.8%) published different numbers, and could not be determined to improve or reduce the efficacy of the experiment
drug/biologic.
Among the 128 trials with a corresponding publication, unadjusted analysis examining the relationship between funding type and publishing a favorable outcome shows no difference between having partial or complete funding by industry and having no funding from industry (62.7% vs. 62.3% favorable, p=0.96). Table 6 shows that adjusting for randomization of patients and the intervention model does not materially change the results, and when funding type is broken into the six different categories found on ClinicalTrials.gov, the number of trials in each category becomes too few to make a clear conclusion. Overall, however, it does not appear that funding type affects the probability of publishing a favorable outcome (Supplementary Table 2, in Appendix A).
Discussion
11 people have always suspected about publication bias, it is possible that trials with more favorable findings are more likely to be registered and published. This unquantifiable confounder could
potentially explain the higher, albeit statistically insignificant, publication rate of trials with registered results.
The sampling strategy used to answer the primary question in this work may affect the representativeness of the publication rates. However, a body of literature does show that
approximately 30% of trials do remain unpublished, even several years after their completion (12). This suggests that even after FDAAA 2007, the failure to publish the results of clinical trials remains a large problem.
Furthermore, while ClinicalTrials.gov does employ quality control measures to verify the data entered into its database and to detect blatantly incorrect data, such as ages of several hundred years, it currently does not and cannot verify the accuracy of the entered data that are within apparently normal ranges (13). This great responsibility for data accuracy remains with the sponsors and investigators of the clinical trials. In the subset of trials with registered results and a corresponding publication, 96.7% of the trials register and publish the same primary outcomes. However, only 83.5% of the registered primary outcome results match the outcome results in the corresponding publications. These discrepancies do not appear to be systematic: 38.1% of discrepancies are more favorable, 38.1% are less favorable, and 23.8% cannot be compared to the published results, respectively.
12 Although the discrepancies in the oncology trials examined here do not appear to vary in systematic ways, they do call for a re-analysis of validity of the registered results, especially if the results without their accompanied commentaries and explanations and research protocols are to be taken at face value and used to guide the treatment of patients.
The finding here of no relationship between funding type and the probability of reporting a favorable outcome for the experimental drug or biologic (62.8% vs. 59.6%, p=0.76) does not agree with previously published literature. One study examining drug trials registered in ClinicalTrials.gov as of August 2009 involving five categories of drugs (not including oncology drugs), for example, found that 85.4% of publications from industry-funded trials reported favorable outcomes, compared with 50.0% of publications among government-funded trials and 71.9% among nonprofit or nonfederal source-funded trials (10). Further, after reclassifying nonprofit or nonfederal source-funded trials into those that also received industry contributions and those without industry contribution, 85.0% of publications of trials with industry support in that study reported favorable outcomes, true of only 62.1% of those without industry support (10). These data suggest a strong relationship between having any industry
contribution and the probability of a publication reporting a favorable outcome. Perhaps the different pattern of findings reported in this current study comes from the difference in diseases examined and/or the smaller sample of oncology trials examined.
Limitations
Since the included trials only examine the primary treatment or prevention of cancer, the results here may not be readily generalizable to other medical conditions. Because an attempt to include only those trials required to register their results by law yielded too few trials without registered results for a meaningful analysis, my primary question was not limited to trials with a mandatory reporting
13 stems from using only FDA approval status, and not both FDA approval and Investigation New Drug (IND) application status. According to FDAAA 2007, drugs and biologics under an IND application must also report their results (7), but its confidentiality makes the IND application status difficult to
determine. Furthermore, since the final sample size was only powered to detect a 15% difference in publication status, a smaller, but statistically significant difference could have been detected with a larger sample size. Additionally, while I developed a robust method for searching for a corresponding publication in four major publication databases, it remains possible that I misclassified some trials, and publications could have been found in other databases.
This analysis of the relationship between funding type and the probability of publishing a favorable outcome dichotomizes funding type into any or complete funding from industry, and no funding from industry, to preserve sufficient cases per category for adequate analysis. To determine whether this collapsing of funding categories affected the results, I re-ran them, adding a “partial industry funding” category, generating similar results. Finally, the results here may not be generalizable to trials registered outside of ClinicalTrials.gov. Future studies should examine these questions in other medical conditions and other trial registries.
Policy Implications
Clinical trials with positive results tend to be published more often than do trials with negative results (4). Despite ICMJE’s statement calling for the publication of negative clinical trials, a large proportion of trials overall remains unpublished (15). Even an attempt to increase the transparency of clinical trials by requiring them to register their results does not appear to increase the publication rate. Perhaps certain policy makers had foreseen this, as FDAAA 2007 also includes a provision to expand the registry and results database by developing implementation rules within three years from the
14 and requirements of FDAAA 2007 and address the possibility of also requiring trials with unapproved products to register their results; investigators and/sponsors to provide non-technical and technical summaries of the clinical trials and their results for patients and researchers, respectively; investigators and/or sponsors to provide the full protocol of the trial; and anything else deemed appropriate since the enactment of FDAAA 2007 (7). Although a public meeting did occur on April 20, 2009 to provide an opportunity for input from interested parties about the regulations for the expanded registry and results database, final rules have not yet been issued (16, 17).
Given that isolated results do not provide sufficient information fully to understand a clinical trial, and the requirement to register results does not appear to reduce publication bias, an expanded registry and results database that includes a full protocol of the trial and summaries for patients and researchers becomes crucial. Such an expanded database would allow for the effective dissemination and acquisition of knowledge regardless of whether a trial publishes in a peer-reviewed journal for whatever reason. Since ICMJE will only release registrations from the “no prior publication”
requirement if they have fewer than 500 words, some trials that comply with the updated FDAAA 2007 law may be prevented from publishing in a peer-reviewed journal (8). A possible solution is to allow for a publication in lieu of an expanded results registration. Alternatively, ICMJE can exempt trials that register from their policy, or relax its policy in a manner that does not disincentivize trials from fully registering their results.
15 lack of sufficient information provided, into a review can bias the review’s overall conclusions and weaken its scientific integrity. A biased body of evidence does not benefit patients.
Although the requirement to register summaries and protocols in addition to results may create additional burdens on investigators and/or sponsors, they have the moral and financial obligation to do so. Participants volunteer in clinical trials despite uncertain benefits and possible harms to advance knowledge, and in the hope that this knowledge will benefit as many people as possible. The failure to provide such knowledge in a complete and comprehensible form to all those who can benefit from it is a disservice to the hopes and wishes of the participants in the trials. Additionally, funding for trials conducted by academia and other non-profit organizations come from taxpayers’ money. The public has a right to the information they are paying for.
17 Table 1: Codebook
Variable (Name) Coded as
Registered Results (Result) Does Not Have Registered Results=0 Has Registered Results=1
Study Phase (Phase) I/II=0
II=1 II/III=2 III=3 IV=4
Enrollment Size (Enroll) Number
Funding Type in Six Categories (Fund) Other=0 US Fed=1 NIH=2 Industry=3 Other/NIH=4 Industry/Other=5 Other/Industry/NIH=6 Funding Type in Two Categories (Indus) No Funding by Industry=0
Any Funding by industry=1
Allocation (Allo) Non-Randomized=0
Randomized=1
Intervention Model in Two Categories (Mod) Single Group Assignment=0
Parallel Group Assignment or Cross-Over Design=1 Masking in Two Categories (Blind) Open=0
Single or Double or Triple=1 Number of Study Sites (Site) Single Study Site=0
Multiple Study Sites=1
US Study Site (US) Not Having a US Study Site=0
Having a US Study Site=1
FDA Approval Status (FDA) No=0
Yes=1 Time Elapsed Since Primary Completion Date
(Primary)
In Number of Months Time Elapsed Since Completion Date (Comp) In Number of Months
18 Table 2: Characteristics of the Included Trials
Characteristic (n=371) Median or Percent
% Having a Publication 58.8
% Having Registered Results 52.6
Enrollment Size 59
% of Trials in Phase I/II II II/III III IV 10.0 66.3 2.3 18.9 2.7 % of Trials Using Masking
Open Single-Blind Double-Blind Triple-Blind 89.3 0.8 7.7 2.2 % of Trials Funded by
Other*
US Federal Government NIH NIH/Other Industry Industry/Other Industry/Other/NIH 17.3 0.3 2.4 8.1 55.3 16.2 0.5 %Funded Fully or in Part by Industry 72.0 % of Trials with FDA approved drugs/biologics 25.6 %Using Randomization of Patients 41.6 % of Trials Using Intervention Model
Single Arm Parallel Arm Cross-Over 58.4 39.9 1.7
% Having More than One Arm 41.6
%Having More than One Study Site 62.1 % Having One or More Study Site in the US 64.5 Months Elapsed Since Primary Completion Date
and Publication Search
40 Months Elapsed Since Completion Date and
Publication Search
37
19 Table 3: Bivariate Associations between Characteristics of the Sample and Having a Publication
Characteristic N % Having a Publication
or Correlation P value* Registered Results No Yes 176 195 54.0 63.1 0.08
Enrollment Size 371 0.11 0.03
Trials in Phase I/II II II/III III IV 37 246 8 70 10 54.1 58.9 12.5 68.6 40.0 0.02
Trials Using Masking Open
Single, double, or triple masking
325 38
58.8 63.2
0.60
Trials Funded by Other
US Federal Government NIH NIH/Other Industry Industry/Other Industry/Other/NIH 64 1 9 30 205 60 2 57.8 100 22.2 66.7 55.6 70.0 100 0.07
Having FDA Approval Status No Yes 276 95 57.3 63.2 0.31 Using Randomization of Patients
No Yes 184 131 57.6 67.2 0.14 Having More than One Arm
No Yes 212 151 56.1 63.6 0.16 Having More than One Study Site
No Yes 130 213 59.2 59.6 0.94 Having One or More Study Site in the US
No Yes 122 222 61.5 58.1 0.54 Months Elapsed Since Primary Completion Date
and Publication Search
371 0.03 0.51
Months Elapsed Since Completion Date and Publication Search
20 * Medians and p values based on Wilcoxon Rank Sum for continuous variables and Pearson’s
chi-square test for categorical variable; Correlations and p values based on Pearson’s correlation Table 4: Characteristics Stratified by Having Registered Results #
# Significance tests for comparisons based on Wilcoxon Rank Sum for continuous variables and Pearson’s chi-square test for categorical variables
**p<0.01
Characteristic No Registered Results (n=176) Has Registered Results (n=195)
Median Enrollment Size** 46 77
% of Trials in Phase** I/II II II/III III IV 14.2 68.2 2.8 12.5 2.3 6.2 64.6 1.5 24.6 3.1 Trials Using Masking
Open
Single, Double, or Triple 89.5 1.2
88.3 1.0 Trials Funded by**
Other
US Federal Government NIH NIH/Other Industry Industry/Other Industry/Other/NIH 30.7 0.6 3.4 9.7 38.6 17.1 0 5.1 0 1.5 6.7 70.3 15.4 1.0
% With FDA Approval** 12.5 37.4
%Using Randomization of Patients
40.2 42.7
% Having More than One Arm 36.3 46.2
%Having More than One Study Site**
53.6 70.2
% Having One or More Study Site in the US
60.5 68.4
Median Months Elapsed Since Primary Completion Date and Publication Search
40 40
Median Months Elapsed Since Completion Date and Publication Search
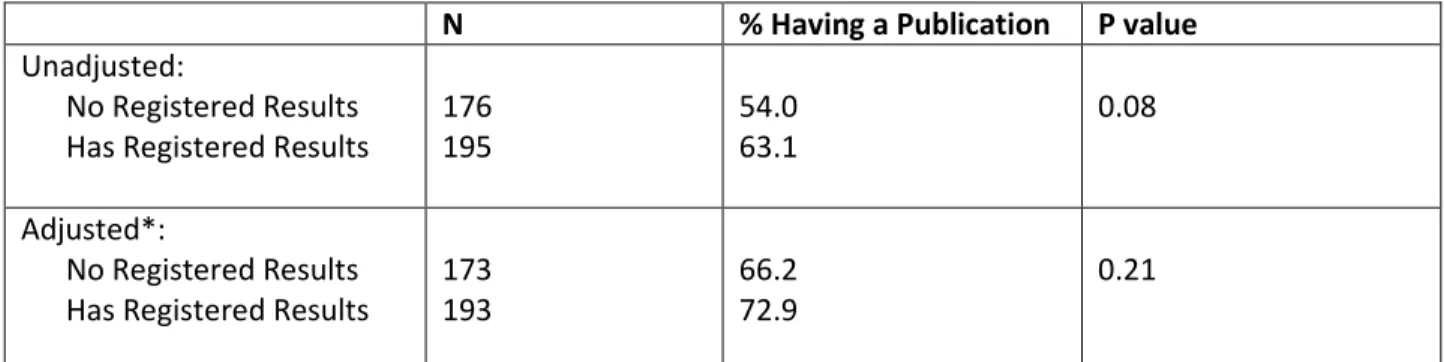
21 Table 5: Adjusted Comparison of Having Registered Results and the Probability of Having an Associated Publication
N % Having a Publication P value
Unadjusted:
No Registered Results Has Registered Results
176 195
54.0 63.1
0.08
Adjusted*:
No Registered Results Has Registered Results
173 193
66.2 72.9
0.21
* Based on a multiple logistic regression model, adjusted for enrollment size, study phase, and funding type
Table 6: Adjusted Comparison of Probability of Reporting a Favorable Outcome and Funding Type (2 Categories)
N % With a
Favorable Conclusion
P value
Unadjusted:
Not Funded by Industry
Partially or Completely funded by Industry 53 75
62.3 62.7
0.96 Adjusted*:
Not Funded by Industry
Partially or Completely funded by Industry 35 73
59.6 62.8
22 References
1. Rothstein HR, sutton AJ, borenstein M, eds. publication bias in meta-analysis. Prevention, assessment and adjustments. sussex: John wiley and sons, 2005.
2. Turner EH, Matthews AM, Linardatos E, Tell RA, Rosenthal R. Selective publication of antidepressant trials and its influence on apparent efficacy. N Engl J Med [Internet]. 2008 Jan 17;358(3):252-60.
3. Nissen SE, Wolski K. Effect of rosiglitazone on the risk of myocardial infarction and death from cardiovascular causes. N Engl J Med [Internet]. 2007 Jun 14;356(24):2457-71.
4. De Angelis C, Drazen JM, Frizelle FA, Haug C, Hoey J, Horton R, Kotzin S, Laine C, Marusic A, Overbeke AJ, Schroeder TV, Sox HC, Van Der Weyden MB, International Committee of Medical Journal Editors. Clinical trial registration: A statement from the international committee of medical journal editors. N Engl J Med [Internet]. 2004 Sep 16;351(12):1250-1.
5. Zarin DA, Tse T, Ide NC. Trial registration at ClinicalTrials.gov between may and october 2005. N Engl J Med [Internet]. 2005 Dec 29;353(26):2779-87.
6. Zarin DA, Tse T. Medicine. moving toward transparency of clinical trials. Science [Internet]. 2008 Mar 7;319(5868):1340-2.
7. Food and drug administration. amendments act of 2007. public law no 110-85, 2007.
8. Laine C, Horton R, DeAngelis CD, Drazen JM, Frizelle FA, Godlee F, Haug C, Hebert PC, Kotzin S, Marusic A, Sahni P, Schroeder TV, Sox HC, Van der Weyden MB, Verheugt FW. Clinical trial registration--looking back and moving ahead. N Engl J Med [Internet]. 2007 Jun 28;356(26):2734-6.
9. Califf RM, Zarin DA, Kramer JM, Sherman RE, Aberle LH, Tasneem A. Characteristics of clinical trials registered in ClinicalTrials.gov, 2007-2010. JAMA [Internet]. 2012 May 2;307(17):1838-47.
10. Bourgeois FT, Murthy S, Mandl KD. Outcome reporting among drug trials registered in ClinicalTrials.gov. Ann Intern Med [Internet]. 2010 Aug 3;153(3):158-66.
11. Prayle AP, Hurley MN, Smyth AR. Compliance with mandatory reporting of clinical trial results on ClinicalTrials.gov: Cross sectional study. BMJ [Internet]. 2012 Jan 3;344:d7373.
12. Ross JS, Tse T, Zarin DA, Xu H, Zhou L, Krumholz HM. Publication of NIH funded trials registered in ClinicalTrials.gov: Cross sectional analysis. BMJ [Internet]. 2012 Jan 3;344:d7292.
13. Zarin DA, Tse T, Williams RJ, Califf RM, Ide NC. The ClinicalTrials.gov results database--update and key issues. N Engl J Med [Internet]. 2011 Mar 3;364(9):852-60.
14. Mathieu S, Boutron I, Moher D, Altman DG, Ravaud P. Comparison of registered and published primary outcomes in randomized controlled trials. JAMA [Internet]. 2009 Sep 2;302(9):977-84.
15. International committee of medical journal editors. uniform requirements for manuscripts submitted to biomedical journals: Publishing and editorial issues related to publication in biomedical journals: Obligation to publish negative studies. www.icmje.org/publishing_1negative.html.
16. U.S. national library of medicine. CinicalTrials.gov protocol registration system: PRS and U.S. public law 110-85.
http://prsinfo.clinicaltrials.gov/fdaaa.html.
23
Appendix A: Supplementary Tables
S1: Bivariate Associations between Characteristics of the Sample and Reporting a Favorable Outcome
Characteristic N % With a Favorable
Conclusion or Correlation P value* Registered Results No Yes 92 36 58.7 72.2 0.16
Enrollment Size 128 0.04 0.66
Trials in Phase I/II II II/III III IV 17 86 0 23 2 64.7 64.0 NA 56.5 50.0 0.90
Trials Using Masking Open
Single, double, or triple masking
113 12
63.7 50
0.12
Trials Funded by Other
US Federal Government NIH NIH/Other Industry Industry/Other Industry/Other/NIH 35 1 2 15 52 23 0 68.6 100.0 50.0 46.7 65.4 56.5 NA 0.64
Having Partial or Complete Industry Funding No Yes 53 75 62.3 62.7 0.96 Having FDA Approval Status
No Yes 99 29 56.6 82.8 0.01 Using Randomization of Patients
No Yes 57 51 70.2 51.0 0.04 Having More than One Arm
No Yes 70 55 72.9 50.9 0.01 Having More than One Study Site
24 Having One or More Study Site in the US
No Yes 49 74 69.4 58.1 0.21 Months Elapsed Since Primary Completion Date
and Publication Search
371 -0.10 0.27
Months Elapsed Since Completion Date and Publication Search
371 -0.12 0.17
* Medians and p values based on Wilcoxon Rank Sum for continuous variables and Pearson’s chi-square test for categorical variable; Correlations and p values based on Pearson’s correlation
S2: Adjusted Comparison of Probability of Reporting a Favorable Outcome and Funding Type (6 Categories)
N % With a
Favorable Conclusion
P value
Unadjusted: Trials funded by Other
US Federal Government NIH NIH/Other Industry Industry/Other Industry/Other/NIH 35 1 2 15 52 23 0 68.7 NA NA 46.7 65.4 56.5 NA 0.60 Adjusted*:
Trials funded by Other
US Federal Government NIH NIH/Other Industry Industry/Other Industry/Other/NIH 26 1 0 8 50 23 0 61.5 NA NA 49.8 67.2 52.9 NA 0.64
25
APPENDIX B: Systematic Review
Background
The purpose of medical research is to advance knowledge and develop effective therapies to manage illnesses. One of the ways to achieve this aim is to ensure that knowledge is unbiased. Not only does biased knowledge impede advancement, it results in suboptimal management of a patient’s well-being. Concurrent with the rapid growth of medical research, industry’s involvement in research has increased drastically. In one analysis, during 1981-1984, less than 10% of investigators received some form of funding by industry, but by 1997-2000, over 60% of investigators did (1). The rise in prevalence of industry-sponsored research has prompted concerns about conflict of interest. Conflict of interest can lead to biased medical knowledge.
Selectively publishing, publishing only favorable results and/or not publishing at all, can lead to biased medical knowledge. By publishing selectively, investigators and sponsors can create an
incomplete and inaccurate picture of the actual effectiveness of their drug product. In a meta-analysis assessing the efficacy of anti-depressants, Whittington, Kendall, Fonagy, et al. found that if they include results from trials not published, the efficacy of many anti-depressants become negligible (2). This inaccurate picture impedes the proper advancement of knowledge, hurts patients, and is a disservice to the volunteers who participated in the trials.
26
Methods
Defining the Focused Question
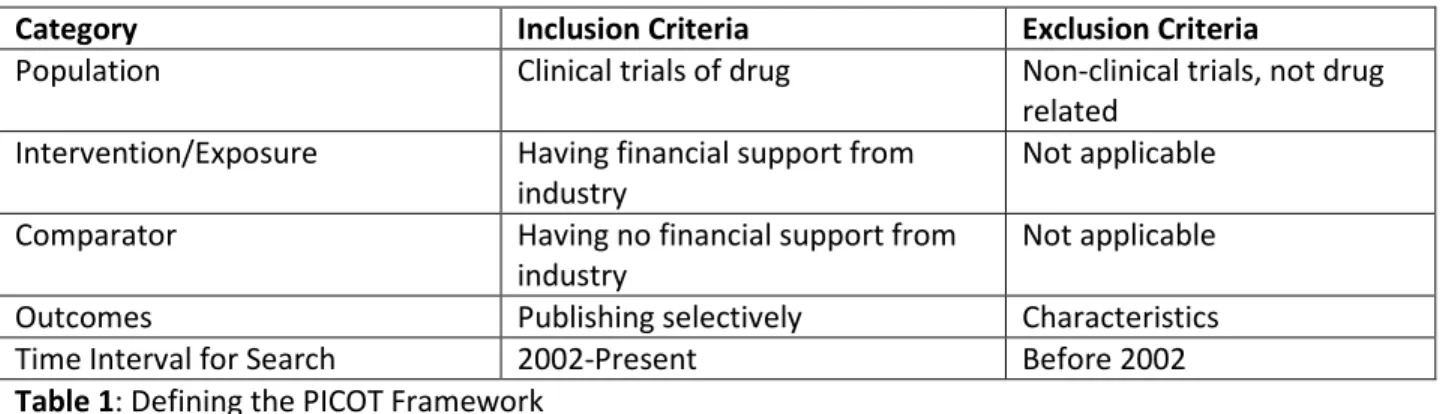
I used the adapted population-intervention-comparator-outcome-time interval for search (PICOT) framework to define my focused question: compared to non-industry-sponsored clinical trials of drugs, are industry-sponsored clinical trials of drugs more selectively published? Since the editors of the major journals did not require the disclosure of funding sources until late 2001, I limited my analysis to the year 2002 and later (3). Given the nature of this question, cross-sectional studies become the most feasible research design to examine it.
Category Inclusion Criteria Exclusion Criteria
Population Clinical trials of drug Non-clinical trials, not drug
related Intervention/Exposure Having financial support from
industry
Not applicable
Comparator Having no financial support from
industry
Not applicable
Outcomes Publishing selectively Characteristics
Time Interval for Search 2002-Present Before 2002
Table 1: Defining the PICOT Framework
Search Methods and Selection of Studies
27 For the articles retrieved from the string above, I first looked at their titles to determine their relevance. After excluding articles that did not have the relevant search terms and were not written in English, I read the abstracts of the remaining articles to make sure the studies simultaneously examined the role of industry and non-industry sponsorship as the primary or secondary outcome. For articles that I could not glean the necessary information from the abstract, I obtained the full-text and read its methods section.
Data Collection and Quality Assessment
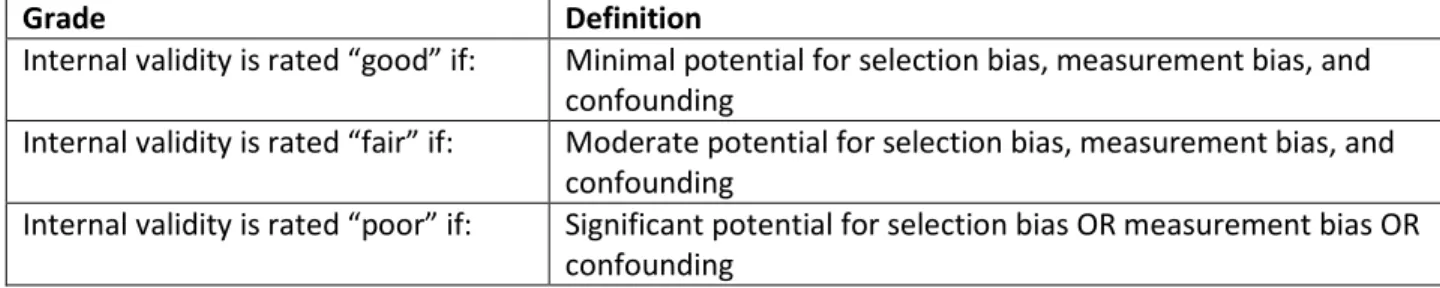
I collected relevant study characteristics from the seven studies into a table. Using the same table, I also appraised each study’s internal validity and generalizability. For internal validity, I focused primarily on selection bias, measurement bias, and potential for confounding. I focused my analysis of selection bias primarily on how well the characteristics of the clinical trials, with the exception of
funding type, resemble each other. Measurement bias deals with masking and the equality, validity, and reliability of evaluative criteria. Potential for confounding has to do with the possibility of other
variables influencing both the main exposure and the outcome. I used a plus system, where “+” represents minimum bias or potential and “+++” represents maximum bias or potential.
28
Grade Definition
Internal validity is rated “good” if: Minimal potential for selection bias, measurement bias, and confounding
Internal validity is rated “fair” if: Moderate potential for selection bias, measurement bias, and confounding
Internal validity is rated “poor” if: Significant potential for selection bias OR measurement bias OR confounding
Table 2: Criteria for Rating Internal Validity
Grade Definition
External validity is rated “good” if: Large and representative sample size, standard protocols for research design
External validity is rated “fair” if: Medium and somewhat representative sample size, mostly standard protocols for research design
External validity is rated “poor” if: Small and poorly representative sample size, non-standard protocols for research design
Table 3: Criteria for Rating External Validity
Finally, I evaluate the overall strength of the evidence based on adapted criteria defined by Owens, Lohr, Atkins, et al. (4). Unlike the quality assessment of each study, the strength of evidence assessment examines the quality of a body of studies. A grade of “high” is reserved for a high confidence that the evidence reflects the true effect. A grade of “low” is reserved for a low level of confidence that the evidence reflects the true effect (Table 4).
Grade Definition
High High confidence that the evidence reflects the true effect.
Further research is very unlikely to change our confidence in the estimate of effect.
Moderate Moderate confidence that the evidence reflects the true effect. Further research may change our confidence in the estimate of effect and may change the estimate.
Low Low confidence that the evidence reflects the true effect. Further research is likely to change the confidence in the estimate of effect and is likely to change the estimate.
29
Results
The search string retrieved 137 studies. After reading the title and abstract of each study to determine the study’s relevance to the question of interest, fourteen articles remained. After full-text review, seven studies remained: six identified from the search strategy and one from talking to an expert. All seven studies were cross-sectional in nature, with only one having any form of masking. Four of the seven studies explicitly adjusted for confounders. Six of the seven studies were either unfunded or funded by non-industry sources, and one study did not report a funding source. Overall, no study received anything above a grade of above “fair” for internal validity. One study did receive a “good” for generalizability. Table 5 presents the relevant characteristics, results, and critical appraisal of the seven included studies.
The Studies
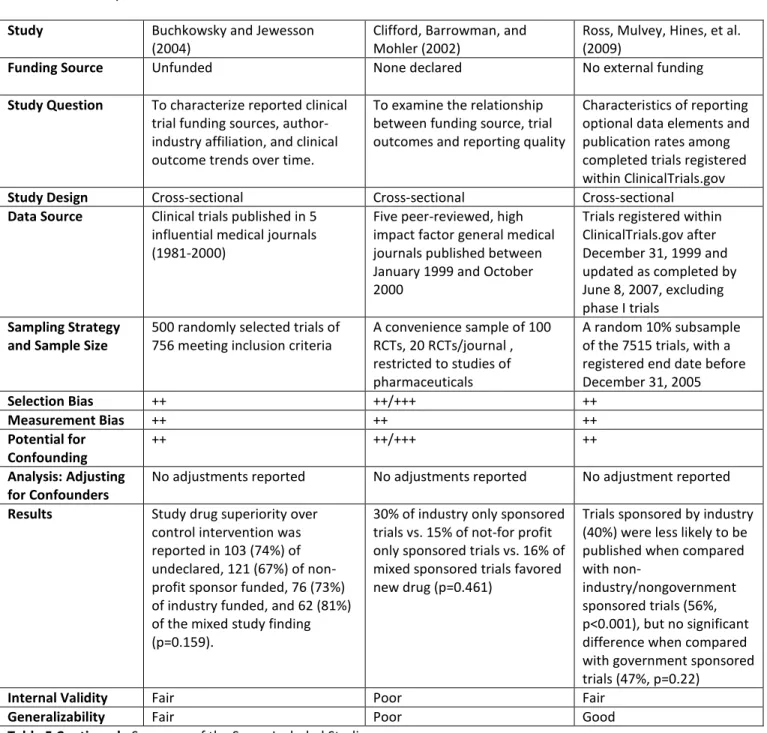
30 The two remaining studies by Buchkowsky and Jewesson and Clifford, Barrowman, and Mohler concluded no association between industry sponsorship and publication characteristics (1, 11). Like four of the five previous studies, these two studies did not use masking. Importantly, neither study reported adjustments for potential confounders. Additionally, while the Buchkowsky and Jewesson study used 500 randomly selected trials, the study by Clifford et al. used a convenience sampling of 100. Clifford et al. also failed to report a funding source. Thus, I judged the Buchkowsky and Jewesson study to have fair internal validity and generalizability and the Clifford et al. study to have poor internal validity and
generalizability (and excluded from further discussion).
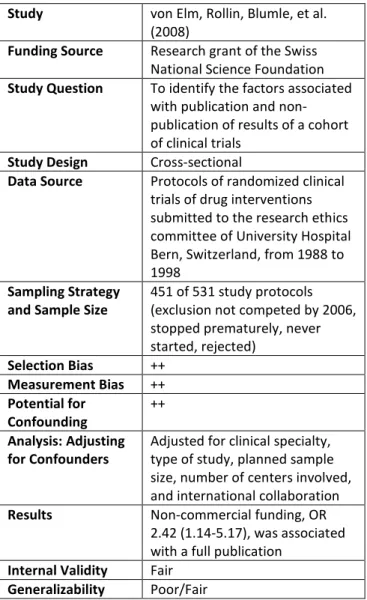
In terms of generalizability, the von Elm et al. study is the least generalizable study as it examines a cohort of protocols submitted to one Swiss university’s review committee (9). While these the results may apply to other universities in Switzerland, it is uncertain if they apply to universities outside of Switzerland, and more importantly to protocols not submitted to universities for review. However, the studies by Ross, Mulvey, Hines, et al. and Bourgeois, Murthy, Keeneth, and Mandl examined a much more representative sample of all trials registered on ClinicalTrials.gov (7, 8).
From the overall quality assessment of the included studies, there is more evidence for a relationship between funding source and selectively publishing, qualitatively and quantitatively. Discarding the one study with an internal validity rating of “poor”, five out of six studies provide evidence that funding by industry results in more selectively published studies. A likely reason for the discrepancy between the Buchkowsky et al. study and the other five studies is that the former study used a less recent sample of publications: 1981-2000 vs. late 1990s-2000 for the other studies(1). As noted, before 2001, major journal editors did not require disclosure of funding. As such, over 20% of the studies the authors analyzed did not declare a funding source. This could lead to a type II error.
31 Overall, I judged the strength of evidence to be moderate—moderate confidence that the evidence reflects the true effect. The use of a cross-sectional study design can introduce significant selection bias and potential for confounding. Additionally, only one study used any masking. However, most studies had a large sample size and adjusted for many relevant confounders.
Discussion
In conclusion, while the seven studies have their inherent weaknesses, the greater limitations and shortcomings in the two studies that did not find an association between sponsorship type and publication characteristics prompt us to be concerned that an association between industry sponsorship and selective publication does exist. This conclusion agrees with two existing systematic reviews, which show an association between industry sponsorship and pro-industry conclusion, with an odds-ratios ranging from 3.60 (2.63-4.91) to 4.05 (2.98-5.51)(6, 12). Of the seven studies included, two explicitly examined whether a mixed funding source has an influence selective publication. Als-Nieslen et al. found that compared to clinical trials with non-industry sponsorship, clinical trials with mixed sponsorship did not favor the new treatment (5). However, Bourgeois et al. found that compared to publications of trials without industry sponsorship, publications of trials mixed sponsorship still favor the experimental drug more often, 85% vs. 61%(7). Given that only these two studies considered the category of mixed sponsorship as separate from industry-sponsored category and gave contradictory results, it is difficult to make any generalizations about mixed sponsorship and publication bias.
32 observational studies. However, given the research question and the subject of the research, it is difficult, if not impossible, to use a different research design (e.g. a randomized controlled trial).
Incomplete publications of clinical trials may occur for several reasons. The investigators and/or sponsors may publish positive over negative results for financial and/or non-financial reasons. Journals may also prefer to publish positive over negative results (13). It is difficult to pinpoint the exact reason given the possible differences among trials conducted by industry and those conducted by non-industry (e.g. industry may only pursue trials with a higher chance of success, therefore their publications appear to favor the experimental drug more often; different journals, etc.). However, if industry strategically selects more favorable trials to conduct, its overall rate of publishing should be higher than the rate for non-industry. Since that does not appear to be the case, the results of this systematic review suggest that industry likely publishes less for reasons other than behaviors of journal reviewers and editors.
One possible way to address the potential harms of selectively publishing is to increase the transparency of clinical trials. FDAAA 2007 seeks to address this by making the results of applicable trials available to the public. With this move, results will become available regardless of whether or not a clinical trial is published. Lewis, Reichman, and So, however, argue that the mandatory disclosure of the results will only address a symptom of deeper structural problem of conflict of interest (14). The authors recommend removing the direct link between clinical trial sponsor (the drug company) and the drug tester and making the federal government the primary funder of clinical trials. While this approach would reduce cost, increase transparency, and greatly remove conflict of interest (e.g. a drug company will only fund trials of “beneficial” drugs like Viagra), such an approach will appear too radical to be politically feasible.
33 While it is not sensible to bar all involvement from industry in medical research, ignoring this issue can lead to much harm.
Study Als-Nielsen, Chen, Gluud, and
Kjaergard (2003)
Bhandrai, Busse, Jackowski, et al. (2004)
Bourgeois, Murthy, Keeneth, and Mandl (2010)
Funding Source Danish Centre for Evaluation and Health Technology Assessment
Canadian Institutes of Health Research Fellowship Awards
National Library of
Medicine, National Institute of Health
Study Question To explore whether the association between funding and conclusions in randomized drug trials reflects treatment effects or adverse events
To examine the association between industry funding and the statistical significance of results in recently published medical and surgical trials
To describe characteristics of drug trials in
ClinicalTrials.gov and examine whether funding source is associated with favorable published outcomes
Study Design Cross-sectional Cross-sectional Cross-sectional
Data Source Random sample of 167
Cochrane reviews from Cochrane Library, May 2001.
Trials published between Jan 1999 and June 2001 in 8 and 5 leading surgical and medical journals, respectively
Trials registered at ClinicalTrials.gov between 2000 and 2006.
Sampling Strategy and Sample Size
370 randomized drug trials chosen from 25 of the 167 Cochrane reviews
332 randomized controlled trials (RCTs) selected based on predefined quality criteria
546 efficacy or safety trials that studied
anticholesteremics, antidepressants, antipsychotics, proton-pump inhibitor, and vasodilators
Selection Bias ++/+++ ++ ++
Measurement Bias + (masking present) ++ ++
Potential for Confounding
++ ++ ++
Analysis: Adjusting for Confounders
Adjusted for treatment effect, adverse events, methodological quality, sample size, whether preset sample size was estimated and reached, meta-analysis, year of publication, and journal impact factor
Adjusted for sample size, study design, and type of
intervention
Adjusted for drug class, approval status of indication, study phase, multicenter status,
anticipated sample size, age of population, comparator type, and length of study
Results Trials funded by for-profit
organizations were more likely to recommend experimental drug as treatment choice, adjusted OR 5.3(2.0-14.4), compared with trials funded by non-profit organizations. No difference for mixed funding. This association does not reflect treatment effects or adverse
A statistically significant result in favor of new industry product, OR 1.8 (1.1-3.0)
34
events. government-funded trials
and 71.9% for non-profit or nonfederal organization funded trials (p<0.001).
Internal Validity Fair Fair Fair
Generalizability Fair Fair Fair/Good
Table 5: Summary of the Seven Included Studies
Study Buchkowsky and Jewesson
(2004)
Clifford, Barrowman, and Mohler (2002)
Ross, Mulvey, Hines, et al. (2009)
Funding Source Unfunded None declared No external funding
Study Question To characterize reported clinical trial funding sources, author-industry affiliation, and clinical outcome trends over time.
To examine the relationship between funding source, trial outcomes and reporting quality
Characteristics of reporting optional data elements and publication rates among completed trials registered within ClinicalTrials.gov
Study Design Cross-sectional Cross-sectional Cross-sectional
Data Source Clinical trials published in 5 influential medical journals (1981-2000)
Five peer-reviewed, high impact factor general medical journals published between January 1999 and October 2000
Trials registered within ClinicalTrials.gov after December 31, 1999 and updated as completed by June 8, 2007, excluding phase I trials
Sampling Strategy and Sample Size
500 randomly selected trials of 756 meeting inclusion criteria
A convenience sample of 100 RCTs, 20 RCTs/journal , restricted to studies of pharmaceuticals
A random 10% subsample of the 7515 trials, with a registered end date before December 31, 2005
Selection Bias ++ ++/+++ ++
Measurement Bias ++ ++ ++
Potential for Confounding
++ ++/+++ ++
Analysis: Adjusting for Confounders
No adjustments reported No adjustments reported No adjustment reported
Results Study drug superiority over
control intervention was reported in 103 (74%) of undeclared, 121 (67%) of non-profit sponsor funded, 76 (73%) of industry funded, and 62 (81%) of the mixed study finding (p=0.159).
30% of industry only sponsored trials vs. 15% of not-for profit only sponsored trials vs. 16% of mixed sponsored trials favored new drug (p=0.461)
Trials sponsored by industry (40%) were less likely to be published when compared with
non-industry/nongovernment sponsored trials (56%, p<0.001), but no significant difference when compared with government sponsored trials (47%, p=0.22)
Internal Validity Fair Poor Fair
Generalizability Fair Poor Good
35
Study von Elm, Rollin, Blumle, et al.
(2008)
Funding Source Research grant of the Swiss National Science Foundation
Study Question To identify the factors associated with publication and non-publication of results of a cohort of clinical trials
Study Design Cross-sectional
Data Source Protocols of randomized clinical trials of drug interventions submitted to the research ethics committee of University Hospital Bern, Switzerland, from 1988 to 1998
Sampling Strategy and Sample Size
451 of 531 study protocols (exclusion not competed by 2006, stopped prematurely, never started, rejected)
Selection Bias ++
Measurement Bias ++
Potential for Confounding
++
Analysis: Adjusting for Confounders
Adjusted for clinical specialty, type of study, planned sample size, number of centers involved, and international collaboration
Results Non-commercial funding, OR
2.42 (1.14-5.17), was associated with a full publication
Internal Validity Fair
Generalizability Poor/Fair
36 References
1. Buchkowsky SS, Jewesson PJ. Industry sponsorship and authorship of clinical trials over 20 years. Ann Pharmacother [Internet]. 2004 Apr;38(4):579-85.
2. Whittington CJ, Kendall T, Fonagy P, Cottrell D, Cotgrove A, Boddington E. Selective serotonin reuptake inhibitors in childhood depression: Systematic review of published versus unpublished data. Lancet [Internet]. 2004 Apr 24;363(9418):1341-5.
3. Davidoff F, DeAngelis CD, Drazen JM, Nicholls MG, Hoey J, Hojgaard L, Horton R, Kotzin S, Nylenna M, Overbeke AJ, Sox HC, Van Der Weyden MB, Wilkes MS. Sponsorship, authorship, and accountability. N Engl J Med [Internet]. 2001 Sep 13;345(11):825,6; discussion 826-7.
4. Owens DK, Lohr KN, Atkins D, Treadwell JR, Reston JT, Bass EB, Chang S, Helfand M. Grading the Strength of a Body of Evidence When Comparing Medical Interventions In: Methods Guide for Effectiveness and Comparative Effectiveness Reviews. [Internet]. Rockville (MD): ; 2008
5. Als-Nielsen B, Chen W, Gluud C, Kjaergard LL. Association of funding and conclusions in randomized drug trials: A reflection of treatment effect or adverse events? JAMA [Internet]. 2003 Aug 20;290(7):921-8.
6. Bekelman JE, Li Y, Gross CP. Scope and impact of financial conflicts of interest in biomedical research: A systematic review. JAMA [Internet]. 2003 Jan 22-29;289(4):454-65.
7. Bourgeois FT, Murthy S, Mandl KD. Outcome reporting among drug trials registered in ClinicalTrials.gov. Ann Intern Med [Internet]. 2010 Aug 3;153(3):158-66.
8. Ross JS, Mulvey GK, Hines EM, Nissen SE, Krumholz HM. Trial publication after registration in ClinicalTrials.gov: A cross-sectional analysis. PLoS Med [Internet]. 2009 Sep;6(9):e1000144. 9. von Elm E, Rollin A, Blumle A, Huwiler K, Witschi M, Egger M. Publication and non-publication of clinical trials: Longitudinal study of applications submitted to a research ethics committee. Swiss Med Wkly [Internet]. 2008 Apr 5;138(13-14):197-203.
10. Bhandari M, Busse JW, Jackowski D, Montori VM, Schunemann H, Sprague S, Mears D, Schemitsch EH, Heels-Ansdell D, Devereaux PJ. Association between industry funding and statistically significant pro-industry findings in medical and surgical randomized trials. CMAJ [Internet]. 2004 Feb 17;170(4):477-80. 11. Clifford TJ, Barrowman NJ, Moher D. Funding source, trial outcome and reporting quality: Are they related? results of a pilot study. BMC Health Serv Res [Internet]. 2002 Sep 4;2(1):18.
12. Lexchin J, Bero LA, Djulbegovic B, Clark O. Pharmaceutical industry sponsorship and research outcome and quality: Systematic review. BMJ [Internet]. 2003 May 31;326(7400):1167-70.
13. De Angelis C, Drazen JM, Frizelle FA, Haug C, Hoey J, Horton R, Kotzin S, Laine C, Marusic A, Overbeke AJ, Schroeder TV, Sox HC, Van Der Weyden MB, International Committee of Medical Journal Editors. Clinical trial registration: A statement from the international committee of medical journal editors. N Engl J Med [Internet]. 2004 Sep 16;351(12):1250-1.