Chongrui Zhang. Implementation and Usability Evaluation of an Electronic Health Record system based on patients' temporal visiting data. A Master’s Paper for the M.S. in I.S degree. April, 2016. 43 pages. Advisor: Javed Mostafa
Electronic Health Record (EHR) systems have become highly important in health care and consequently in Health Informatics research. Although, some advances have been made, users’ experience of modern commercial EHRs remain challenging at best and unsafe at worst. This paper implements a prototype of EHR system to visualize the history of patient visits in the context of psychiatric care. It reports on a usability study which compared the use of the simulated EHR system by subjects of various experience levels. The study has verified the importance of prior knowledge in the field of EHR. It proposes several suggestions to improve the usability of EHR systems by implementing a temporal data organization scheme to present critical data.
Headings:
IMPLEMENTATION AND USABILITY EVALUATION OF AN ELECTRONIC HEALTH RECORD SYSTEM BASED ON PATIENTS' TEMPORAL VISITING
DATA
by Chongrui Zhang
A Master’s paper submitted to the faculty of the School of Information and Library Science of the University of North Carolina at Chapel Hill
in partial fulfillment of the requirements for the degree of Master of Science in
Information Science.
Chapel Hill, North Carolina April 2016
Approved by
Table of Contents
Table of Contents ... 1
I.INTRODUCTION ... 2
II.LITERATURE REVIEW ... 4
1 Usability principles ... 4
2 Usability evaluation methods ... 5
III.METHODS ... 7
3 Data Sources ... 7
4 User Groups ... 8
5 System Design Strategies ... 9
6 Scenario-based Inspection ... 10
...6.1 Clinical Scenario 1: Review specific patient history. ... 11
...6.2 Clinical Scenario 2: Examine patient condition. ... 12
...6.3 Clinical Scenario 3: Examine patient treatment. ... 14
...6.4 Clinical Scenario 4: Combine rating with treatment as diagnosis. .... 14
...6.5 Clinical Scenario 5: Relate assessment to previous visits. ... 15
...6.6 Clinical Scenario 6: Diagnose from detailed visiting records. ... 16
...6.7 Clinical Scenario 7: Prescribe medications based on drug history. ... 17
IV.USABILITY TESTING REPORT ... 18
7 Findings of Pretest Questionnaire ... 18
8 Findings of In-Test Questionnaire ... 21
...8.1 Task 1: Review specific patient history. ... 22
...8.2 Task 2: Examine patient condition. ... 23
...8.3 Task 3: Examine patient treatment. ... 23
...8.4 Task 4: Combine rating with treatment as diagnosis. ... 24
...8.5 Task 5: Relate assessment to previous visits. ... 24
...8.6 Task 6: Diagnose from detailed visiting records. ... 24
...8.7 Task 7: Prescribe medications based on drug history. ... 25
9 Findings of Post-test Questionnaire ... 25
V.IMPLICATIONS FROM USABILITY TESTING ... 27
BIBLIOGRAPHY ... 29
APPENDIX I.PRETEST QUESTIONNAIRE ... 31
APPENDIX II.TEST QUESTIONNAIRE ... 33
I.
I
NTRODUCTIONElectronic Health Record (EHR) systematically collects, stores and visualizes patient health information in a digital format. EHR is being increasingly adopted by health care industries in order to facilitate physicians to effectively and efficiently access patients' demographic, medication and visiting records. However, some existing EHR systems on the market are so complex that most of the EHR practitioners would find it difficult to seek information with the technology; the usability of EHR system has already become a challenge, even though it is “possibly the most important factor hindering widespread adoption of EHR” [1]. Thus, the area of this paper would mainly focus on designing an EHR system based on patients' temporal visiting histories and analyzing the outcomes from related usability evaluation.
This study has implemented a web-based EHR system, which supports presenting patient visits data in a temporal way and facilitates choosing granularity of time range to view all records on a more centralized interface. It addresses the concerns of implementation of a full-stack EHR, including both back-end, fulfilled by relational database, and an
II.
L
ITERATURER
EVIEW1
Usability principles
Several papers ([1], [2], [3], [4], [5]) have pointed out the gist for designing usability studies. As pointed out by [1], usability principles are increasingly prevalent since they could guide health information technology researchers to develop user-centered outcomes and to clearly articulate design issues in current applications. Some of the principles, such as “simple, natural, minimizing cognitive load and effective information presentation”, are rightly helpful to this study's usability tasks planning step.
[5] proposes a definition of user-centered systems design (UCSD) as a process focusing on usability throughout the entire development life cycle. It also describes the results of applying the findings into real software development projects, leading to several
2
Usability evaluation methods
Usability evaluation methods are developed to guide each phase of designing human- information interactive systems. Since each approach would have its specific range of influence and effect, it is important to review other research articles, thus
selecting the most appropriate ones to EHR design process.
[6] has presented a case study to track issues predicted by several methods, including
“Claims Analysis”, “Cognitive Walkthrough”, “GOMS”, “Heuristic Evaluation”, “User
Action Notation” and “Specification”. The study compared predictions with results of
user tests, coming up with a substantial statement that, usability tests should expose
problems and lead to design changes to motivate the programmers to modify codes. Also
it proposed a framework called “Effectiveness Tree” to evaluate usability methods'
predictive performance. This is undoubtedly helpful in selecting usability
measurement for EHR, based on which decisions can be made regarding modifications necessary to the user interface.
[2] gave out a toolkit of conventional usability test methods employed most frequently in
EHRs. By identifying and describing each method with consideration of EHR settings, it
to provide quantitative or qualitative results as summary. It allowed us to choose scenario-based inspection as a means to collect quantitative data.
III.
M
ETHODSThis chapter will discuss both the data sources for system development and the user groups selected to participate usability testing. Then it will present an application of scenario-based inspection as well as a heuristic approach through questionnaire.
3
Data Sources
Though the first chapter has mentioned that, some sensitive information, such as patients' demographic information, prescriptions on medications and drugs and visiting notes composed by doctors, will be essential to the system's major functionality, however, the main purpose of this research is merely an implementation of EHR to visualize this information and a usability testing to evaluate the designs. Therefore, it is ensured that all data records in database will be artificially generated to mimic real situations, thus no practical and sensitive data or inputs will be actually required. On the other hand, the usability testing phase would collect subjects’ feedback on UI design and functionality, in the formatting of surveys and ratings. They are simply used for developers to evaluate the usability of the system, thus improving design and organization. Meanwhile, the tests have informed them not to disclose their personal information prior to the experiment.
EHR systems have already integrated it directly. This EHR system will also provide information regarding medicine categories and drug names with the help of this public information.
The database will also store a critical scale called the Clinical Global Impressions (CGI). CGI was designed to provide a stand-alone assessment of the patient's functioning through medical inspections [13]. It can provide physicians an overall summary on the patient's condition accompanied by each visit. The CGI scores will be the core values to be visualized through time line; by observing a series of historical CGI scores, physicians can thus generate his or her own professional judgment and knowledge on the patient's therapy and progress. For the convenience of usability study, several visiting records, as well as their related CGI scores will be simulated to approach real-world medical circumstances.
4
User Groups
This study has invited user groups from two different backgrounds to join the
experimentation. First, this research would fit into the perspectives of clinician users, including physicians, nurses, pharmacists, physical therapists, respiratory therapists and medical students who are getting practical training on EHR systems [1]. Their
professional experience would obviously provide valuable opinions into both the
The experiment's second user group has invited three graduate-level students who have been trained on human-information interaction and usability testing. They can also provide unique judgment on the overall performance and easiness to seek information and describe their information needs in a more scientific way; they will be considered as amateur due to their lack of medical background.
We invited 3 medical researchers and students who have relations to the medical school of University of North Carolina at Chapel, as well as 3 graduate-level students from the School of Information and Library Science, to participate the usability study. As for the next section, some more technical specifications will be discussed.
5
System Design Strategies
This is a Full-Stack EHR project that the developer is responsible for end-to-end designs, implementation, testing, documentation, and delivery of all the services. In general, the application is following MVC design pattern and RESTful architectural style, utilizing a Java framework called “Play framework”, which is a lightweight, stateless and web-friendly architecture that can backup highly scalable applications. The project is based on RESTful web application because some front-end techniques such as JavaScript libraries can provide fruitful choices to deploy time-line based visualization. The technical
specification of this EHR will be briefly introduced according to the Models, Viewers and Controllers, i.e. the MVC pattern.
The models store data in the format of relational database management system (RDBMS) that can be retrieved by commands and requests from controller. One thing to note is that the relations or tables in back-end can be accessed from an object-oriented language, say Java, with the technique of Object-relational mapping (ORM). The ORM layer facilitates developing classes and objects persistent to the fields of each relation in database.
Views
The views will interact with end users and represent all information based on changes in models. This is critical to the effectiveness for user groups to judge the usability of the system. This project has applied a dynamic and browser based visualization library called “vis.js” [8]; this library has provided easy manipulation on temporal data to display a customizable and interactive time-line. Some other techniques such as Bootstrap [9] template, jQuery [10] and AJAX are also helpful in data representation.
Controllers
The controllers will send requests to the models to update the models' state and will send requests to associated views to change presentation of the model. All these requests will be built through RESTful web services and thus resources can be identified, related and transferred easily through HTTP protocols.
6
Scenario-based Inspection
overall patient health conditions, i.e. CGI scores. The experiment will guide user groups to become familiar with the UI and the functionality of the EHR system through several step-by-step tasks. Each task has been purposefully designed to evaluate a certain part of system functions; the task is also an appropriate representation of medical working practices. By conducting these tasks, the users are required to answer some questions through a questionnaire thus helping the study to quantitatively analyze the clearness and easiness of functionality. This section will explain these key EHR tasks in detail.
...6.1 Clinical Scenario 1: Review specific patient history.
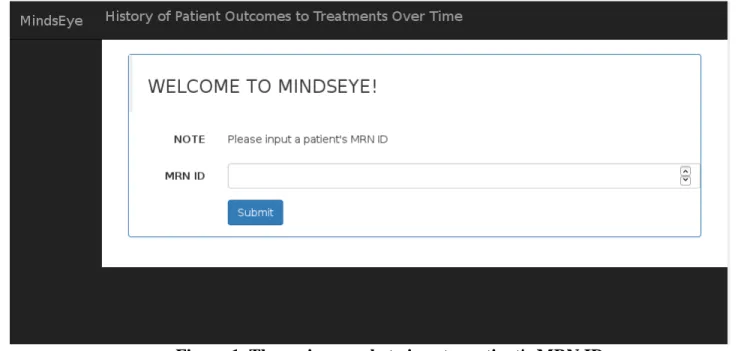
In this initial scenario, users are guided to input a given patient's ID and look up his or her demographic and diagnosis information on the dashboard.
Task 1: Enter a patient's MRN ID number (e.g. 15).
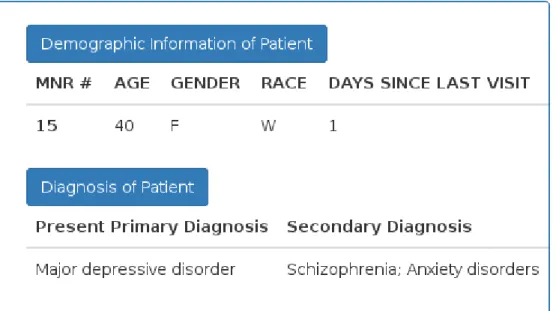
Task 2: Identify the patient by age, gender and race.
Task 3: Identify all current co-morbid diagnosis of the patient.
Figure 2. The section on dashboard for patient's demographic and diagnosis data
...6.2 Clinical Scenario 2: Examine patient condition.
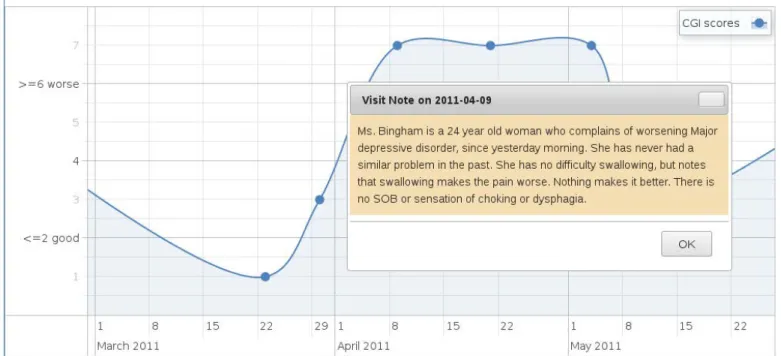
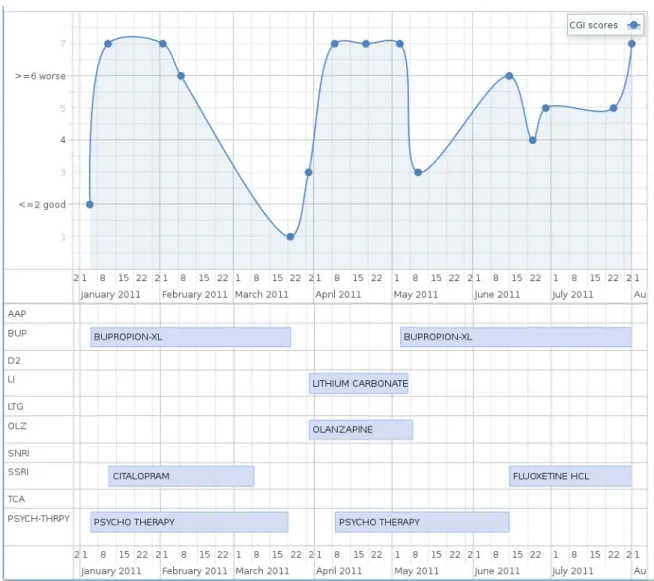
During the usability study, the users would be asked to scroll back and forth through the Graph View and give out some feedback concerning this representation of all CGI scores. For example, they will be asked questions like “What is the CGI score for the visit on January 12, 2011?” and make inference about “Is this patient doing better or worse than his/her last visit based on the CGI score for the visit on May 4, 2011?”. By hovering mouse over each point on the Graph View, physicians can also view the visiting notes written for each unique visit in a much straightforward action, without redirection to other pages or isolation to the work flow.
Task 1: Locate the Graph View.
Task 2: Identify the CGI scores on a specific visit.
Task 3: Infer whether the patient is making better or worse.
Figure 3. The Graph View of CGI scores by a patient. The x-axis denotes time-line
while the y-axis denotes CGI scores. Each point on the curve is a visit.
Figure 4. The visiting note accompanied by each visit. The panel will be displayed
...6.3 Clinical Scenario 3: Examine patient treatment.
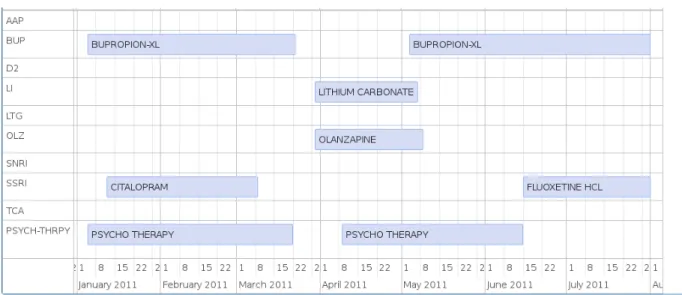
Users can drag left/right on the Time-line View to get all drugs and therapies over time. Task 1: Locate the Time line View.
Task 2: Identify the latest or current treatment of that patient.
Figure 5. The Time-line View to show all treatment over time.
...6.4 Clinical Scenario 4: Combine rating with treatment as diagnosis.
In this scenario, users will face a scenario to select a treatment that the patient responded MOST well to, which is common to decision making process of clinicians.
Task 1: Locate both the Graph and the Time line View.
Figure 6. Combination view of Graph and Time-line on dashboard.
...6.5 Clinical Scenario 5: Relate assessment to previous visits.
The EHR should enable physicians to generate knowledge from the assessment history, including how often does the patient have the medications during the period of time, when she might stop taking them, what are the possible side-effects and extra conditions based on historic data. The users would test on this EHR and answer questions about if they are at ease to interact with this part to list all previous visits in a tabular form. Task 1: Select the tabular option.
Task 3: Identify the CGI score and visiting note associated with this visit.
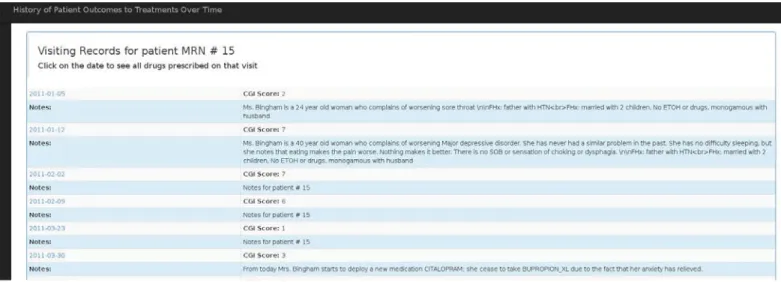
Figure 7. A tabular view of all visiting records for a specific patient over time.
...6.6 Clinical Scenario 6: Diagnose from detailed visiting records.
This test case serves as listing the details of medications prescribed on a particular visit. Task 1: Pick dates to view all medicines and therapies prescribed till the date.
Task 2: Identify drug name, classification, start date and end date.
...6.7 Clinical Scenario 7: Prescribe medications based on drug
history.
It is also vital for the physicians to prescribe medication for their patients. Though this EHR don't support order placement, it can still serve as taking record of prescriptions, accompanied by each visit. Users would also conduct this task and tell if this would be relevant to their working routines.
Task 1: Click on Dashboard button on left navigation bar.
Task 2: Click to view all medication history of this patient.
Task 3: Identify all drugs and medications records.
IV.
U
SABILITYT
ESTINGR
EPORTAccording to [3], how well an EHR serves the medication tasks in a complex clinical environment is the direct result of its interface, through collecting, organizing and presenting patient information. And the work-flows of EHR are closely aligned with that interface to serve clinical users. This chapter thus would summarize the feedback from users and evaluate the implications from experiment. It will be organized in the following order: the pretest, in-test and post-test.
7
Findings of Pretest Questionnaire
Sample Size: 3 researchers or students with medical background Q1. PRIMARY AREA OF PRACTICE
Figure 10. Pretest result - What is your primary area of practice?
Q2. PROFESSIONAL EXPERTISE
Q3. FREQUENCY TO WORK WITH HER?
Figure 12. Pretest result - How often do you work with patient's EHR?
Q4. THE RATING SCALE TO QUANTIFY PATIENT’S PROGRESS FROM VISIT TO VISIT
Figure 13. Pretest result - What is the rating scale you use to quantify your patient's
8
Findings of In-Test Questionnaire
This section will summarize the findings from the survey that is designed to ask users several questions concerning information seeking and decision making through their exploration on the screen. The tasks were completed according to the order of the seven scenarios presented earlier. After completing the tasks, users were requested to rate the ease of use.
The charts will present analysis on errors and the ease of rating. The results will be reported in two parts, representing the two separate user groups.
Sample Size: 3 researchers or professionals with medical background
Sample Size: 3 students outside of medical field but with experience of usability testing
Figure 15. Counting for errors and Rating for easiness on the seven-scenario tasks
from the amateur user group.
...8.1 Task 1: Review specific patient history.
...8.2 Task 2: Examine patient condition.
Q4: What is the patient's current co-morbid diagnosis?
Some issues came up with this question because students from information school did not understand the meaning of co-morbid diagnosis, thus they might raise questions about it. The first user groups had no such issue.
...8.3 Task 3: Examine patient treatment.
Q6: Based on the CGI score for the visit on May 4, 2011, is this patient doing better or worse than his/her last visit?
For this task 3, there was one common mistake among both of the professional and amateur teams. Most users would lack prior knowledge of CGI scales, which was also revealed by the pretest survey; but one of the trickiest part of CGI is that, the higher the score is, the worse is the condition of that patient. It is undoubtedly counter-intuitive.
In one case, two testers, one physician and one student had both noticed a minor curve between the two points on the chart, instead of the fact that they were still same values. The curve was just a decoration but it added risk of false interpretation. In another case, one simply misinterpreted the statement of “doing better” as higher score; he did not try to connect the previous data points as a clue. It is suggested that the performance might be better if another group of two visits, with larger difference in CGI, could be selected as questions.
All of the three professional users had given positive feedback on finding visiting notes with the Graph View directly; it is “straightforward” and “helpful” to just hover the mouse on that point on the line chart as a visit, and then concentrate on the overall trend of patient’s condition. They had complained about some workarounds with their current EHR systems where viewing visiting notes are isolated on additional pages and they had to navigate back and forth to view multiple notes on a time line. But some users had provided a precious suggestion that it would be even better to close the panel after mouse leaving the data point. This will be adopted into further refinement on the UI as next step.
...8.4 Task 4: Combine rating with treatment as diagnosis.
Q9: Select a treatment that the patient responded MOST well to:
This question was designed to ask for diagnosis and judgment on treatment. Compared with amateur students outside of this field, the first user group was better at synthesizing both CGI scores and medication histories. It again proved the importance of prior
knowledge to interact with the system and to guide further information behaviors in the context of EHR.
...8.5 Task 5: Relate assessment to previous visits.
This task simply listed all visiting history of the patient in tabular form and asked for a specific CGI score. Neither group has made any error.
...8.6 Task 6: Diagnose from detailed visiting records.
Q6: Identify all groups of drugs that were prescribed till that date.
records, including the drugs that were no longer prescribed, should be checked. The study considers it a limitation in designing the questions and would replace the words in future.
...8.7 Task 7: Prescribe medications based on drug history.
This task simply listed all medications, drugs and therapies for the patient. Neither group has made any error.
9
Findings of Post-test Questionnaire
In general, the first user group of professionals in health informatics area would give more positive ratings on this EHR; where the latter group of information school graduates would disagree more on details such as UI design and layout.
The length of time to finish the overall test, including three surveys, would take around 10 to 20 minutes for both teams. It might indicate that the EHR system, as well as the guidance through this questionnaire, is not too complicated to new users and that its major functionality is easy to learn and operate. Most users would rate the tasks from the questionnaires as “straightforward”.
Sample Size: 6 users who have participated the usability testing phase.
V.
I
MPLICATIONS FROMU
SABILITYT
ESTINGAs a summary, this study has implemented a web-based EHR system to present temporal patients’ visiting data. It also invited two groups of users to participate a usability test. The usability evaluation compared the findings between the professional and the amateur groups. Here are some implications that can be inferred from that usability phase.
Our hypothesis was the lack of health science knowledge will become a barrier in answering the survey questions and it will likely decrease the accuracy associated with assessing diagnosis. For example, students from information school have made more errors due to the erroneous interpretation on the CGI scores. This also seems to be a required knowledge for the first group to judge the condition of a certain patient. As another example shows, experience on diagnosis would contribute to the formation of the assessment by combining both conditions and treatment.
Next, it is a milestone, according to some professionals, to have a mouse-hover effect on displaying visiting notes through the visual graph of all visits. But it is better to close the panel after mouse-leaving that point, as an improvement to visualization.
likely to make decisions on prescriptions not just based on duration of drug use but also the frequency of use. In that case, it is proposed that the EHR system will modify both database storage and UI representation in future.
B
IBLIOGRAPHY1. Belden, J. L., Grayson, R., & Barnes, J. (2009). Defining and testing EMR usability: Principles and proposed methods of EMR usability evaluation and rating. Healthcare Information and Management Systems Society (HIMSS).
2. Johnson, C. M., Johnston, D., & Crowle, P. K. (2011). EHR Usability Toolkit: A Background Report on Usability and Electronic Health Records. Rockville, MD: Agency for Healthcare Research and Quality.
3. Armijo, D., McDonnell, C., & Werner, K. (2009). Electronic health record usability: evaluation and use case framework. AHRQ Publication, (09), 10.
4. Edwards, P. J., Moloney, K. P., Jacko, J. A., & Sainfort, F. (2008). Evaluating usability of a commercial electronic health record: A case study. International Journal of Human-Computer Studies, 66(10), 718-728.
5. Gulliksen, J., Göransson, B., Boivie, I., Blomkvist, S., Persson, J., & Cajander, Å. (2003). Key principles for user-centred systems design. Behaviour and Information Technology, 22(6), 397-409.
6. John, B. E., & Marks, S. J. (1997). Tracking the effectiveness of usability evaluation methods. Behaviour & Information Technology, 16(4-5), 188-202.
7. The Physicians' Desk Reference (PDR) http://www.pdr.net/, a commercially published compilation of manufacturers' prescribing information on prescription drugs. (reference of definition from wikipedia: https://en.wikipedia.org/wiki/Physicians'_Desk_Reference) 8. vis.js: http://visjs.org/, a dynamic, browser based visualization library.
9. Bootstrap: http://getbootstrap.com/, a popular HTML, CSS, and JS framework for developing responsive projects on the web.
10. jQuery: https://jquery.com/, a fast and feature-rich JavaScript library for HTML document traversal and manipulation, event handling, animation and Ajax.
12. Rosson, M. B., & Carroll, J. M. (2009). Scenario based design. Human-computer interaction. Boca Raton, FL, 145-162.
13. Busner, J., & Targum, S. D. (2007). The clinical global impressions scale: applying a research tool in clinical practice. Psychiatry (Edgmont), 4(7), 28.
14. Viitanen, J., Hyppönen, H., Lääveri, T., Vänskä, J., Reponen, J., & Winblad, I. (2011). National questionnaire study on clinical ICT systems proofs: physicians suffer from poor usability. International journal of medical informatics, 80(10), 708-725. 15. Peuteª, L. W., & Spithovenª, R. (2008). Usability studies on interactive health
information systems; where do we stand? In EHealth Beyond the Horizon: Get IT There: Proceedings of MIE2008, the XXIst International Congress of the European Federation
A
PPENDIXI.
P
RETESTQ
UESTIONNAIRE1. What is your primary area of practice
_____Psychiatry
_____Internal Medicine _____Family Practice _____Pediatrics
_____Other, please specify
2. What is your Professional expertise?
_____PGY-1 _____PGY-2 _____PGY-3 _____PGY-4
_____Attending ≤ 5 yrs _____Attending 5-9 yrs _____Attending ≥ 10 yrs _____Other, please specify
3. How often do you work with patient's electronic health records?
4. What is the rating scale you use to quantify your patient's progress from visit to
visit? Please check all that apply:
_____None
_____Montgomery-Ashberg Depression Rating Scale _____Hamilton Rating Scale
_____Carroll Rating Scale
_____Clinical Global Impression Ratings _____Beck Depression Inventory
A
PPENDIXII.
T
ESTQ
UESTIONNAIRETask 1
Please enter the patient's MRN ID number: 15, and then identify the patient by answering the following questions:
1. Age (check the category that applies)
_____Under 12 years’ old _____12-17 years’ old _____18-24 years’ old _____25-34 years’ old _____35-44 years’ old _____45-54 years’ old _____55-64 years’ old _____65-74 years’ old _____75 years old or older
2. Gender
_____Male (M) _____Female (F)
3. Race (check the category that applies)
_____White (W)
_____Hispanic or Latino (H)
_____Black or African American (B)
_____Unknown (U)
How easy was it to complete Task 1?
_____Very Easy (5) _____Easy (4) _____Neutral (3) _____Hard (2) _____Very Hard (1)
Task 2
4. What is the patient's current co-morbid diagnosis? Please check all that apply:
_____Anxiety disorder
_____Borderline personality disorder _____Bipolar disorder
_____Eating disorders
_____Major depressive disorder _____Obsessive compulsive disorder _____Panic disorders
_____Schizophrenia
_____Substance/Medication-induced depressive disorder _____None
How easy was it to complete Task 2?
_____Very Easy (5) _____Easy (4) _____Neutral (3) _____Hard (2) _____Very Hard (1)
5. Please look closely at the Graph View of CGI curves. What is the CGI score for
the visit on January 12, 2011? (You may drag left/right, scroll back/forth and hover
mouse over each data point on the Graph View)
_____1 _____2 _____3 _____4 _____5 _____6 _____7
6. Please look closely at the Graph View of CGI curves. Based on the CGI score for
the visit on May 4, 2011, is this patient doing better or worse than his/her last visit?
Please note that the higher the CGI score is, the worse the patient is. (You may drag
left/right, scroll back/forth and hover mouse over each data point on the Graph
View)
_____Improved _____Remains the same _____Doing worse
Physicians would usually record a patient “visiting note” related with each unique
visit. Please answering the following questions. (You may drag left/right, scroll
back/forth and hover mouse over each data point on the Graph View)
7. Where would you find this patient's visiting note on January 12, 2011? (check the
category that applies)
_____Patient demographic information area
_____Patient co-morbid diagnosis information area _____Data point on the Graph View
How easy was it to complete Task 3?
_____Very Easy (5) _____Easy (4) _____Neutral (3) _____Hard (2) _____Very Hard (1)
Task 4
8. What is the patient's CURRENT/LATEST treatment groups? Please check all
that apply: _____Psychotherapy _____AAP _____BUP _____D2 _____LI _____LTG _____MRT _____OLZ _____RIS _____SNRI _____SSRI _____TCA
9. Please select a treatment that the patient responded MOST well to:
_____BUPROPION-XL, CITALOPRAM, Psychotherapy _____LITHIUM CARBONATE, OLANZAPINE
_____BUPROPION-XL, FLUOXETIME HCL
How easy was it to complete Task 4?
_____Easy (4) _____Neutral (3) _____Hard (2) _____Very Hard (1)
Task 5
10. Please move to the top of the current dashboard. Click the first link to view all
visiting history of this patient in tabular form. What is the CGI score for the visit on
June 24, 2011?
_____1 _____2 _____3 _____4 _____5 _____6 _____7
How easy was it to complete Task 5?
_____Very Easy (5) _____Easy (4) _____Neutral (3) _____Hard (2) _____Very Hard (1)
Task 6
11. Please find the row of records on May 11, 2011. Click on the date and identify all
groups of drugs that were prescribed till that date:
_____Psychotherapy _____AAP
_____LI _____LTG _____MRT _____OLZ _____RIS _____SNRI _____SSRI _____TCA
How easy was it to complete Task 6?
_____Very Easy (5) _____Easy (4) _____Neutral (3) _____Hard (2) _____Very Hard (1)
Task 7
12. Please click on the Dashboard on the left navigation bar and return to the
dashboard page. Click the link to view all medication history of this patient. Please
count total numbers of drugs and medications prescribed for this patient.
_______________
How easy was it to complete Task 7?
A
PPENDIXIII.
P
OST-
TESTQ
UESTIONNAIRE1. The demographic information of the patient is easy to locate:
_____Strongly agree _____Agree
_____No opinion _____Disagree
_____Strongly disagree
2. The patient's current diagnosis information is easy to locate:
_____Strongly agree _____Agree
_____No opinion _____Disagree
_____Strongly disagree
3. In “Graph View”, the learning curve of the CGI chart is minimum:
_____Strongly agree _____Agree
_____No opinion _____Disagree
_____Strongly disagree
4. In “Timeline View”, the learning curve to view all prescriptions and therapies is
minimum:
_____No opinion _____Disagree
_____Strongly disagree
5. I am comfortable that this interface uses medication groups instead of individual
medication for patient treatment or therapy.
_____Strongly agree _____Agree
_____No opinion _____Disagree
_____Strongly disagree
6. Which data view is the most helpful in terms of helping you make clinical decision
for the patient treatment. Please check all that apply:
_____Graph View _____Timeline View
_____All Visiting Records of a patient View _____All Medication Records of a patient View _____All Medication Records of a visit View
7. The color and UI design of this interface is intuitive and easy for navigation:
_____Strongly agree _____Agree
_____No opinion _____Disagree
_____Strongly disagree
8. The texts, characters and highlighting on the screen is user-friendly:
_____Strongly agree _____Agree
_____Disagree
_____Strongly disagree
9. The layout of information on the system screens was clear and matches the
clinician's workflow:
_____Strongly agree _____Agree
_____No opinion _____Disagree
_____Strongly disagree
10. How long have you worked on this system?
_____≤10 minutes _____10-20 minutes _____20-30 minutes _____≥30 minutes
11. The use of terminology throughout the system relates well to the work you are
doing:
_____Strongly agree _____Agree
_____No opinion _____Disagree