Acknowledgements
Abstract
Background: Obesity is associated with increased risk and poor prognosis of triple negative breast cancer (TNBC), a highly aggressive subtype of breast cancer with high rates of metastasis and recurrence. Previous research from our lab showed calorie restriction (CR) has an antitumorigenic effect against TNBC, although mechanisms remain unclear. We hypothesize that CR may facilitate this anticancer effect, at least in part, via upregulation of microRNA (miR)-15b and subsequent disruption of IGF-1 system activation.
Methods: cBioPortal, TargetScan, miRTarBase, and various TCGA data sets were utilized to conduct in silico analysis of potential genes and target pathways associated with miR-15b expression, especially along the PI3K/Akt/mTOR pathway. To mimic caloric restriction in vitro, M6 and M6C cells derived from the C3-Tag series progression cell were treated with several nutrient restricted medias including reduced serum, BMS754807 (inhibitor of IGF1-R), IGF-1, and different combinations of these three conditions. To characterize the impact of caloric restriction on these cells and their potential mechanistic action, qPCR was performed on miRNA and mRNA collected to determine fluctuations in levels of miR-15b and IGF1-R.
Results: The qPCR analysis performed in vitro did not yield any statistically significant results demonstrating the impact of caloric restriction on miR-15b or IGF1-R. However, in silico analyses revealed that miR-15b overexpression in human breast tumors was associated with increased expression of genes associated with regulation of breast cancer cell proliferation, while decreased miR-15b was associated with enhanced growth factor signaling and epithelial-to-mesenchymal transition.
Introduction
Triple-negative breast cancer lacks adequate molecular targets. The most diagnosed cancer in women and the second-most deadly only behind lung cancer, breast cancer is a highly devastating disease that impacts every 1 in 8 women born in the United States (1,2). Comprising approximately 20% of diagnosed breast cancers, triple negative breast cancer (TNBC) is a highly aggressive breast cancer subtype with a greater potential to metastasize and recur than all other subtypes. While the five-year survival rate for other subtypes averages at 93%, the five-year survival rate for TNBC is only 77% (3). Additionally, black women are twice as likely to be diagnosed with TNBC than white women (4). The prognosis for TNBC is particularly devastating because it lacks the three molecular targets that can be inhibited by hormone-targeted therapies (estrogen, progesterone, and HER2/neu receptors), leaving patients no other option than undergoing the traditional yet physically harmful process of cytotoxic chemotherapy (5). Because of the numerous negative side-effects associated with chemotherapy treatment such as anemia, severe fatigue, and alopecia, and the known disparities in disease burden across racial and ethnic groups, researchers have long sought more effective, alternative treatments with fewer adverse effects.
for a patient (8). Additionally, obesity has been shown to drive indicators of poorer prognoses such as tumor size, tumor grade, and metastasis (9). It is also known to play a role in increasing several pro-inflammatory pathways that can contribute to heterogeneity within the tumor microenvironment by maintaining cancer stem cell populations, leading to tumor development and invasion (10).
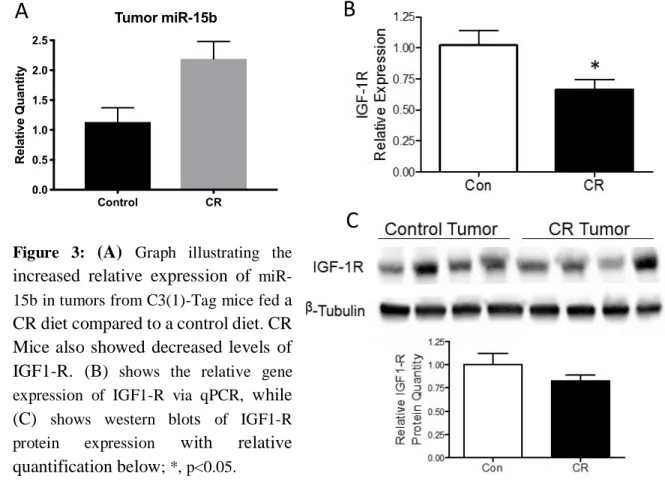
One therapeutic avenue that has shown promise in treatment of TNBC while reducing the consequences of cytotoxic chemotherapy is dietary caloric restriction (CR). In CR, a patient receives complete nutrition while reducing calorie intake (11). Previous studies in the Hursting lab have indicated that CR diets in mouse models of TNBC not only significantly improve the length of tumor-free survival and overall survival of mice, but also decrease total tumor count and average secondary tumor weight (12). This data is shown in figure 1.
IGF signaling is vital to cancer development. Synthesized in the liver, IGF-1 is a peptide hormone integral to mediating somatic development initially stimulated by growth hormone, and is especially important in regulating the cell cycle process. CR in both humans and animal models decreases circulating levels of IGF-1 (Figure 2). IGF-1 functions by binding to insulin-like growth factor 1 receptor (IGF-1R) to activate the phosphatidylinositol-3 kinase (PI3K)/Akt pathway, which controls multiple downstream mediators such as the mammalian target of rapamycin (mTOR). This tyrosine kinase receptor cascade pathway is vital to maintaining appropriate nutrient levels to control development, protein synthesis, and overall survival in the cell (14). IGF signaling is important in tumor development
because it increases cell proliferation while inhibiting apoptosis in cancer cells. Additionally, IGF signaling is frequently high in patients whose lifestyles are characterized by minimal exercise and dietary choices high in fat and animal proteins (15).
strong determinants of a patient’s prognosis following diagnosis with triple negative breast cancer (19).
pathway to enhance proliferation, growth, survival, and development of TNBC cells. TNBC’s deadly progression has a clear correlation with obesity, and it is paramount that the mechanism by which CR and mIR-15b operate is understood in order to instill a more effective treatment regimen.
Tumor miR-15b Control CR 0.0 0.5 1.0 1.5 2.0 2.5 R el at iv e Q u an ti ty
Figure 3: (A) Graph illustrating the increased relative expression of miR-15b in tumors from C3(1)-Tag mice fed a CR diet compared to a control diet. CR Mice also showed decreased levels of IGF1-R. (B) shows the relative gene
expression of IGF1-R via qPCR, while
(C) shows western blots of IGF1-R
protein expression with relative
quantification below; *, p<0.05.
A
Goals and Hypotheses
The goal of this project is to determine the role that miR-15b plays in the relationship between caloric restriction and triple-negative breast cancer in order to better understand the mechanisms underlying breast cancer development and metastasis. A more comprehensive understanding of these processes could potentially lead to newer and safer treatment plans for patients with TNBC to avoid the detrimental consequences of cytotoxic therapy.
Aim 1. Identify predicted targets of miR-15b and global effects of miR-15b expression in silico
miRNAs are responsible for a diverse, global range of regulatory effects within the cell, as each miRNA is suspected to target hundreds of mRNAs, even though miRNAs themselves compose only 0.01 % of all total RNA (24,25). Fortunately, there are bioinformatic databases with resources that can provide predicted gene targets of miRNAs, published literature on experimentally validated miRNA-target interactions, and molecular pathways they may be involved with. Analysis of this data will reveal how miR-15b and its predicted targets are involved in the PI3K/Akt/mTOR pathway signaling and oncogenic signaling regulation overall.
Aim 2. Determine the relationship between IGF-1 system activation and miR-15b
Methods
Gene Expression Analysis
For each sample, total RNA was first isolated from cells with the use of TRIzol reagent from ThermoFisher Scientific, which was utilized according to the manufacturer’s instructions. The Omega Bio-Tek E.Z.N.A. Micro RNA Kit was used to extract pure fractions of both mRNA and miRNA simultaneously from the same samples with the use of spin columns according to the manufacturer’s protocol. Both concentration and quality of miRNA and RNA collected from each sample were analyzed with the use of a Nanodrop 2000 spectrophotometer. For miRNA, cDNA was synthesized using the TaqMan Advanced miRNA cDNA Synthesis Kit according to manufacturer’s instructions. For mRNA, cDNA was prepared using the Applied Biosystems High-Capacity cDNA Reverse Transcription Kit. qPCR reaction mixes were prepared using the TaqMan Universal Master Mix II paired with TaqMan Advanced miRNA assay (for miRNA) or TaqMan gene expression assay (for mRNA) in conjunction with RNase-free water and the synthesized cDNA. Assays were seeded in triplicate and run on an Applied Biosystems ViiA 7 Real-Time PCR system according to the instructions provided by the manufacturer. The Ct method was utilized to complete all relative expression calculations and generate an RQ value for each sample. The reference gene used for the miRNA analyses performed was miR-16-5p, while beta-actin as used for mRNA assays, as suggested by the manufacturer.
TargetScan/miRTarBase Analysis
context++ score measure of association, which ranks predictions based on their predicted targeting efficacy. Additionally, it scores targets with PCT (probability of conserved targeting), a measure that further ranks targets based on their probability of targeting the seed sequence of a miRNA, a highly conserved region across most species. Based on previous literature and studies done using target prediction databases for miRNAs (27,28), a cutoff score of -0.3 for context++ score was set and only values below this score were accepted as potential targets. For PCT, a cutoff score of 0.75 was used and only values above this were accepted as suitable targets. Using these parameters, the lists of predicted genes for the two mature forms of human and mouse miR-15b (hsa-miR-15b-5p, mmu-miR-15b-5p, hsa-miR-15b-3p, and mmu-miR-15b-3p) were filtered and compared. After this data was filtered, the narrowed list of potential gene targets was subject to further comparison in miRTarBase, a database that has stored more than 300,000 miRNA-gene target interactions that have been verified experimentally and published in the literature (29). In addition to miRTarBase analysis, the common gene targets of mmu-miR-15b-5p and hsa-miR-15b-5p obtained from TargetScan were also entered into the Database for Annotation, Visualization, and Integrated Discovery (DAVID) (29). DAVID performs a functional interpretation of entered gene lists to provide insight into which hallmark or oncogenic biochemical pathways the individual genes are a part of to determine the overall biological impact of changes in the gene list. It clusters separate genes into groups and shows the variety of pathways genes may be impacting along with the statistical significance of the probability that the pathway is being affected.
miR-15b Expression Correlation Analyses
anywhere in the world for statistical analysis (31). This pool of data sets contains information about many tumor samples from various institutions at different times to discern genomic, proteomic, and transcriptomic trends that may be facilitating cancer-causing processes. In this instance, TCGA analysis via MD Anderson’s collection of patient breast cancer tumor samples from their institutions was utilized in order to compare correlations in Reverse Phase Protein Array data (RPPA) and miR-15b expression along with correlations between miR-15b and Illumina RNA-sequencing (RNA-seq) data. By aligning the matrix data given for both RPPA and RNA-seq with miR-15b relative to breast cancer tumor samples, a protein list and gene list could both be generated and tested for significance of association with miR-15b. Lists were generated for both positive and negative correlating genes and proteins. Once significant gene and protein lists from the human tumor sample data were determined with the use of Pearson coefficient, T-value, p-value, and q-value statistics, the lists were each entered into DAVID to obtain functional interpretations of which pathways miR-15b may be playing a role in based on clustering and ranking of significant gene and protein groups. If results were insignificant, manual probing of the dataset was employed to examine lists and determine associations based on existing literature.
miR-15b Amplification Analyses
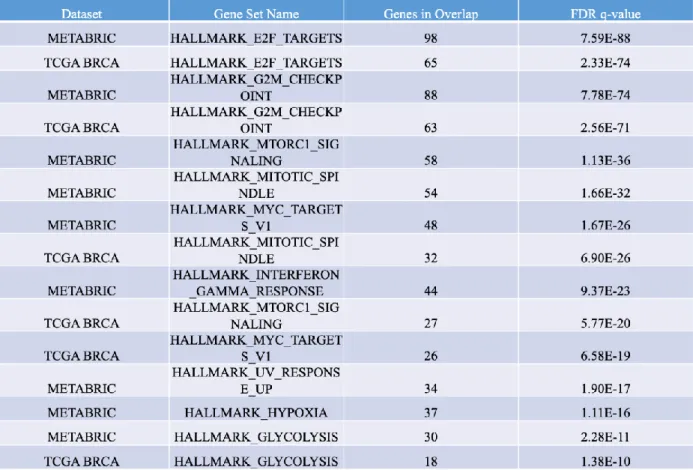
computational method to show statistically significant relationships or differences between two biological states of a set gene list (33). In this analysis, overexpressed genes and under expressed genes were separated into different pools to maintain proper directionality of data. Specifically, both the Hallmarks gene sets and the C3 gene sets were observed in order to examine overall changes and C3 miRNA-specific changes, respectively. A flowchart summary of analyses using TCGA and METABRIC data can be seen in Figure 4.
Cell Culture
M6 and M6C cell lines were utilized for all in vitro experiments. These cell lines were generated following isolation of tumors from the C3(1)-Tag spontaneous model. The C3(1)-Tag transgenic line models basal-like breast cancer, and both the M6 and M6C cluster basal-like as well. The M6 and M6C are part of a larger progression series. The M6 was isolated from a primary C3(1)-Tag lesion, while the M6C was isolated from a lung metastatic nodule following subcutaneous injection of M6 cells into a nude mouse. M6 and M6C cell lines were cultured in high-glucose (25 mM) DMEM media supplemented with 10% FBS, 25 mM HEPES, 100 U/mL Pen/Strep, 1 mM Sodium Pyruvate, and 2 mM glutamine (complete media/CM). In order to mirror caloric restriction in vitro, ~300,000 cells of each C3-tag line were seeded into 6 cm plates containing and treated with one of the following treated media conditions for 18 hours: CM, CM
Results
In Vitro Gene Expression Results
In order to characterize the role of caloric restriction on miRNA and mRNA involved in the PI3K/Akt/mTOR pathway in vitro, qPCR was utilized to profile relative expression of miR-15b and IGF1-R. It was hypothesized that miR-miR-15b would have an inverse relationship with the aggressiveness of a cell line and IGF-1R would positively correlate with a cell line’s aggressiveness based on previous pilot data. However, both qPCR of miR-15b and IGF1-R in various conditions of nutrient restriction revealed no significant differences in expression among cell lines. Results are displayed for miR-15b and IGF1-R expression in Figures 5A and 5B.
Figure 5A: Gene expression of miR-15b obtained via qPCR for both M6 (invasive carcinoma) and M6C (metastatic) cell lines.
Figure 5B: Gene expression of IGF1-R obtained via qPCR for both M6 (invasive carcinoma) and M6C (metastatic) cell lines.
CM CM+B
MS SS SS+B MS SS+B MS+ IG F-1 SS+I GF-1 0 1 2 3 miR-15b Expression Treatment R el at iv e ex p re ss io n M6 M6C CM CM+B
MS SS SS+B MS SS+B MS+ IG F-1 SS+I GF-1 0.0 0.5 1.0 1.5 IGF1R Expression Treatment R el at iv e ex p re ss io n M6 M6C
In Silico Target Prediction Results
Figure 6A: Alignment for potential gene targets of miR-15b in both mouse and human models based on both context++ score and PCT. The leftmost circle contains all the genes that met these criteria for humans, the rightmost circle contains all the genes that met these criteria for mice, and the middle overlap represents the number of genes in common between the two species.
Figure 6B: Alignment for potential gene targets of miR-15b in both mouse and human models based on context++ score. The leftmost circle contains all the genes that met these criteria for humans, the rightmost circle contains all the genes that met these criteria for mice, and the middle overlap represents the number of genes in common between the two species.
Table 3: cBioPortal analysis of significantly overexpressed hallmark pathways in tumor samples with miR-15b amplification.
Table 5: cBioPortal analysis of relative underexpression of IGF1-R in samples with miR-15b amplification compared to those without it
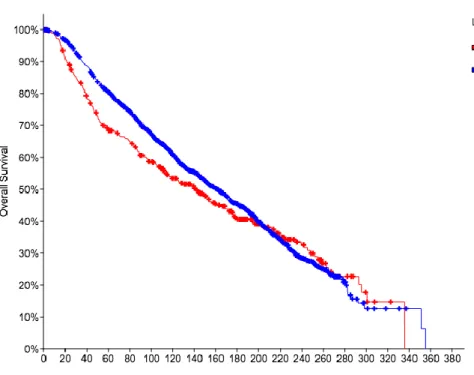
Figure 7: cBioPortal Analysis of the relationship between overall survival of breast cancer patients and relative IGF1-R expression. The red line indicates the decreased survival resulting from increased IGF1-R expression.
positively correlated and those negatively correlated, but manual clustering revealed positive association with cell cycle and proliferation and a negative association with growth factor signaling and breast cancer metastasis. These results are shown in Table 6. However, DAVID analysis of the significant gene lists positively and negatively correlating with miR-15b expression in samples had significant correlation with cancer development pathways. The results generally depict that miR-15b correlates with a down regulation of genes in growth-factor signaling processes and an upregulation of genes regulating cell proliferation. The pathways positively correlating with miR-15b expression are displayed in Table 7, and the pathways negatively correlating with miR-miR-15b expression are shown in Table 8.
Discussion
TargetScan/miRTarBase
Although the genes that miR-15b is predicted to target in both mouse and human models did not provide significant results when using TargetScan and miRTarBase, it has been recognized in previous literature that score prediction methods such as those of TargetScan should not be used so stringently when searching for potential gene-target interactions (34). When using cutoffs as a hard filter, there is potential for loss of real targets of miR-15b. This is because detection curves for matches to the conserved site initially increase at the same rate, but when conversed sites in the 5% most downregulated set are depleted, the detection rate for matches to the conserved site starts to level out. Therefore, a large number of downregulated targets (such as IGF1-R) can easily be missed when using these methods. These predictive scoring methods should be used in conjunction with other detailed measures.
Likewise, miRTarBase also should not be used as the only gauge of potential gene-target interactions. Although this database contains information from hundreds of thousands of miRNA functional studies, it is important to note that it only provides information on those that have been validated experimentally. Although it saves the researcher the burden of individually reviewing all relevant literature for a miRNA of interest, it is very possible that some of the predicted targets of miR-15b entered into miRTarBase simply have not been studied in enough detail yet. Therefore, it is unsurprising that miRTarBase was devoid of more information because it is likely that there are several more targets of miR-15b that simply lack experimental confirmation.
DAVID
Standardized Data Browser. It is likely that DAVID requires a large enough number of genes or proteins to be able to find significantly associated pathways because the RNA-seq data was comprised of 844 samples in comparison to the aligned RPPA proteins (92 samples) and the TargetScan gene list based on context++ score (41 samples).
However, manual clustering was still possible for the proteins significantly correlating both positively and negatively with miR-15b expression and these results were depicted in Table 6. This analysis revealed an upregulation of proteins involved with cell cycle and proliferation along with a downregulation of proteins involved in growth factor signaling and breast cancer metastasis. The results of the manual clustering were important not only because they provide confirmation of the data obtained through DAVID and GSEA analysis, but also because it showed a significant decrease in the number of phosphorylated growth factor receptors involved in major cell signaling pathways such as EGFR, HGFR, and most notably IGF1-R. This helps us verify how miR-15b may not only inhibit the receptor of these processes, but also system activation as a whole because it could be repressing downstream phosphorylation of key protein mediators of oncogenic mechanisms.
and mitosis could hinder the uncontrolled proliferation of TNBC cells. Table 8 shows the different pathways impacted by genes negatively correlated with miR-15b expression. These pathways seemed to be mostly related to epidermal growth-factor and other general signaling mechanisms. This table is critical to our hypothesis because if miR-15b is significantly altering IGF-1 system activation as predicted, then it is important that it is associated with a downregulation of genes involved with peptide or glycosylation signaling. These are two known methods by which pathways are able to transmit signals throughout the cell. Additionally, a negative association with epidermal growth factor (EGF) and its receptors was correlated with miR-15b overexpression. This is important to note because EGF has an analogous function to IGF-1 in terms of initiating tyrosine receptor phosphorylation cascades. In fact, EGF and IGF have been discovered to be closely associated in downstream signaling pathways related to therapy resistance in breast cancer, and there is likely significant crosstalk between EGF and IGF pathways (35).
cBioPortal
This matches up with the pathways predicted to be upregulated after the alignment of RNA-seq data from MD Anderson’s patient sample repository with miR-15b and analysis with DAVID. As mentioned before, this is important because miR-15b’s potential influence on increasing genes implicated in cell cycle regulation could be important to discovering how it may be skipping regulatory checkpoints and proliferating without control.
Table 4 is a short but compelling figure because it is able to show that in samples with miR-15b amplification, we see significant downregulation of genes that are hypothesized to be targets of miR-15b and its related miRs. cBioPortal analysis was also able to provide table 5, which specifically looked at the impact of miR-15b’s amplification on IGF1-R relative expression. In both datasets there was a significant decrease in IGF1-R expression, once again reinforcing the support for potential miR-15b mediated downregulation of IGF1-R. Furthermore, both the METABRIC dataset and the TCGA BRCA data sets depicted a very similar alterations in genes both over- and under-expressed in tumors with miR-15b amplification. This displays how there is concordance between both data sets and strong evidence for miR-15b’s in silico predictions, as these findings are reproducible across two of the largest breast cancer datasets available.
qPCR
more technical or random error. Utilizing a total RNA kit similar to the initial one used in pilot studies would have been more beneficial.
With greater time to work on my in vitro work, my second hypothesis could have been further examined with the use of western blotting protein analysis. Activation along the PI3K/Akt/mTOR pathway could have been experimentally validated by directly establishing levels of phospho-Akt, Akt, and IGF1-R proteins in each treatment group. It is necessary to use both methods to fully answer the question of IGF-1 system activation because as shown in other literature, transcriptional levels of mRNA and miRNA do not always correlate to the amount of protein translated (39,40). There are several post-transcriptional mechanisms taking place with other small RNAs other than miRNAs that can alter the amount of protein translation that occurs. Additionally, depending on which function they serve, certain subcategories of genes (such as those involved in cell signaling) tend to have differing levels of stable mRNA and stable protein. Therefore, mRNA and miRNA levels cannot be used as definite indicators of protein status without secondary confirmation.
tumorigenicity and metastatic capacity. Several methods such as colony-formation assays, flow cytometry for cancer stemness, migration assays, and invasion assays could then be performed on stable cell lines after lentiviral transduction to ascertain how miR-15b operates within the cell.
Works Cited
1. Common Cancer Types [Internet]. National Cancer Institute. 2015 [cited 2019 Apr 1]. Available from: https://www.cancer.gov/types/common-cancers
2. How Common Is Breast Cancer? | Breast Cancer Statistics [Internet]. [cited 2019 Apr 1]. Available from: https://www.cancer.org/cancer/breast-cancer/about/how-common-is-breast-cancer.html
3. The First 5 Years: Recurrence Rate for Triple-Negative Breast Cancer [Internet]. Healthline. 2018 [cited 2019 Apr 1]. Available from: https://www.healthline.com/health/triple-negative-breast-cancer-recurrence
4. Street W. Breast Cancer Facts & Figures 2017-2018. :44.
5. Zeichner SB, Terawaki H, Gogineni K. A Review of Systemic Treatment in Metastatic Triple-Negative Breast Cancer. Breast Cancer Basic Clin Res. 2016 Mar 22;10:25–36.
6. Picon‐Ruiz M, Morata‐Tarifa C, Valle‐Goffin JJ, Friedman ER, Slingerland JM. Obesity and adverse breast cancer risk and outcome: Mechanistic insights and strategies for intervention. Ca. 2017;67(5):378–97.
7. Trivers KF, Lund MJ, Porter PL, Liff JM, Flagg EW, Coates RJ, et al. The epidemiology of triple-negative breast cancer, including race. Cancer Causes Control CCC. 2009 Sep;20(7):1071– 82.
8. Chan DSM, Norat T. Obesity and breast cancer: not only a risk factor of the disease. Curr Treat Options Oncol. 2015 May;16(5):22.
9. Simone B, Ko K, Nowak K, Rese A, Venkataraman C, Andrews DW, et al. Obesity Drives Prognosis in Women with Metastatic Breast Cancer. Int J Radiat Oncol. 2017 Oct;99(2):E46. 10. Bousquenaud M, Fico F, Solinas G, Rüegg C, Santamaria-Martínez A. Obesity promotes the
expansion of metastasis-initiating cells in breast cancer. Breast Cancer Res BCR [Internet]. 2018 [cited 2019 Apr 1];20. Available from:
https://www.ncbi.nlm.nih.gov/pmc/articles/PMC6123990/
11. O’Flanagan CH, Smith LA, McDonell SB, Hursting SD. When less may be more: calorie restriction and response to cancer therapy. BMC Med [Internet]. 2017 May 24 [cited 2019 Apr 1];15. Available from: https://www.ncbi.nlm.nih.gov/pmc/articles/PMC5442682/
12. Simone BA, Dan T, Palagani A, Jin L, Han SY, Wright C, et al. Caloric restriction coupled with radiation decreases metastatic burden in triple negative breast cancer. Cell Cycle. 2016 Mar 30;15(17):2265–74.
13. Nutrition, insulin, IGF-1 metabolism and cancer risk: a summary of epidemiological evidence. - PubMed - NCBI [Internet]. [cited 2019 Apr 1]. Available from:
https://www.ncbi.nlm.nih.gov/pubmed/15562834
14. Chitnis MM, Yuen JSP, Protheroe AS, Pollak M, Macaulay VM. The type 1 insulin-like growth factor receptor pathway. Clin Cancer Res Off J Am Assoc Cancer Res. 2008 Oct
15;14(20):6364–70.
15. Kaaks R. Nutrition, insulin, IGF-1 metabolism and cancer risk: a summary of epidemiological evidence. Novartis Found Symp. 2004;262:247–60; discussion 260-268.
17. Sell C, Rubini M, Rubin R, Liu JP, Efstratiadis A, Baserga R. Simian virus 40 large tumor antigen is unable to transform mouse embryonic fibroblasts lacking type 1 insulin-like growth factor receptor. Proc Natl Acad Sci U S A. 1993 Dec 1;90(23):11217–21.
18. Davison Z, de Blacquière GE, Westley BR, May FEB. Insulin-like growth factor-dependent proliferation and survival of triple-negative breast cancer cells: implications for therapy. Neoplasia N Y N. 2011 Jun;13(6):504–15.
19. Christopoulos PF, Msaouel P, Koutsilieris M. The role of the insulin-like growth factor-1 system in breast cancer. Mol Cancer [Internet]. 2015 Feb 15 [cited 2019 Apr 1];14. Available from: https://www.ncbi.nlm.nih.gov/pmc/articles/PMC4335664/
20. MacFarlane L-A, Murphy PR. MicroRNA: Biogenesis, Function and Role in Cancer. Curr Genomics. 2010 Nov;11(7):537–61.
21. Fang Z, Rajewsky N. The impact of miRNA target sites in coding sequences and in 3’UTRs. PloS One. 2011 Mar 22;6(3):e18067.
22. Catalanotto C, Cogoni C, Zardo G. MicroRNA in Control of Gene Expression: An Overview of Nuclear Functions. Int J Mol Sci [Internet]. 2016 Oct 13 [cited 2019 Apr 1];17(10). Available from: https://www.ncbi.nlm.nih.gov/pmc/articles/PMC5085744/
23. Pratt AJ, MacRae IJ. The RNA-induced Silencing Complex: A Versatile Gene-silencing Machine. J Biol Chem. 2009 Jul 3;284(27):17897–901.
24. Lim LP, Lau NC, Garrett-Engele P, Grimson A, Schelter JM, Castle J, et al. Microarray analysis shows that some microRNAs downregulate large numbers of target mRNAs. Nature. 2005 Feb 17;433(7027):769–73.
25. Huntzinger E, Izaurralde E. Gene silencing by microRNAs: contributions of translational repression and mRNA decay. Nat Rev Genet. 2011 Feb;12(2):99–110.
26. TargetScanHuman 7.2 [Internet]. [cited 2019 Apr 1]. Available from: http://www.targetscan.org/vert_72/
27. Riffo-Campos ÁL, Riquelme I, Brebi-Mieville P. Tools for Sequence-Based miRNA Target Prediction: What to Choose? Int J Mol Sci [Internet]. 2016 Dec 9 [cited 2019 Apr 1];17(12). Available from: https://www.ncbi.nlm.nih.gov/pmc/articles/PMC5187787/
28. Agarwal V, Bell GW, Nam J-W, Bartel DP. Predicting effective microRNA target sites in mammalian mRNAs. eLife [Internet]. [cited 2019 Apr 1];4. Available from:
https://www.ncbi.nlm.nih.gov/pmc/articles/PMC4532895/
29. miRTarBase: the experimentally validated microRNA-target interactions database [Internet]. [cited 2019 Apr 1]. Available from: http://mirtarbase.mbc.nctu.edu.tw/php/index.php
30. DAVID Functional Annotation Bioinformatics Microarray Analysis [Internet]. [cited 2019 Apr 1]. Available from: https://david.ncifcrf.gov/
31. Deng M, Brägelmann J, Schultze JL, Perner S. Web-TCGA: an online platform for integrated analysis of molecular cancer data sets. BMC Bioinformatics [Internet]. 2016 Feb 6 [cited 2019 Apr 13];17. Available from: https://www.ncbi.nlm.nih.gov/pmc/articles/PMC4744375/
32. cBioPortal for Cancer Genomics [Internet]. [cited 2019 Apr 2]. Available from: https://www.cbioportal.org/
33. GSEA [Internet]. [cited 2019 Apr 2]. Available from: http://software.broadinstitute.org/gsea/index.jsp
35. Castaño Z, Marsh T, Tadipatri R, Kuznetsov HS, Al-Shahrour F, Paktinat M, et al. Stromal EGF and igf-I together modulate plasticity of disseminated triple-negative breast tumors. Cancer Discov. 2013 Aug;3(8):922–35.
36. El-Khoury V, Pierson S, Kaoma T, Bernardin F, Berchem G. Assessing cellular and circulating miRNA recovery: the impact of the RNA isolation method and the quantity of input material. Sci Rep. 2016 Jan 20;6:19529.
37. Brown RAM, Epis MR, Horsham JL, Kabir TD, Richardson KL, Leedman PJ. Total RNA extraction from tissues for microRNA and target gene expression analysis: not all kits are created equal. BMC Biotechnol [Internet]. 2018 Mar 16 [cited 2019 Apr 1];18. Available from:
https://www.ncbi.nlm.nih.gov/pmc/articles/PMC5857145/
38. Practical data handling pipeline improves performance of qPCR-based circulating miRNA measurements [Internet]. [cited 2019 Apr 1]. Available from:
https://www.ncbi.nlm.nih.gov/pmc/articles/PMC5393188/
39. Kendrick N, Laboratories K, St A. A gene’s mRNA level does not usually predict its protein level. :8.
40. Maier T, Güell M, Serrano L. Correlation of mRNA and protein in complex biological samples. FEBS Lett. 2009 Dec 17;583(24):3966–73.