Stephanie W. Haas.
Legacy data stores of experimental assay data in a pharmaceutical R&D organization are poorly structured and annotated, which hinders the integration of these data with data from more recent research programs and from other publicly available clinical, biological and chemical data sources. Being able to integrate and analyze this data in aggregate will help maximize the value of the available data, which will help inform and potentially improve the drug discovery process.
In this study, text mining and information extraction tools and techniques were applied to improve the annotation of a subset of these data in an accurate and automated fashion. Experimental results of this study show promise for classifying some features of the available assay data. Initial results of classification using a Naïve-Bayes classifier provided high values of accuracy (upto 93%). This indicates that the methods described in this study can be extended to larger dataset to extract more annotation from the available data.
Headings:
Data Mining -- Text Mining (Information Retrieval)
Data Mining -- Information extraction
Data Mining -- Knowledge discovery in databases
Text Mining – Drug Discovery
Text Mining – Naïve-Bayes Classifier
TECHNIQUES
By
Mrudula Sudarsanam
A Master’s paper submitted to the faculty of the School of Information and Library Science of the University of North Carolina at Chapel Hill
in partial fulfillment of the requirements for the degree of Master of Science in
Information Science.
Chapel Hill, North Carolina April 2014
Approved by
Acknowledgements
Foremost, I would like to express my deepest thanks and gratitude to my advisor Dr.
Stephanie Haas, for her continuous motivation, patience and guidance through the course of my
Master’s degree, which has helped me achieve many academic and professional goals. Thank you
Dr. Haas, for your immense knowledge, your timely advice and direction, throughout this
research. Thank you for the many times you reviewed this paper. I am ever grateful for your
patience, input and constructive suggestions in writing this paper.
I would also like to thank the faculty and staff at the School of Information and Library
Science, The University of North Carolina at Chapel Hill, for providing an excellent learning
atmosphere and infrastructure to complete my Master’s degree. The skills that I picked up
through the courses undertaken in the MSIS program were invaluable in completing this research.
I would like to thank GlaxoSmithKline for affording me the opportunity of working with
them over the past year. I consider myself fortunate to have had the opportunity to work with a
great team of people, in an organization that cultivates professional growth and knowledge
enhancement by providing a variety of challenging opportunities.
I would like to thank Denise Pohlhaus, my manager and mentor, whose confidence in my
abilities and constant encouragement over the past year has helped me achieve many professional
goals. I am thankful for all the time and effort she has spent in guiding me, for her patience
through all of my mistakes and her understanding and reassurance through the tough spots. Thank
invaluable input through various stages of the project. I will be ever grateful for all the
opportunities you have provided and continue to provide for me.
This work would not have been possible without Dan Price, whose faith in my abilities
provided an exciting opportunity for me to conduct this research. Dan served as a domain expert
on this project, guiding me through the drug discovery process and providing me with all the
resources necessary for the completion this project. I will always be grateful for the time he spent
reviewing each stage of this project with me, which helped ensure the success of this project. I
would like to convey my sincere thanks for his vast knowledge, patience and guidance through
the course of this project.
I would also like to thank both Dan and Denise for taking the time to review earlier versions
of this paper and provide many valuable suggestions that improved this paper.
On a more personal note, I would like to express my sincere gratitude to my parents, my
brother and my husband for their constant encouragement and belief in my abilities. I would like
to thank all my friends old and new, for their everlasting faith in me and always encouraging me
to reach for the stars.
I would like to thank the Almighty, for I would not be here without His blessings and
Table of Contents
1. Introduction: ... 4
2. Literature Review: ... 10
3. Research Overview ... 20
3.1 Information Infrastructure ... 20
3.2 Creation of a Data Subset ... 24
3.3 Study Goals ... 25
4. Methods: ... 27
4.1 Datasets ... 27
4.2 Tools Used ... 28
4.3 Process ... 29
5. Results ... 34
6. Discussion ... 36
7. Conclusion ... 42
Bibliography ... 44
Appendix I ... 47
Glossary of Terms ... 47
Table 1: Description of Datasets Used ... 28
Table 2: Confusion Matrix for Initial Run with Dataset A ... 31
Table 3: Classification Models generated using Dataset A ... 32
Table 4: Classification Models generated using Dataset B ... 33
Table 5: Classification Results for models described in Table 3... 34
Table 6: Classification Results for Models Described in Table 4 ... 34
Table 7: Confusion Matrix for Dataset A, Model 2 ... 37
Table 8: Confusion Matrix for Dataset A, Model 7 ... 38
Table 9: Confusion Matrix for Dataset A, Model 8 ... 38
Table 10: Confusion Matrix for Dataset A, Model 3 ... 39
Table of Figures
Figure 1: Drug Discovery Progression Path ... 6
Figure 2: High Level Schematic of Assay Information ... 20
1.
Introduction:
Research oriented companies in a wide variety of fields often have large stores of data from legacy research programs that are poorly structured and annotated. As a
consequence these data stores are poorly integrated with other data from more recent research programs or with data from external sources. This results in the companies not being able to analyze these data in aggregate, thus having poor access to critical
experimental information.
Groups involved in the early discovery phase of drug development1 in pharmaceutical organizations generate a large amount of pharmaceutical assay data.
An Assayis defined as
“An investigative (analytic) procedure in laboratory
medicine, pharmacology, environmental biology, and molecular biology for qualitatively assessing or quantitatively measuring the presence or amount or the functional activity of a target entity (the analyte) which can be a drug or biochemical substance or a cell in an organism or organic sample” (Assay, 2014).
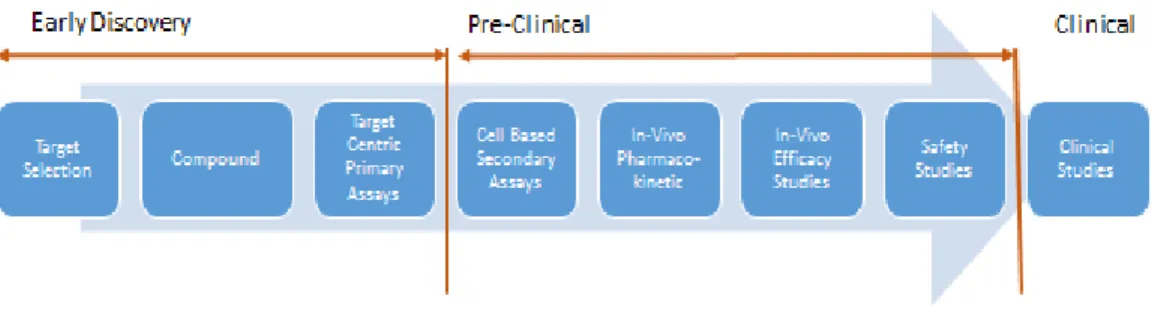
The endpoint of an assay is the activity of a biological macromolecule, often referred to as the target of the assay. Figure 1 describes a standard drug discovery progression path. Compounds are screened for activity against a particular target.
1Drug development is the process of bringing a new drug to the market once a lead component has
These target centric primary assays can be conducted in either cell-based or cell-free media or other physiochemical assays that measure the chemical developability of the molecule. The chemical developability refers to the presence of chemical properties necessary for the molecule to be developed into a drug. An example of a physiochemical assay is the measurement of the solubility or the purity of the compound in simulated intestinal fluid.
This is followed by cell-based secondary assays that measure phenotypes2 that are thought to be relevant to a disease. In-vivo experiments are then conducted to observe pharmacokinetics3 which reflect how much of the compound is absorbed, whether it gets to the target tissue and whether it produces the desired effect. The information from these studies is used to progress with compounds that have sufficient pharmacokinetics, and as input to design efficacy4 studies. The efficacy studies are followed by safety studies to characterize at what doses the compound is safe. These stages form the pre-clinical phase of drug development.
2
Phenotypes – observable characteristics or traits.
3 Pharmacokinetics – Study of time and course of drug absorption, distribution, metabolism and excretion.
4
Figure 1: Drug Discovery Progression Path
Drug discovery has historically proven to be a lengthy, expensive and inefficient process. Any time a compound fails one step, the process has to be restarted. The farther down the path a compound fails, the higher the costs involved.
A variety of cell biology, genetic and other experiments are conducted to pick a target that might be relevant to a particular disease, but target selection is an imperfect science. The therapeutic rationale behind a target might fail for a number of reasons. For example, if key experiments were performed using animal tissues or in an animal, it might not translate well to humans. It is not uncommon to find compounds that show efficacy, but present adverse findings in toxicity studies preventing its progression. Even when a safe and efficacious compound is identified for disease intervention, the compound might affect other biological activities, which is unacceptable irrespective of the benefits
effort from many researchers can be spent if these liabilities are not discovered early in the progression path.
The goal of every drug discovery team is to identify compounds with the best therapeutic efficacy while minimizing any drug safety issues. But these quantities are challenged only late in the progression path. Discovering that the mechanism5 has an inherent side effect, or that the target has minimal potency with respect to a disease, or that a compound is unsafe to be used in humans’ results in going back to the beginning of the progression path and finding new molecules or new targets.
In order to find the key molecule to begin testing in a clinical setting, a tremendous amount of semi-structured pharmacological assay data is generated. The information surrounding an assay including assay type, target name, target class, assay medium, assay experimental information is stored in relational database tables. In the context of this study, this information/metadata surrounding the assay will be referred to as ‘assay annotation’.
Due to lack of foresight or inconsistencies in how the assay data has been captured over time, the annotation surrounding a particular assay is often incomplete. In addition to absent annotation, existing protein name and assay information do not utilize a
standardized set of terms for each field, making retrospective querying of the data subject to ontological and semantic ambiguities. With such a vast amount of data (tables with nearly 1 Billion records), retrieving and interpreting specific data as well as application of
5
sophisticated and broad informatics techniques is dependent on complete, accurate, and consistent assay annotation.
Having the assay data fully annotated allows scientists to search against a
compound’s history and similar compounds histories for activity against specific targets. Capturing historic internal and external data in a structured manner enables retrospective and comprehensive querying of these data. This will help identify promising compounds that allow a scientist or a researcher to bypass the earlier stages of the progression path, thus challenging a therapeutic hypothesis sooner, developing a better understanding of a disease state or generating a better understanding of the mechanism of action by
correlating target activity to an observed toxicity. This will reduce costs and time and avoid going down the progression path with compounds that are doomed to fail or on targets that will never be effective. This gives rise to an opportunity of improving the efficiency of drug discovery, by creating structured annotation around historic
pharmacological assay data.
This research studies how existing data mining, information extraction and retrieval methodologies can be used to accurately annotate existing disparate data sources in an automated and accurate fashion. Text mining methods can potentially create structure and annotation around legacy biochemical experiments, enabling better interpretation of current experiments and the potential repurposing of historically synthesized and tested compounds.
The remainder of the paper is organized as follows. Following a survey of the
2.
Literature Review:
This section provides an overview of the applications of text mining and information extraction in the pharmaceutical domain and some of the solutions that are available. Some of the projects discussed in this section have implemented text analytics and Information extraction techniques to retrieve protein-protein interaction from biomedical data. While this study does not delve into protein-protein interactions, these articles provide some background on popular information extraction techniques that have been utilized in the biomedical domain with semi-structured and unstructured data sources. This section also discusses some proprietary solutions that can be applied to leverage the value of internal and external data-sources and to inform and improve drug discovery.
The pharmaceutical industry is inundated with massive amounts of chemical, biological and clinical data, composed of both specialized proprietary data as well as other open-source databases (PubChem6, PubMed7). Integrating various proprietary experimental data with open source biological, chemical and clinical databases like PubChem and PubMed would provide users with a unified view of all the data available and would enable more robust data analytics that would inform the drug discovery process.
6
Website: https://pubchem.ncbi.nlm.nih.gov/ 7
Several organizations curate and structure biological, chemical and medical data. Thomson Reuters8 for example, structures and annotates known portions of clinical pipelines of pharmaceutical companies, as a competitive intelligence tool. Aureus9, a provider of database and informatics solutions to pharmaceutical companies, structures and annotates published compounds and their biological activities, to enable confident drug discovery decisions. But, these databases are created by applying a combination of proprietary data mining and manual review, and are focused on specific publicly
available data sources. This study focuses on applying text mining tools to leverage proprietary internal data sources. There are several open source and proprietary solutions are available in the market that help organizations integrate and utilize their data
effectively such as Palantir10, Pipeline Pilot11 and Linguamatics12. More information about the pharmaceutical text mining solution Linguamatics, which was available for use through the course of this study is provided later in the section.
Apart from the state of the art solutions available in the market, there have been other research projects that have been conducted in performing text mining and information extraction with biomedical, chemical and pharmacological data.These techniques mainly focus on entities like genes, proteins and the interactions and relationships between these entities implementing strategies like Parts of Speech Tagging, Named Entity Recognition, Tokenization, etc. (Fluck, Zimmermann, Kurapkat, & Hofmann, 2005; Hahn, Cohen,
8
Website: http://cmr.thomsonreuters.com/services/programs/discovery/ 9
Website: http://www.aureus-sciences.com/ 10Website: http://www.palantir.com/ 11
Website: http://accelrys.com/products/pipeline-pilot/ 12
Garten, & Shah, 2012) . A review of these techniques informed the design of this study, to create high performing text mining models.
Named Entity Recognition (NER) is an Information Extraction technique that has been implemented successfully in retrieving protein information from biomedical text, and hence was reviewed to identify a feasible approach to implementing an automated solution to add structure to the existing assay data. This section provides an overview of Named Entity Recognition, and the various types of NER techniques that have been implemented by different projects in this domain. Some of the problems associated with identifying biological objects in written text make NER a difficult process. These difficulties arise due to various factors like lack of uniform naming conventions, use of many synonyms and homonyms in the text and also the fact that names of biological objects often consists of multiple words, Greek letters and special characters Consider for example, the protein name
‘CCAAT/enhancer binding protein (C/EBP), alpha’
(Leser & Hakenberg, 2005; Fluck, Zimmermann, Kurapkat, & Hofmann, 2005)
The NER process can be viewed as containing three different aspects: identifying the entity, assigning a category to this entity and normalizing the representation (in case synonyms exist) (Leser & Hakenberg, 2005). For example, NER identifies the acronym
“MAPK” in the text of the document as an entity and classifies it as a kinase.
The fundamental approaches to Named Entity Recognition tasks may be defined as: Dictionary based, Rule based, Classification based and Sequence based. Dictionary based NER is the process of exactly matching dictionary terms to entries in the text (Leser & Hakenberg, 2005). These dictionaries are derived from existing biomedical, clinical or chemical databases, like Uniprot13. These systems provide high precision but low recall, as dictionary entries search the text for exact matches. ProMiner (Hanisch, Fundel, Mevissen, Zimmer, & Fluck, 2004) is an example of a system that has implemented Dictionary Based NER to extract gene names by generating and curating a synonym dictionary and identifying the object given a text corpus(test cases in BioCreAtIvE14 competition). This system has provided encouraging results (F-measure:>0.78).
Using a dictionary based system does not require an annotated corpus. It also allows for each instance to be identified by a concept identifier, which can prove to be
advantageous in reducing the effort required for term normalization in cases where each instance has multiple synonyms. For example, MAPK, Map Kinase and
Mitogen-activated protein kinase can all be identified by the unique id from the UniProt Database.
A drawback of using a dictionary based approach is that incorporating fuzzy
algorithms to match dictionary entries to improve recall, can lead to over-fitting, wherein the algorithm performs well only for known data.
The rule based approach to NER is the process of identifying specific rules to extract entities like protein names. For example, a rule could be defined based on surface clues, wherein all terms that start with a capital letter could be considered as candidates for a
13
Website: http://www.uniprot.org/ 14
protein name. There are several systemsthat are supported by manually-encoded rules (Blaschke & Valencia, 2002; Ono, Hishigaki, Tanigami, & Takagi, 2001; Mooney & Bunescu, 2005; Jiang, Information Extraction from Text, 2012). The SUISEKI Information Extraction system (Blaschke & Valencia, 2002) for example uses a set of rules (called frames) derived from morphological, syntactical and contextual information to detect protein names and interaction from scientific texts.
The research conducted by (Ono, Hishigaki, Tanigami, & Takagi, 2001) used a combination of dictionary based and rule based extraction to extract protein-protein interaction from biomedical text. First, the protein names were identified using a dictionary of manually constructed protein names. The sentences containing atleast two protein names were extracted using two rules based on parts of speech. These sentences were then parsed with a pattern matching rule to recognize the protein-protein interaction. This rule is based on the arrangement of protein names, prepositions and keywords that represent the relationship between protein names. This study was conducted for yeast and E.coli proteins (due to the availability of well-maintained protein databases), and
obtained high precision (yeast: 94.3% and E.Coli: 93.5%) and recall rates (86.8% and 82.5%).
Classifier-based named entity extraction techniques involve the use of a gold standard dataset to train a classifier model to classify single word occurrences or multi word phrases into specific categories(for example: “gene” or “not gene”). Leser & Hakenberg (2005), discuss three main classifier models, the Naïve-Bayes classifier, Support Vector Machines and Hidden Markov Models.
The Naïve-Bayes classifier is a simple, powerful and robust classifier with a strong independence assumption. In other words, the presence or absence of a particular feature has no effect on the presence or absence of other features. The probability of an instance belonging to a particular class is calculated based on the presence or absence of features with respect to a particular class. Classification can be performed based on properties of words or word phrases such as word length, letter frequency etc.
Support vector machines (SVM) are non-probabilistic linear classifier algorithms that can be used effectively in entity extraction tasks. SVM’s use learning algorithms that analyze data and recognize patterns to perform classification. SVM’s used a labelled training dataset to build learning models and assign new instances to one of the labels (Support Vector Machines, 2014).
Hidden Markov Models use the sequence in which features appear in text (order of words in a sentence) to predict the most probable sequence of events for a sentence (Leser & Hakenberg, 2005). This prediction is performed by aggregating statistical information from labelled examples.
Classification approaches take into account just the features that are generated by a word. They do not take the order of words into account. But a drawback of using classification approach is that quality of prediction is dependent on the features, and the best
combination of features should be chosen empirically.
In the context of this study, identifying specific target information from the available assay data, or extracting and understanding the import of an experiment based on terms occurring in the assay data can be viewed as an entity recognition task. Extracting target names, or target class or other target specific information based on the occurrence of specific terms in the assay data can benefit from the use of dictionary based NER. Being able to extract the import of an experiment based on terms that occur in the available data can be performed using rule based or classifier based NER.
This review suggests that classifier based approaches would provide more robust and reliable results. The classifier models can potentially be extended to larger datasets, and the performance of these classifiers can be tuned to provide highly accurate results. However, as mentioned earlier, the performance of the classifier is greatly dependent on the features selected.
Tokenization is the process of breaking up a stream of text into words or other textual units called tokens which are used further in text processing and mining (Fluck,
Zimmermann, Kurapkat, & Hofmann, 2005; Trim, The Art of Tokenization, 2013). Jiang & Zhai (2007) studied the impact of various tokenization strategies on biomedical
functional characters like “=” or “#”, punctuations (which do not occur in gene names) were removed. Three different strategies were employed to replace the special characters occurring within the gene names. The first method was to replace special characters with hyphens, the second was to replace them with spaces and the third was to remove them completely. Stemming and stopword removal was also performed on the three datasets, and retrieval was evaluated based on Mean Average Precision15 (MAP). Results showed that tokenization improved performance by upto 96%. Stemming on the other hand, was not effective for all queries. Stopword removal did not improve performance or improved it very slightly. This studyhelped inform the feature selection process for classification models by implementing methods like stemming, stopword removal etc., to improve the performance of the classifier.
Information extraction systems are typically evaluated by comparing results with gold standard datasets which consists of a set of domain specific, manually annotated
documents (Leser & Hakenberg, 2005; Jiang, Information Extraction from Text, 2012; Mooney & Bunescu, 2005). The evaluation metrics for NER systems and Information Extraction systems in general are typically Precision16, Recall17 and F-measure18.
15
Mean Average Precision(MAP) for a set of queries is the mean of the average precision values for each individual query.
∑
; Where Qn is the number of queries.
16
Precision = 17 Recall=
18
Accuracy19 is another metric that is used to evaluate system performance, and this metric will be used through the course of this study.
One commercially available text mining platform in the pharmaceutical domain is the Linguamatics I2E software. Linguamatics can be used in Text Mining applications to query both internal proprietary data-sources and publicly available sources. This software was available for use in this study, and hence an application of this software is reviewed in this section. This provides an understanding how the software could potentially be used in this study and in further work around this data.
The Linguamatics I2E software was used to extract protein-protein interactions from MedLine abstracts (Bandy, Milward, & McQuay, 2010). The Medline index was queried using four different types of queries to extract information. The first query used a precise linguistic pattern using relationships that are relevant to protein-protein interactions. This query pattern provided results with “high precision”. The second query provided a
“higher recall”, by querying for a precise linguistic pattern, but allows any verb. The
third query retrieved proteins appearing within a sentence structure, and hence provides results with much “lower precision” and “higher recall”. The fourth query returned
proteins appearing within the same document, and hence results in the “highest possible recall”, but “lowest precision values”. Each of these strategies resulted in high quality
results.
The goal of the research described here is to extract relevant assay information from existing experimental data using a Naïve-Bayes classifier to train and test classification
19
models. This study was performed in consultation with scientists who wanted to improve the annotation of the experimental data. These scientists served as domain experts, who provided an understanding of how this data could be used to improve the drug discovery process. They helped in the creation of the subset of data used for this study. They
3.
Research Overview
3.1 Information Infrastructure
This section provides more detail about the information infrastructure that is used in this study. An overview of the databases that records the assay information is provided, along with specific information about specific data fields that are used in this study.
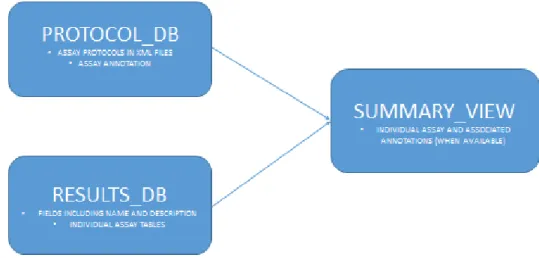
Figure 2 shows a high level representation of the information infrastructure for assay data that is used in this study. This data is primarily stored in two relational databases, referred to as Results_DB and Protocol_DB. These databases have been in use for more than a decade and over the years have captured vast amounts of assay information.
RESULTS_DB:
The results of experiments are stored in a relational database (Results_DB). The data generated from a single assay protocol generally resides in a single table that corresponds to that particular protocol. Other descriptive information surrounding the assay protocol is recorded in this database as well. The information that is most relevant for this study and that was extracted to perform the study are fields that describe the human readable assay name, the assay description and the assay medium. Generic examples (obtained from PubChem20) are provided with the descriptions below.
Name: The human readable assay name will be referred to as Name. This field corresponds to a short name that refers to the assay, for example
“MAPK Signaling Pathway Screen”
Description: This field refers to a short description about the assay. This field will be referred to as Description throughout this study. Consider the example provided above. The corresponding description for this assay would be
“A functional RNAi screen for regulators of receptor tyrosine kinase and ERK
signaling”
20
Medium: This represents the medium in which the assay is conducted and is derived from the original assay protocol. For example, an assay could be conducted in a Cell-free
medium or in Cellular media.
The database captures more information about an assay, including more specific biological information such as the organism involved in the assay if any, and assay type as well, but they were judged to be unnecessary for this study.
PROTOCOL_DB:
Experimental protocols and some annotation about each assay are stored in tables in the relational database Protocol_DB. This database contains some information associated with the target of the assay such as target name and target class which were not used in this study. This database houses the experimental procedure, in XML protocol files. In many cases, each assay is associated with multiple versions version of XML protocol files. It is assumed that the latest version of the XML protocol file, has the most complete and updated information around a particular document.
Scientists identified fields in the XML protocol file that were most likely to contain relevant information concerning an assay. These included the Abstract, Rationale and Procedure fields, which were examined to be used as sources to derive assay annotation. However, the scientists determined the procedure field (described below) to be the best source for this study.
The experimental data that resides in Results_DB is linked back to the experimental protocol in Protocol_DB.
SUMMARY_VIEW:
Summary_view represents the aggregated view of assay information sourced from both Protocol_DB and Results_DB. This view contains around 1 Billion records and serves to capture all experimental information along with the corresponding assay annotation from both the databases. Ideally a scientist or any other end user looking for information associated with a particular assay or wanting to analyze the experimental information in aggregate should be able to query this view to retrieve the information that they need.
Unfortunately, as it currently exists summary_view is not a complete and annotated view of the assay data. This can be attributed to many factors, some of which have been described in the Introduction. In a number of cases summary_view is missing critical target information such as assay medium, target/protein class, target name and other assay specific information which would help a scientist easily distinguish relevant and non-relevant assays. In addition, existing protein name and assay information do not conform to a uniform dictionary for each field. This results in ambiguity while querying the database.
structure and annotation of Summary_view. Thus the scientists will be able to utilize this data effectively in other informatics and analytical applications (like predictive analytics) to maximize the value of this data, thus improving the efficiency of the drug discovery process.
3.2 Creation of a Data Subset
Summary_view, which provides an overall representation of all the assay data available, contains nearly 1 Billion records. Working with the entire dataset would be beyond the scope of this research. This section describes the subset of data used for the study and the rationale behind using this it.
As described in the Introduction, assays can be performed in different media:
Cell-free
Cell-based or Cellular component based In-vivo
Discussions with the scientists revealed that being able to classify assays into categories based on the assay medium could serve as a first step in bringing about some structure to the data. For example, this categorization helps in distinguishing a target-centric21 assay from a more phenotypic assay22 which adds value in understanding what the activities of a compound are and what behavior it induces. Three categories23 of
21
Target Centric Assays are those that are performed around a single target or a set of targets
22 Phenotypic assays are conducted to identify substances that alter the phenotype of a cell or organism
in a desired manner.
assays (Cell-free, Cellular and In-vivo) were defined based on the medium in which the experiment was performed.
The field Medium, in the Results_DB captured this information, but it was not
available for all the assays. The dataset that was used in this study was a subset (Subset 1) of the larger data store. It should be noted that, Subset 1 was not a random sample of the larger dataset, but was instead a carefully consolidated dataset. Subset 1 was created by querying Results_DB and Protocol_DB, with terms judged (by the scientists) to be relevant to the categories Cell-free, Cellular and In-vivo, to extract assays belonging to these categories. Subset 1 contained the name, description and the XML protocol file of the assays. The limitations associated with this dataset will be discussed in further detail in the Discussion Section.
The Methods contains a more detailed description of this dataset, along with the number of records per category and the tasks that it was used for.
3.3 Study Goals
The overall goal of this study is to improve assay annotation by implementing a naïve-Bayes classifier. Based on Subset 1 described in the previous section, these goals were revised to fit the scope of the current study. These goals are described below:
not. This helped identify and eliminate misclassified records that resulted in a cleaner dataset.
Build Naïve-Bayes classifier models to train and test on the data from Subset 1 to automatically categorize the assays into different categories with high accuracy. The tasks performed to accomplish this goal are referred to as Task 2. While the most of the methods discussed in the Literature Review have used F-measure as an evaluation metric, this study used accuracy as the evaluation metric.
Accuracy of classification in this study can be defined as:
While precision and recall are important indicators of system performance, for this particular application, the most important outcome is the accuracy of the classifier. This reflects the need to be able to use the assay annotation for further analytics to better understand the activity of a compound or to potentially inform and improve target
4.
Methods:
4.1 Datasets
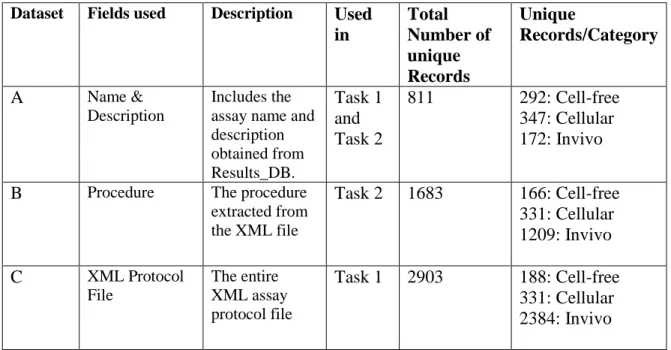
The datasets used in this study are derived from Subset 1 described in the previous section. Table 1 below provides a description of each of the derived datasets, including the tasks it was used for, total number of unique records and the number of unique records per category (Cell-free, Cellular, In-vivo) of the dataset. Dataset B, was derived from the XML Protocol file (Dataset C) after Task 1 had been completed.
As shown in Table 1, the datasets do not contain an equal distribution of records across the three categories. As mentioned in the Research Overview, Subset 1 was compiled by querying the database for records that satisfied specific conditions, and hence was not a random sample of the larger dataset. However, it was not possible in the given timeframe to verify the actual distribution of the full dataset, hence no statement can be made as to the representativeness of Subset 1, nor of datasets derived from it.
Table 1: Description of Datasets Used
Dataset Fields used Description Used in Total Number of unique Records Unique Records/Category
A Name &
Description
Includes the assay name and description obtained from Results_DB. Task 1 and Task 2
811 292: Cell-free 347: Cellular 172: Invivo
B Procedure The procedure
extracted from the XML file
Task 2 1683 166: Cell-free 331: Cellular 1209: Invivo
C XML Protocol
File
The entire XML assay protocol file
Task 1 2903 188: Cell-free 331: Cellular 2384: Invivo
4.2 Tools Used
The tools and technologies used during the course of this study are listed below:
Linguamatics:
The I2E text mining platform provided by Linguamatics (Linguamatics Ltd, 2014) was available for use through the course of this research. This tool was used in Task 1 to identify and extract metadata from the available assay data LightSide:
LightSIDE is an open source text mining and machine learning toolkit (LightSide, 2014). This tool was used in Task 2 to train and test classifier models for text classification.
Python:
BeautifulSoup24 was also used to extract the procedure field from the protocol file.
4.3 Process
Task 1: Use automated information extraction techniques to retrieve metadata from the text.
The goal of this task was to use information extraction techniques to validate the existing categorization of records in Subset 1. This was accomplished using the
Linguamatics I2E platform. To build a document index using I2E, ontologies are used to search and analyze the text in the documents.
The Linguamatics ontologies include NCI thesaurus and MeSH terms (among other publicly available and proprietary dictionaries). A descriptor or a synonym of a descriptor from the MeSH ontology or the NCI ontology is referred to as a concept.
Document indexes (using the datasets A & C described above) were created using the Linguamatics software. Each record in these datasets was represented as an individual document in the index identified by its unique id. These indexes were queried using the MeSH and NCI ontologies to extract relevant metadata (that is, terms that could indicate what type of assay was performed) that would help in identifying the assay medium.
The purpose of this step was to discover the occurrence of any concept that might indicate a record with that term was misclassified. For instance, the assays identified as Cell-free should have minimal cellular descriptors. The occurrence of a cellular concept
24
in an assay in the Cell-free category would raise a flag. Thus the Cell-free index was queried to find the occurrence of any cellular concept. This would trigger a manual review of the descriptor/concept and the particular assay to identify if it was a
misclassification or not. Thus, Datasets A and C were reviewed by the scientists to rectify or eliminate misclassified instances.
Task 2: Build Naïve-Bayes classifier models to train and test on the data from Subset 1 with high accuracy.
The goal of this task was to build a Naïve-Bayes classifier model that could
automatically classify the assays into the three categories with high accuracy. Datasets A & B were used to build Naïve-Bayes classifier models using LightSIDE. As an initial step to assess and understand the performance of the Naïve-Bayes classifier, the model was built with Dataset A. This dataset was uploaded in the form of a CSV file containing text fields with the assay names and descriptions, and the corresponding assay category. The feature plugin in LightSIDE was used to extract unigram features, removing
stopwords and punctuations (like colon, semi-colon, hyphen, comma, period etc.). It was assumed that the most descriptive features in the dataset would occur atleast 5 times and hence the threshold for term frequency was set to 5.
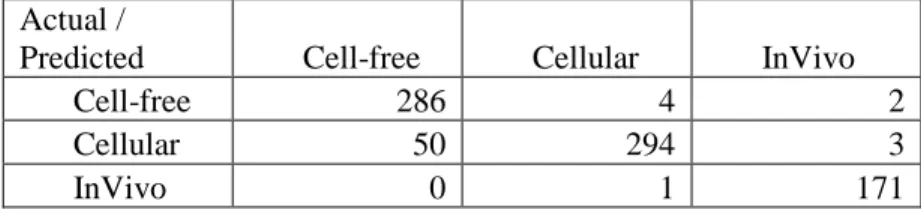
Table 2: Confusion Matrix for Initial Run with Dataset A
Actual /
Predicted Cell-free Cellular InVivo
Cell-free 286 4 2
Cellular 50 294 3
InVivo 0 1 171
In order to minimize the number of misclassifications, the feature set was reviewed by the scientists to identify non-descriptive features in the Cell-free category. Terms including full, curve and binding were found to have a high precision(>0.7) and relatively low recall(<0.3) with respect to the Cell-free category, however these features occurred in the Cellular category as well, which resulted in the misclassification of a few Cellular records as Cell-free.
Using the trained model, LightSIDE assigned the predicted categories for Dataset A, thus allowing further analysis of the misclassified instances. This was beneficial, as it helped identify one record that actually belonged to the Cellular category, but had been wrongly categorized as In-vivo. This misclassification was rectified, and that record was assigned to the Cellular category.
for each of these variations. Below listed are the variations to the basic model performed on Dataset A
1. Generation of Bigram features 2. Stemming
3. Removal of the terms full, curve and binding.
4. Using Regular expressions to extract descriptive features. Morphemes that were thought to be highly indicative features with respect to the Cellular category were identified. An example of a regular expression pattern used in refining the
features is (\w+) cyte, to retrieve any word that contains cyte.
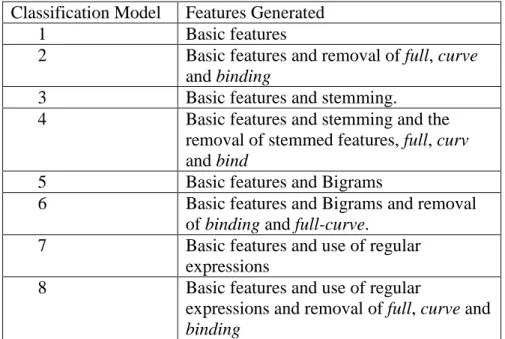
Table 3 presents the classification models generated using Dataset A. The basic
classification model includes the initial set of features: unigrams, removal of stopwords and punctuation, and removal of non-descriptive features such as numbers
Table 3: Classification Models generated using Dataset A
Classification Model Features Generated
1 Basic features
2 Basic features and removal of full, curve
and binding
3 Basic features and stemming.
4 Basic features and stemming and the removal of stemmed features, full, curv
and bind
5 Basic features and Bigrams
6 Basic features and Bigrams and removal of binding and full-curve.
7 Basic features and use of regular expressions
8 Basic features and use of regular
expressions and removal of full, curve and
Dataset B contains the procedure field from the XML protocol file, and consists of 1706 records with 166 records in the Cell-free category, 331 records in the Cellular category and 1209 records in the Invivo category. The basic classification model using this dataset was generated with unigram features, removal or stopwords and punctuation. These are referred to as basic features in Table 4. Note that unlike Dataset A, numbers were not removed for the basic model with Dataset B. The procedure field is much longer than the brief assay name and description fields, and hence there were more features generated in Dataset B than in Dataset A. Non –descriptive features were not identified and eliminated in the basic model, as the number of features generated made manual review of these features impractical.
Table 4: Classification Models generated using Dataset B
Classific ation Model
Features Generated
9 Basic Features
10 Basic Features and stemming 11 Basic features and bigrams
12 Basic Features, bigrams and stemming
13 Basic Features and removal of numbers and decimals
5.
Results
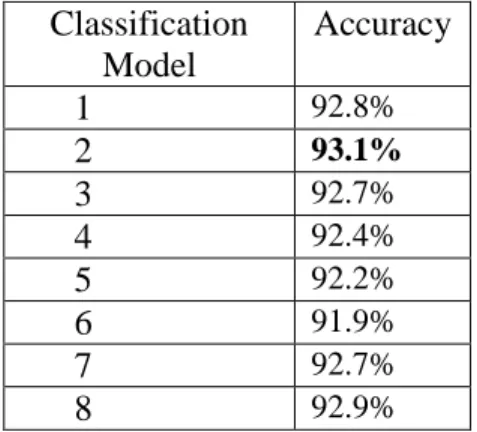
The accuracy of each model described in Tables 3 and 4 is presented in Tables 5 and 6.
Table 5: Classification Results for models described in Table 3
Classification Model
Accuracy
1 92.8%
2 93.1%
3 92.7%
4 92.4%
5 92.2%
6 91.9%
7 92.7%
8 92.9%
Table 6: Classification Results for Models Described in Table 4
Classification Model
Accuracy
9 89.5%
10 88.2%
11 86.3%
12 85.6%
Dataset A with more concise name and description fields consistently yielded better performance than the longer procedure field. The highest value of accuracy obtained with Dataset A, was 93.1%. The high performing model included unigram features, without stopwords, punctuation and the non-descriptive features full, curve and binding. The lowest accuracy obtained was 91.9%, with the use of unigram, bigram features along with stemming and removal of stopwords, punctuation and non-descriptive features binding,
full and curve.
For Dataset B, the highest value of accuracy obtained was 90.3%, by the classification model with unigram features, without stopwords and punctuation and non-descriptive features like numbers and decimals. The lowest value of accuracy obtained was 85.6% by Model 12, which used unigram, bigram and stemmed features along with stopword and punctuation removal.
Certain feature generation techniques lowered performance in both the datasets. The use of bigrams lowered performance in both the datasets (Model 5, Accuracy 92.2% and Model 11, Accuracy 86.3%). The use of stemming with unigram features did not impact performance in Dataset A (Model 3, Accuracy 92.7%), but lowered performance in Dataset B (Model 10, Accuracy 88.2%). The use of regular expressions, did not improve the performance of the classifier as well (Model 7, Accuracy 92.7% and Model 8,
6.
Discussion
This study was conducted to evaluate whether various text mining and information extraction techniques could be used to classify and structure experimental assay
information. Scientists helped create a subset of data (Datasets A, B and C) as described in the Methods section, which was used to train and test a Naïve-Bayes classifier. The results obtained are encouraging and suggest that this method can be applied successfully to a larger dataset. This section describes the impact of stemming, feature removal and regular expressions on the classification results. This is followed by an overall discussion of the value afforded by text mining approaches to structure experimental assay data while addressing some concerns with respect to the distribution, as well as extensibility of the classification models.
Impact of Feature Removal on Classification
Certain features were identified as being non-descriptive. These features occurred many times in a particular category, but had little import with respect to that category. Model 2 was created by eliminating the non-descriptive features –
number of features made this impractical. In addition, removal of too many features could have resulted in an over-fitted model, which would limit the extensibility of the model. This strategy was not employed with Dataset B, because the number of features made manual analysis and identification of non-descriptive features with respect to each category unfeasible.
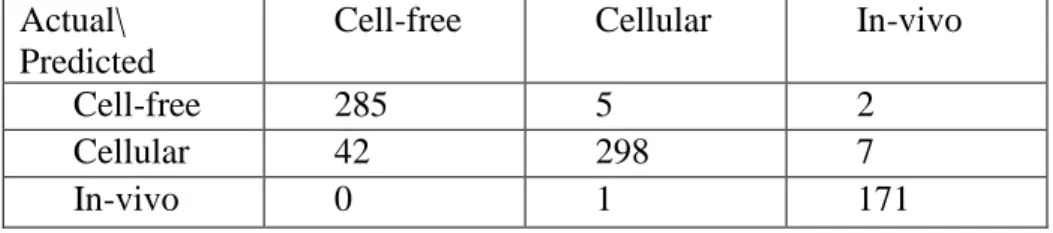
Table 7: Confusion Matrix for Dataset A, Model 2
Accuracy: 93.1%
Actual/ Predicted
Cell-free Cellular In-vivo
Cell-free 286 4 2
Cellular 48 296 3
In-vivo 0 0 172
Impact of Regular Expressions on Classification
Scientists identified a few biological terms that could serve as good features for a particular category. For example, cell types (like adipocyte, lymphocyte) were found to be useful in identifying an instance as Cellular. Unfortunately, these specific features that occur in Cellular assays were not initially extracted as they occurred at a low term frequency.
The use of the regular expression ‘(\w+)cyte’ made it possible to extract all terms
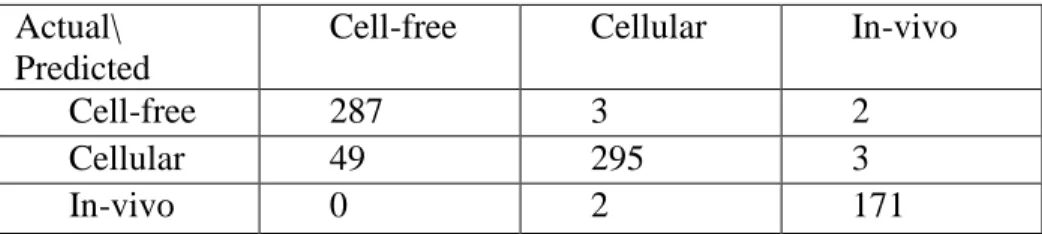
did not improve. The confusion matrices along with the accuracy obtained for model 7 and model 8 are provided below in Table 8 and Table 9respectively.
Table 8: Confusion Matrix for Dataset A, Model 7
Accuracy: 92.7%
Actual\ Predicted
Cell-free Cellular In-vivo
Cell-free 286 4 2
Cellular 49 295 3
In-vivo 0 1 171
Table 9: Confusion Matrix for Dataset A, Model 8
Accuracy: 92.9%
Actual\ Predicted
Cell-free Cellular In-vivo
Cell-free 285 5 2
Cellular 42 298 7
In-vivo 0 1 171
Impact of Stemming on Classification
root helped identify new features that otherwise were under the threshold for term frequency (For example, the stemmed feature intravenous was extracted, whereas the more specific features intravenous and intravenously were individually not extracted from the dataset. On the other hand, stemming undermined the value of certain descriptive features like rat (which is less likely to occur in the In-vivo category) versus rats (which is more likely to occur in the In-vivo category).
Table 10: Confusion Matrix for Dataset A, Model 3
Accuracy: 92.7%
Actual\ Predicted
Cell-free Cellular In-vivo
Cell-free 287 3 2
Cellular 49 295 3
In-vivo 0 2 171
Table 11: Confusion Matrix for Dataset B, Model 10 Accuracy: 88.2%
Actual\ Predicted
Cell-free Cellular In-vivo
Cell-free 160 6 0
Cellular 45 263 0
In-vivo 122 25 1062
The relatively high values of accuracy obtained for the classification models for both the datasets are encouraging, but these values of accuracy did not correlate with the
random chance in these classifications, most instances had near perfect probability scores. For example, Model 2 which obtained the highest accuracy, had probability scores greater than 0.7 for 788 out of 811 records. This meant that more than 97% of the predictions made were very strong. Unfortunately, this includes misclassifications as well. Out of 48 false positives with respect to the Cell-free category in model 2, only 6 instances had a probability score less than 0.72. While this can be attributed to the fact that the features generated were few and hence were strong descriptors for classification, it does undermine the application of this data in further analytics to inform drug
discovery. A model that results in very strong assertions of false positives or false negatives, will create more noise and ambiguity around the historical assay data which can further impair the drug discovery process.
There are a few limitations associated with the training dataset used. As mentioned in the Research Overview, Subset 1 was not a random sample of the larger dataset, but instead was created by querying the database based on certain conditions proposed by scientists to find records that belong to the three different categories. Records in the datasets used are unevenly distributed across the categories. This cannot be assumed to be
representative of the larger dataset, because the subset was not created by random sampling. The disparity in the subset of data used for this study was not rectified, as the distribution of the larger dataset was unknown and estimating the distribution in the larger was not feasible given the timeline of this study.
or Cell-free experiment is called an assay; the environment in which a Cell-free
experiment is conducted is always referred to as media, but in a Cellular experiment it is referred to as a solution. These features helped scientists develop a better understanding of the existing data and how this data is recorded.
7.
Conclusion
The goal of this study was to use automated text mining and information extraction techniques to automatically capture some structure in pharmaceutical assay data. The results of this study conducted with a subset of assay data have yielded high values of accuracy, indicating potential in applying these techniques.
Structured and annotated data can be further used to inform and improve the drug discovery process. Specifically, being able to automatically classify assays into categories based on assay media adds value in distinguishing target centric assays and phenotypic assays. This will help better understand the mechanism of action for a compound and the behavior it induces, which will help identify safer compounds or also help inform target selection or . The results obtained are satisfactory, paving the way for further work to be carried out in this area.
Specifically with respect to target information, a normalized dictionary to represent target annotation will be created. This will be useful in deriving target specific information from the existing assay data that will help deduce the molecular mechanism of a compound, or to quantify the selectivity of a compound for one target over others. Extracting all activity with respect to a specific target class will help scientists create structure activity
relationships (SAR25) that will help inform target selections. These various applications demonstrate the value of structured assay annotations to improve drug discovery and development process.
25
Bibliography
Accelrys. (2014, February 4). Accelrys. Retrieved from Information Extraction from Text
Documents using Pipeline Pilot:
http://accelrys.com/resource-center/case-studies/information-extraction.html
Agarwal, P., & Searls, D. B. (2008, September 27). Literature Mining in support of Drug
Discovery. Briefings in Bioinformatics, 9(6), 479-492. doi:100093/bib/bbn035
Assay. (2014, January 15). Retrieved January 15, 2014, from Wikipedia: http://bit.ly/P97WO8
Bandy, J., Milward, D., & McQuay, S. (2010). Mining protein-protein interactions from
published literature using Linguamatics I2E. Methods in molecular biology, 563, 3-13.
doi:10.1007/978-1-60761-175-2_1
Blaschke, C., & Valencia, A. (2002). The Frame-Based Module of the Suiseki Information
Extraction System. IEEE Intelligent Systems, 14-20.
Drug Development. (2014, March 22). Retrieved from Wikipedia: http://bit.ly/1jDQtLH
Drug Discovery. (2014, March 22). Retrieved from Wikipedia: http://bit.ly/1gXUd2G
Efficacy. (2014, March 27). Retrieved from Wikipedia: http://bit.ly/1g7QSxS
Fluck, J., Zimmermann, M., Kurapkat, G., & Hofmann, M. (2005). Information extraction
technologies for the Life Science Industry. Drug Discovery Today:Technologies, 2(3),
Hahn, U., Cohen, K. B., Garten, Y., & Shah, N. H. (2012, March 23). Mining the
pharmacogenomics literature- a survey of the state of the art. Briefings in Bioinformatics,
13(4), 460-494. doi:10.1093/bib
Hall, M., Frank, E., Holmes, G., Pfahringer, B., Reutemann, P., & Witten, I. H. (2009). The
WEKA Data Mining Software: An Update. SIGKDD Explorations.
Hanisch, D., Fundel, K., Mevissen, H.-T., Zimmer, R., & Fluck, J. (2004). ProMiner:
Organism-specific protein name detection using approximate string matching. ‘Proceedings of the
EMBO workshop BioCreative: Critical Assessment for Information Extraction in
Biology. Granada, Spain. Retrieved February 25, 2014, from http://bit.ly/1i1JsPf
Hidden Markov Models. (2014, March 20). Retrieved from Wikipedia: http://bit.ly/1mbgWgG
Jiang, J. (2012). Information Extraction from Text. In Mining Text Data (pp. 11-41). Boston,
Massachussets: Springer US. Retrieved from http://bit.ly/1jZOmNV
Jiang, J., & Zhai, C. (2007, October 01). An Empirical Study of Tokenization Strategies for
Biomedical Information Retrieval. Information Retrieval, 10(4-5), 341-363.
doi:10.1007/s10791-007-9027-7
Leser, U., & Hakenberg, J. (2005, December). What makes a gene name? Named entity
recognition in biomedical literature. Briefings in BioInformatics, 6(4), 357-369. Retrieved
February 9, 2014, from http://bit.ly/1h3xna2
LightSide. (2014, January 5). Retrieved from LightSide: http://bit.ly/1rLBIYz
Linguamatics Ltd. (2009). I2E Case Study. Creating a Target Selection Framework with
Linguamatics Ltd. (2014, January 15). Linguamatics. Retrieved from Linguamatics:
http://bit.ly/1pjpwfi
Mooney, R. J., & Bunescu, R. (2005). Mining Knowledge from Text Using Information
Extraction. SIGKDD Explorations, 3-10.
Ono, T., Hishigaki, H., Tanigami, A., & Takagi, T. (2001). Automated extraction of information
on protein–protein interactions from the biological literature. Bioinformatics, 155-161.
Palantir Technologies. (2014, February 2). Pharma R&D. Retrieved from Palatir:
http://bit.ly/1jZMGUO
Pharmacokinetics. (2014, March 27). Retrieved from Wikipedia: http://bit.ly/1gKacHl
Structure Activity Relationships. (2014, March 27). Retrieved from Wikipedia:
http://bit.ly/1f0Yeao
Support Vector Machines. (2014, March 26). Retrieved from Wikipedia: http://bit.ly/1jZN6ua
Trim, C. (2013, January 23). The Art of Tokenization. Retrieved February 25, 2014, from IBM
Developer Works: http://bit.ly/1f0Zz0G
Wegner, J. K., Sterling, A., Guha, R., Bender, A., Faulon, J.-L., Hastings, J., . . . Willighagem, E.
Appendix I
Glossary of Terms
Assay: An investigative (analytic) procedure in laboratory
medicine, pharmacology, environmental biology, and molecular biology for qualitatively assessing or quantitatively measuring the presence or amount or the functional activity of a target entity (the analyte) which can be a drug or biochemical substance or a cell in an organism or organic sample
Results_DB: Relational database that stores the results of experiments.
Protocol_DB: Relational database that stores the assay protocol
Assay Medium: The medium in which the experiment is performed is the assay medium. This study identifies three assay mediums: Cell-free, Cellular/cell based and In-vivo.
Cell-free: The container in which the experiment is performed contains the engineered protein, salts and solvents needed to preserve them.
Cellular: The entire cell or other cellular components are used in the container in which the experiment is performed.