The Development of a Diabetes Group Visit Program In a University-Based, Primary Care Clinic
By
Sarah E Johnson Patel, MD
A Master's Paper submitted to the faculty of The University of North Carolina at Chapel Hill
In partial fulfillment of the requirements for The degree of Master of Public Health in
The Public Health Leadership Program
Chapel Hill
2002
ABSTRACT
Objectives: This study was conducted to determine the feasibility of a group visit program for diabetes education and management led by a primary care provider in a primary care clinic setting.
Intervention Design: A review of the literature about group visits for many diseases including diabetes is reported. Using this information, we designed a diabetes education program using a group visit model. The curriculum was based on the National Standards for Diabetes Self-management Education and used the theory of stages of change and principles of active, adult learning.
Methods: 32 subjects with Type II diabetes were recruited to enroll in the program over the course of eight months. Outcome measures included HgbA 1 c, body mass index, blood pressure, quality of life, and self-efficacy. Changes were measured at baseline, eight weeks, and six months.
Results: Clinical outcomes demonstrated trends towards improvement with a 0.16% drop in HgbA 1 c at six months. Attitudes about diabetes and self-efficacy improved immediately after the sessions but returned to baseline at 6 months. Quality of life showed minimal improvement.
Conclusions: A group visit program for diabetes education and management led by a primary care provider is feasible. Key
INTRODUCTION
Diabetes is a major contributor to morbidity and mortality in the
United States and the world. An estimated 17 million people in the US
have diabetes, with nearly 800,000 new cases each year, and diabetes is
now the 61h leading cause of death in the US.[1] Direct and indirect costs
were estimated at $98 billion in 1997.[1] Chronic complications of
diabetes, including micro-vascular and macro-vascular disease, are
known to be leading causes of blindness, renal failure, and non-traumatic
amputation in the US. Major advances have been made in the
management of diabetes with new oral medications, laser therapy to delay
the progression of retinopathy, ace-inhibitors to delay renal disease, and
more. Trials have successfully demonstrated the benefits of tight glycemic
control in both Type I and Type II diabetes and the benefits of aggressive
control of blood pressure in Type II patients.[2, 3]
Despite these advances, our current healthcare system is not
optimally treating patients with diabetes. An estimated 5.9 million people
have diabetes but do not know it. [1] Many of these patients are not
diagnosed until several years into the disease process, when
complications have already begun. Equally discouraging is the number of
patients who receive inadequate or ineffective treatment for their
18% of patients with diabetes had poor glycemic control with HbgA 1 c
levels greater than 9.5%. [5] The Center for Disease Control and
Prevention reports that, based on self-report, only 61% of diabetics have
had annual dilated eye exams, 55% reported a foot exam in the last year,
and only 18% reported a HgbA1c level measured in the last year.[6]
The reasons for this inadequate management of diabetes involve
many factors. One major issue is the nature of the disease. Like many
chronic diseases, diabetes management involves lifestyle changes that
are very difficult to make. Diabetes requires that the patient live with and
manage the disease on a daily basis. Treatment entails self-monitoring of
blood glucose, medication adherence, and appropriate medical follow-up
for screening and prevention. Behaviors such as over-eating, poor food
choices, smoking, and lack of exercise contribute to the development of
the disease and its poor control. Recent evidence demonstrated that
lifestyle change can be more powerful than medications for the prevention
of Type II diabetes. However, to be successful, this intervention required
an intensive, multidisciplinary team approach to motivate and maintain
behavior change.[?]
These challenging aspects of chronic management for diseases
like diabetes bring into question our current health care system and its
organization. The present structure evolved in an earlier era when acute
illness predominated. One-on-one, brief and isolated office or hospital
even briefer, often requiring physicians to see their patients for less than
15 minutes. Clearly, this design does not meet the needs of patients with
complex chronic diseases like diabetes. Physicians need time to
introduce knowledge, teach skills, and motivate behavior change in
addition to the medical management that must occur in those 15 minutes.
To address these weaknesses, many have proposed creating new
structures and systems for management of diabetes and other chronic
diseases. Disease management programs, physician reminder systems,
and use of multi-disciplinary teams have all been tried and, in some cases,
found to be effective[8]. Others have implemented group visits for patients
with diabetes; as education and self-management programs, support
groups, and as ongoing management visits. Several successful programs
have been implemented in large health care systems, but few programs
have been studied on a smaller scale. Primary care physicians, often in
smaller clinic settings, care for nearly 75% of patients with Type II
diabetes.[9] The development of strategies that improve the quality and
efficiency of care in primary care settings is essential.
Therefore, we designed a diabetes education and management
program using a group visit model, run by individual primary care
providers in an academic family practice clinic. The unique feature of our
program is the combination of the smaller clinic setting with a primary care
provider-led group. The goal of this study is to assess the feasibility of this
real-world clinical setting. This paper will review the literature on diabetes
group visits and discuss the design and implementation of our program.
Initial pilot study data will be presented from the first six cohorts.
REVIEW OF LITERATURE ABOUT GROUP VISITS
Many researchers and clinicians have proposed group visits for a
wide variety of health-related concerns, including diabetes education and
management. They argue that group visits offer an appealing efficiency for
both providers and health care organizations. [1 0] The potential ability to
provide higher quality care to more patients quickly has its obvious
benefits. Physicians may prefer to offer the same counseling information
once to many patients instead of giving a shortened version of that same
education numerous times. Other practices have developed group visits
to meet patient demands for increased access to their physicians and to
health information.[11]
Some researchers suggest that group visits can offer more than
efficiency, noting that group communication and social support have the
potential to motivate and reinforce behavior change. In a 1985 article,
Tattersall, et al describe twelve potential "curative factors" of group
psychotherapy for patients with diabetes.[12] These factors highlight the
potential power of group interaction for education, social support, and
provider and patient (Table 1 ). Other literature suggests the importance of
social support for health behavior change.[13]
Many disease processes can benefit from using a group visit
model. In practice, providers appear to develop group programs to meet
three needs: 1) increased efficiency and productivity; 2) increased patient
access to appointments; and 3) improved education and access to
information. Stanford Health Partners led patient focus groups to identify
ways that care could be improved and found that access to appointments
and information were consistent needs for all patients.[11] Several small
private practices have adopted provider-run groups for common conditions
such as obesity, depression, and asthma.[14] Another application of the
group model is for annual physicals-called Physicals Shared Medical
Appointment.[15] These visits limit the traditional physical exam and,
instead, focus on health maintenance, healthy lifestyle counseling, and
prevention. Patients have the advantage of increased availability of
physical appointment times, longer visits with the physician for counseling,
and the opportunity to learn from peers.
Group visits have also been studied for well childcare, emphasizing
the education and guidance components of these preventive visits.
Parents with children of similar ages can learn from each other and form a
peer group for social support. One study demonstrated that well childcare
could be equally effective when provided using group visits instead of
the providers, while allowing parents more time with the physician.
Prenatal care can be provided with the same group framework, focusing
on guidance, information sharing, and support.[18]
Several large randomized controlled studies have been conducted
using group visits for the care of the elderly or chronic disease. Wagner
and Coleman studied the use of group visits for older patients with a
chronic disease in a large HMO and found no change in outcomes or cost,
but did find an improvement in satisfaction with care.[19] Another study by
Beck et al looked at the use of groups for the elderly and found a
decrease in emergency room and specialty visits, but an increase in
primary care visits and phone calls. Both patients and physicians
experienced improved satisfaction, and the overall cost of care for the
group patients was less.[20]
The concept of group visits for diabetes education and, more
recently, for disease management is spreading. Group education
programs have been done for years, though often without direct evidence
of the effectiveness. Diabetic "mini-clinics" have been used in Britain for
the past three decades as a way to provide specialized disease
management in general practice.[21, 22] More recently in the United
States, providers have developed comprehensive diabetes education and
management using a group visit model. One family physician from Florida
has developed a group visit model for several chronic diseases including
at each visit.[23, 24] Another program in Sweden looked at pharmacy-run
diabetes "circles" that provided education and social support.[25] A recent
systematic review of 72 randomized controlled trials in diabetes
self-management training found great diversity among the types of programs
offered.[26] Short-term measures such as knowledge, blood glucose
testing skills, and self-reported dietary habits improved, but often without
improved glycemic control. Important findings include the benefits of
patient participation and collaboration, the value of reinforcing
interventions, and the effectiveness of group interventions for lifestyle
change.
Several randomized controlled trials have examined the role of a
group model. Detailed characteristics and findings for each trial are
shown in Table 2. A 1988 study from Israel examined the role of small
group education sessions as part of routine care compared to individual
office visits alone. This early study did not demonstrate knowledge
differences between the two groups, but did find reductions in fasting and
post-prandial glucose (p=0.01) and in HgbA1 cat 12 months (p<=0.05).[27]
Anderson studied a patient empowerment program. The goal of six
weekly group sessions was "empowerment facilitating a path to personal
self care." Patients who attended the sessions demonstrated increased
self-efficacy scores (based on a diabetes attitude survey) and greater
improvement in HgbA1c.[28] Ridgeway et al studied a practical education
medicine clinic. Patients attended monthly group sessions led by an RN
or RD in addition to their routine office visits. Subjects in the intervention
group had a 2.07% drop in HgbA1c at the end of 12 months compared to
1.08% in the control group (p=0.0034).[29] A similar program in Denmark
studied the effect of a group program for intensified lifestyle education and
found limited change in diet and other targeted behaviors but did find
reduction in overall HgbA1 c levels (p<0.0000001 ).[30] However, this was
a multi-factorial intervention and much of the improvement in glycemic
control is likely due to other aspects of the intervention such as medication
adjustment and intensive target goals for the intervention group.
On a larger scale, two randomized controlled trials have been
I
implemented in health maintenance organizations. Sadur et al studied theefficacy of a cluster visit for diabetes management. [31] Subjects received
care provided by a large multi-disciplinary team with monthly group visits
over a 6-month period. HgbA1c levels dropped by 1.3% in the
intervention group compared to 0.2% in the control group (p<0.0001 ).
Hospital and outpatient utilization were lower in the intervention group as
well. Wagner et al studied the use of Chronic Care Clinics for diabetes in
a large staff model HM0.[32] Subjects attended half-day clinic sessions
every three to six months based on the "mini-clinic" model used in Britain.
These sessions included individual visits with each member of a
multi-disciplinary team and a group education/peer support meeting. After 24
experienced improved quality of life (measured by the SF-36
questionnaire and bed disability days), but showed no significant
improvement in HgbA 1 c. Intervention subjects had increased primary
care visits, but needed fewer emergency room and specialty visits.
One study expressly compared group to individual diabetes
education using a consistent, evidence-based curriculum modeled on the
National Standards for Diabetes Self-Management Education (DSME).
The entire program consisted of four sessions over a six-month period led
by a nurse and a dietician. The individual and group programs were
equally effective at improving knowledge, behavior, attitudes and quality of
life. However, the subjects in the group intervention had a statistically
significant greater reduction of HgbA 1 c compared to the control group
(2.5% vs. 1.7%, p=0.05).[33]
An innovative study from Italy examined the effectiveness of group
visits with structured education for routine diabetes care as an alternative
to individual visits with support education. After two years of follow-up,
patients in the group visits had stable HgbA 1 c levels compared to
elevated levels in the control group (p<0.002).[34]
As with the majority of diabetes education research, there is great
diversity in the group programs studied. Group sizes ranged from 4 to 20
patients. Group leaders varied from a single provider to a
multi-disciplinary team. Professionals involved included physicians, registered
workers, podiatrists, and pharmacists. Programs have been studied in the
United States and internationally; in private clinics, academic centers, and
large HMO's; and in both diabetes specialty clinics and primary care
clinics. Also significant is the wide range of organization and content for
the group visits themselves; some were strictly education programs, while
others included a disease management component. Frequency, duration,
and session time varied greatly. Despite these differences, many
similarities in program design exist. Most applied the theories of active
adult learning and social support. Curricular content, when described,
followed very similar basic themes as recommended by the National
Standards for DSME. Overall, this diverse research presents some
promising evidence for the potential role of group visits in diabetes
education and disease management.
CHARACTERISTICS OF THE INTERVENTION-PROGRAM DESIGN
Our program was designed based on the knowledge of previous
programs found in the literature and based on several key theories of
behavior change and adult learning.
1) Transtheorectical model: The stages of change theory was
incorporated explicitly into the curriculum-both for developing
individualized goals for patients but also as a teaching tool to help patients
understand their own patterns of behavior change. We included an
asked patients to assess their own stages for particular behaviors related
to diabetes during group discussions.
2) Social Support: Our goal was to encourage group interaction and
support between the group members. Enabling and encouraging group
participation and sharing of individual experiences with diabetes helps to
create supportive relationships apart from the doctor-patient relationship.
Further, we hoped that the group members might find more cultural and
lifestyle similarities with each other that would promote learning and
motivation not always possible with professionals.
3) Active adult learning: Participants were encouraged to participate, ask
questions, and help shape the content of discussions. The overall course
design minimized the amount of time spent on didactic teaching and
focused more on question and answer sessions as well as hands-on
activities and group discussion. Homework was incorporated into the
design to keep participants actively involved during the time between
sessions.
The group visits were led by one of two primary care providers with
special interest in diabetes, one FNP/CDE and one Family Physician.
Nursing students or resident physicians observed some of the sessions.
Clinic staff (nurses or nursing assistants) provided assistance at the
beginning of each session for vital signs. The choice of a program run
of such a program in a smaller primary care setting where access to a
multi-disciplinary staff is less likely to be available.
Overall, the program consisted of four 2.5-3 hour sessions every
two weeks for a total of an eight-week program. Following the eight-week
program, patients were referred back to their primary care provider for
ongoing management of their diabetes. Groups were held in an education
room within the UNC Family Practice Center. Sessions were offered both
during daytime and evening hours, and spouses or significant others were
encouraged to attend.
Each session followed a similar outline. Before the session, the
provider would review the chart for lab results or ongoing medical issues
to prepare an individualized plan for each patient-arrangements for
medication changes, lab tests, or screening exams were made. Vital
signs including blood pressure and weight using a bio-impedance scale
were measured. Each session started with an introduction including
questions from the previous session and goals for the day, followed by an
interactive teaching session on the main topic for the day, which often
involved review of homework assigned at the previous session. Group
members were encouraged to ask questions and participate in discussion.
A short break including a healthy snack allowed some time for brief (three
to five minutes) individual assessment time to review individual needs or
changes. This was followed by a group activity focusing on a hands-on
wrap-up reviewed questions and presented goals and homework
assignment for the next session.
Sessions were billed as routine office visits and coded as an
established patient, complex office visit (99214) for the first session and
an established patient, detailed office visit (99213) for the subsequent
sessions. Visits included a component of history, some physical exam
and lab assessment, medical decision-making, and extensive counseling
justifying these codes.
The curriculum was based on the American Diabetes Association
guidelines for DSME core content areas.[35] These ten content areas
ensure that the basic knowledge and behavioral skills are covered. They
include:
• Describing the diabetes disease process and treatment options
• Incorporating appropriate nutritional management
• Incorporating physical activity into lifestyle
• Utilizing medications (if applicable) for therapeutic effectiveness
• Monitoring blood glucose, urine ketones (when appropriate),
and using the results to improve control
• Preventing, detecting, and treating acute complications
• Preventing (through risk reduction behavior), detecting and
treating chronic complications
• Goal setting to promote health and problem solving for daily
• Integrating psychosocial adjustment to daily life
• Promoting preconception care, management during pregnancy,
and gestational diabetes management (if applicable).
Our curriculum was designed only for patients with Type II diabetes
so issues related to Type I diabetes such as urine ketones and
ketoacidosis were not discussed unless questions were raised. Also,
given to the age of our population, we did not include standard discussion
of pregnancy-related concerns. The content areas were divided among
the four sessions beginning with basic knowledge and skills and ending
with psychosocial aspects of self-care in the last session.
Session 1 : Introduction to Diabetes
Topics covered included the definition of diabetes, signs and symptoms,
and basic treatment methods. Physiology of insulin resistance and basic
nutrition information was reviewed. Patients participated in a hands-on
activity to learn self-monitoring of blood glucose. Homework included lab
tests when appropriate, a three-day food diary, and patients were asked to
bring two food labels for discussion to the following session.
Session 2: Living a Healthy Life
The diabetes food pyramid and meal planning were presented using
examples from patients own food diaries. Basic educational material from
the ADA was distrubuted. Some healthy cooking techniques were
discussed and examples of resources for healthy recipes provided.
and real food demonstrations. In a hands-on group activity, we practiced
label reading and made comparisons of different food choices. Key
concepts such as serving size, importance of all carbohydrate not just
sugar, and goals for total fat and saturated fat intake were stressed.
Exercise and its relationship to blood sugar control was discussed, and
homework included a three-day activity diary and pre- and post-exercise
blood glucose testing.
Session 3: Living in the Doctor's World: Goals for Treatment Exercise diaries were reviewed as well as blood glucose responses to
exercise followed by a presentation of the basic categories of medication
with links to the pathophysiology of disease. The group was then asked to
develop a list of complications caused by diabetes using a drawing of the
human body as a visual tool. Once a complete list was generated,
fundamental prevention measures such as blood pressure control, eye
exams, and cholesterol lowering were reviewed. Patients were given an
individualized diabetes report card to follow their required preventive
services and to set personal goals for treatment. The hands-on skill
session reviewed basic do's and don'ts of foot care and individual foot
exams. Homework was assigned to think about the issues related to
behavior change. The stages of change model was introduced. Patients
were asked to think of one success and one failure that they have had in
Session 4: Putting It All Together: The Key to Happiness and Health
This session emphasized the challenges of making lifestyle changes.
Discussion of the homework assignment prompted patients to develop a
list of helpful and harmful techniques to maintain successful change.
Using the stages of change model as a framework, we discussed taking
small steps towards success. We discussed the effect of illness on
diabetes and reviewed the basic steps to managing sick days as well as
danger signs. We then discussed the role of emotional stress and its
effect on diabetes and presented some stress management skills. Finally,
we addressed the issues of communication with health care personnel
and with family and friends. Using case examples, we prompted
discussion of several "what if' scenarios such as how to handle the family
holiday meal. This final session ended with a diploma ceremony for each
participant.
METHODS: CHARACTERISTICS OF THE EVALUATION Study Design
This study was a feasibility study designed as a non-randomized,
pre- and post-intervention evaluation. The research question was whether
a provider-run, diabetes group visit program was feasible in our academic
family practice center. Future research will require an experimental
Setting
The setting was the University of North Carolina Family Practice
Center in Chapel Hill, North Carolina, a large primary care clinic with
45,000 patient visits per year with both resident and faculty providers.
Patients have diverse backgrounds, including highly educated university
personnel, rural farmers, and elderly Medicare patients.
Recruitment of Subjects
Subjects were recruited from continuity patients at the UNC Family
Practice Center identified as having Type II Diabetes by ICD-9 diagnosis
codes. Letters were sent to over 740 patients with diabetes announcing
the new program and asking interested patients to call the study
coordinator or to speak with their physician. Fliers were sent to each of
the physicians in the practice; announcements were made at clinic
meetings to make providers and staff aware of the program; and
informational posters were placed in each exam room. Patients could be
referred to the program either by their physician or at their own request.
Once a patient was referred to the program, the research assistant
contacted patients by telephone to explain the program, review the study
components, and obtain a basic verbal consent for the program. A
telephone script was used for these phone calls. Basic exclusion criteria
were reviewed with each patient. These included patients under age 18,
participate in all four session, and plans to change providers within the
next 12 months.
Specific cost information was explained to each potential participant
including relevant co-payments and other charges. The overall charge for
the program was $319 plus the cost of any indicated lab tests. All of the
testing done for the study and the visits themselves were felt to be
consistent with routine diabetic care and, therefore, patients and their
insurance were billed.
Following the telephone interview, patients either declined to enroll
in the program or were scheduled for the next group session. Figure 1
displays the number of patients initially recruited, the number enrolled, and
the number who attended. Primary reasons for declining the program
included schedule conflicts, cost and lack of insurance, and new
health-related concerns with higher priority. The patients identified by this type of
recruitment are self-selected or physician-selected and are likely to be
more motivated than the average diabetic population.
Written informed consent was obtained at the beginning of the first
session. The Institutional Review Board for the UNC School of Medicine
approved our study.
Data and Data Collection
Baseline demographic and clinical information was obtained for all
patients who enrolled in the group visit program using review of the
diabetes, medications, co-morbid conditions, presence of complications,
and previous lab test results were recorded. Lab data were considered
baseline if tests had been done within the standard recommendations for
routine diabetes care. For example, HgbA1c results were considered
baseline if drawn less than three months before the onset of the first group
session whereas cholesterol and urinary microalbumin results were
baseline if done within the last 12 months. If subjects did not have
documentation of baseline lab results, arrangements were made to have
them done within the first two weeks of the group visit program.
Outcome measures were divided into five basic categories: 1)
Clinical measures; 2) Attitudes and self-efficacy measures; 3) Quality of
life measures; 4) Quality of care; and 5) Utilization measures.
Clinical Outcomes
HgbA 1 c was measured using the DCA 2000 Analyzer by Bayer
Diagnostics, with a normal range 4.8-6.0%. These values were obtained
from electronic chart review at the onset of the group program and at six
months after the intervention when possible. Long-term follow-up will also
include 12-month measures. Subjects were to obtain these tests as part
of the routine management of their diabetes. However, due to low
compliance with these routine recommendation discovered during the
process of this research, reminder messages were sent to patients and
their primary care providers to ensure this and other clinical testing was
Total cholesterol (and, when possible, calculated LDL cholesterol)
was followed at baseline and 12 months. These were measured using
materials provided by Roche Diagnostics. The normal range for total
cholesterol is 1-199 mg/dl and 1-129 mg/dl for LDL.
Weight and Body Mass Index were measured using a
bio-impedance scale at each of the group sessions. Follow-up weight was
recorded from electronic chart review from subsequent patient visits at
six-month and 12-six-month endpoints. Visits within four weeks of the time point
(before or after) were considered adequate for each follow-up measure.
These were typically obtained with a basic balance scale and BMI was
calculated using known height.
Systolic and Diastolic Blood Pressures were obtained at the onset
of each group sessions by clinical support staff using the traditional
auscultation technique. Follow-up blood pressure measures documented
at routine clinic visits at six-month and 12-month points were obtained
from electronic chart review. Visits within four weeks of the time point
(before or after) were considered adequate for each follow-up measure.
Attitude and Self-Efficacy
Attitudes and self-efficacy were measured using a previously
designed and validated survey called the Diabetes Empowerment Scale,
developed by Anderson et al at the University of Michigan.[36] Permission
was obtained from the University of Michigan Diabetes Research and
questionnaire that addresses attitudes about diabetes on a 1 to 5 scale.
An overall score is measured as well as three subscales: Managing the
Psychosocial Aspects of Diabetes, Assessing Dissatisfaction and
Readiness to Change, and Setting and Achieving Diabetes Goals. A
higher score indicates better attitudes about diabetes and increased
self-efficacy.
Subjects completed questionnaires at the onset of the program, on
completion of the four session, at months, and at 12-months. Both
six-month and 12-six-month questionnaires were mailed to subjects' homes with
return envelopes and postage provided along with a reminder phone call.
Quality of Life
The SF-12® survey, a shortened version of the SF-36® survey that
has been validated in many disease processes, was used to assess
health-related quality of life.[37, 38] This survey has subscales for both
physical (PCS) and mental (MCS) health components. Permission was
obtained for use from Quality Metric Incorporated. An online scoring
service was used to analyze the data using the weighted analysis
designed and tested for this survey. As a reference, the mean score
found in a general U.S. population was 50.12 (SD 9.45) for the PCS and
50.04 (SD 9.59) for the MCS. Higher scores indicate better quality of
life.[39)
Subjects completed the SF -12® surveys at onset of the group
follow-up points. Surveys were mailed along with the Empowerment
questionnaires.
Future Outcome Measures
Both quality of care and health care utilization are important
long-term measures of any clinical diabetes program. These measures will be
examined after 12 months of follow-up to look for any effect of enrollment
in the program.
Quality of care measures will include use of recommended
medication such as aspirin and ace-inhibitors and rates of annual eye
exams and influenza immunizations. These measures will be examined at
baseline through medical chart review and direct history from the patient.
Final comparison of these measures will be looked at after 12 months to
see if rates change over a 12-month period.
Healthcare utilization will be tracked using an administrative
database for the entire university health care system. Office visits,
emergency room visits, and hospitalizations within the UNC system in the
12 months prior to the program will be compared to the 12 months after
the intervention.
Analysis
Descriptive statistics were obtained to determine the baseline
characteristics of the enrolled subjects for important demographic and
clinical areas. Pre-intervention and post-intervention outcomes measure
or percentages where appropriate. This study's primary goal was to
assess the feasibility of this group visit program in our setting. Therefore, it
was not designed to have adequate power to detect differences in any of
the outcomes areas. Measures of statistical significance would be
misleading and are not reported.
IMPLEMENTATION OF THE PROJECT
The most challenging aspect of implementation was contacting and
scheduling patients. A part-time research assistant working 8-10 hours
per week spent much of her time making repeated phone calls in order to
reach patients on the telephone. Even though they made inquiries about
the program, we were not able to contact 30% of interested patients,
primarily due to lack of access to work phone numbers and incorrect
phone numbers. Of those patients who agreed to enroll in the program, a
significant number of patients did not show up for any of the classes (15
out of 47). One entire group had to be re-scheduled to start the following
week as only one of the six subjects showed up for the first session. More
frequent phone call reminders, contacts made during evening hours, and a
better system of mailing notices to patients may have helped attendance
rates. Involvement of the primary care provider in this contact process
may help to encourage better enrollment and attendance rates.
Incorporating a new clinical program into an already busy clinic
managers, nursing, and lab personnel to anticipate any potential
problems. We had to carefully choose the times and days of the week for
the session so that the arrival time of the group patients would not
overwhelm clinic staff. Informing and working with front desk staff in the
clinic made processing referrals, answering patient questions, and overall
scheduling of patients somewhat easier.
Overall attendance was fair. Two subjects attended only the first
session while 11 out of 32 subjects attended all four session. On average,
subjects attended three sessions. Reasons for missing a session included
transportation problems, family or personal illness, or failing to remember.
Subjects were not called between sessions, but they did receive a
computerized reminder card before each meeting.
The lower rates of enrollment and attendance than anticipated
weakened the cost-effectiveness of the program. Overall, the six cohorts
required 24 half-day sessions of provider time. The total amount billed for
the entire program was $8983, approximately $375 per session. This is
about half of what each provider would typically bill in a continuity clinic
half-day session. Some of this reduced billing can be justified by the
limited use of clinic resources such as nursing needs and clinic rooms, but
to be cost-neutral for our clinic, group size needs to reach eight or nine
patients.
Provider time involved in the sessions improved with experience.
the first session and to facilitate data entry. Time for each patient's chart
review ranged from five to ten minutes. A progress note for each session
was dictated using pre-designed forms to generate uniform and rapid
documentation. Overall, providers spent approximately 20-30 minutes
prior to each session in preparation and about 30 minutes following the
session for documentation. Preparation of folders for each patient with
packets for each session's educational materials and homework helped
limit the amount of provider time required before the meeting.
Running the sessions efficiently was also a skill that improved with
time. The first and last sessions were the most difficult because a
significant amount of time was spent reading the consent form and
completing the two questionnaires. Keeping to a clearly outlined
scheduled helped ensure that all topics for the day were covered. Overall,
there was less time than anticipated for the individual assessments during
the break, but many patients used group time to discuss their individual
concerns. Some management decisions such as medication changes
were made at the end of the session as other members were leaving.
Supplies that were developed over the first few runs of the program
included posters for the education room that highlighted key points of the
curriculum such as the four key pillars of diabetes treatment; HgbA1c,
LDL, and blood pressure goals; and the stages of change model. A large
group agenda or questions. A snack and beverage was supplied at each
session due to the nearly three-hour duration.
RESULTS OF THE INITIAL PILOT STUDY
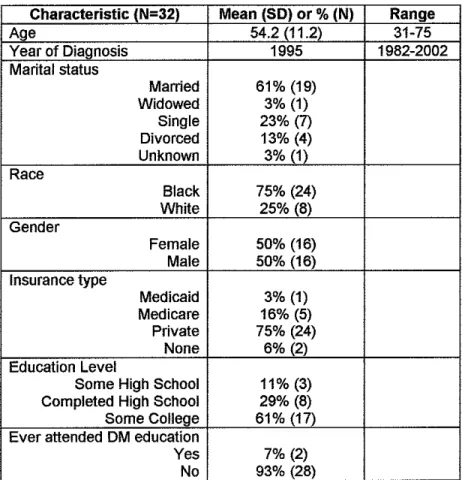
Baseline demographic characteristics of the subjects enrolled in the
group visit program are shown in Table 3. The mean age of participants
was 54 years. Participants were more likely to be African-American than
white (75%) and more likely to be married than not (61 %). Very few
subjects were without insurance (2 out of 32). Level of education was
fairly high with over 60% of the subjects having attended some college.
Three subjects ( 11 %) did not complete high school. The majority had
never attended a diabetes education program before.
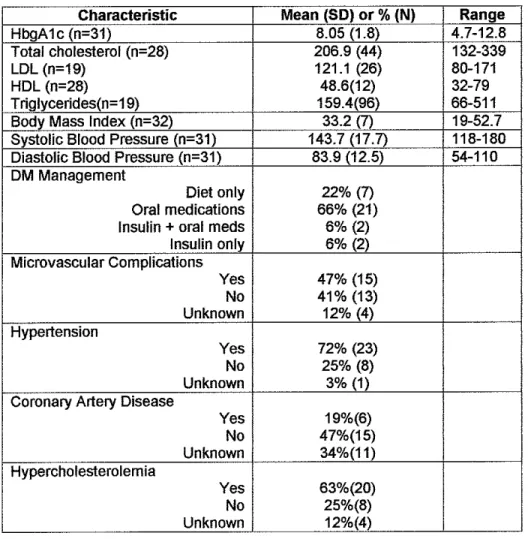
Clinical characteristics at baseline are shown in Table 4. Overall,
the mean HgbA 1 c was 8.05% (SD 1.8) slightly higher than the average for
our overall clinic population, which is 7.9% (SD 1.3). Average Body Mass
Index (BMI) was 33.2 kg/m2. Three-quarters of the subjects used some
type of medication for management of their diabetes, and nearly half had
evidence of at least one micro-vascular complication of diabetes
(neuropathy, retinopathy, or nephropathy). Based on chart review of
primary care visits and hospitalization reports, 72% of the subjects had
hypertension, 63% had hypercholesterolemia, and 19% had known
Of the 32 subjects who attended at least one session, only the 24
subjects who attended three of the four sessions were included in the
comparison of the pre- and post-intervention outcomes. Several subjects
had incomplete data, missing either clinical measures such as blood
pressure and weight due to late arrival at the session or incomplete
surveys. Of the 12 subjects enrolled in the first cohort, only seven
returned completed six-month survey results. Eight had six-month
HgbA 1 c values drawn, and 10 had blood pressure values documented in
the clinic record at six months.
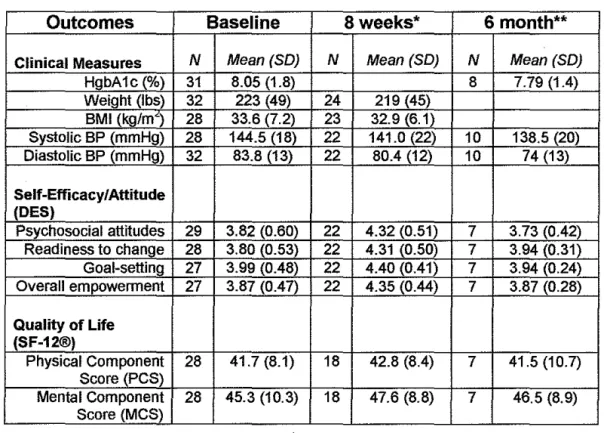
Results of the pilot study are shown in Table 5. HgbA1c, weight,
BMI, and blood pressure all showed small improvements. Attitudes about
diabetes and self-efficacy (as measured by the Diabetes Empowerment
Survey overall score) demonstrated improvement at 8-weeks, but a return
to baseline levels at 6-months. This finding was evident in all three of the
subscales as well. Quality of life (as measured by the SF-12® survey)
showed minimal improvement after the intervention.
DISCUSSION
This study demonstrated the feasibility of provider-run group visit
program for diabetes education and management in a university-based,
primary care clinic. Overall, there were trends towards improved outcomes
in clinical areas such as HgbA1c, BMI, and blood pressure control. As
about diabetes, self-efficacy, and quality of life after the eight-week
intervention, but it did not show lasting benefits in these areas at six
months.
This feasibility study identified important problem areas when
implementing this type of program in a real-world clinic setting. We
attempted to create and implement this program with limited resources
and support staff; somewhat similar to what most primary care clinics
would be able to dedicate to such a program. Because of these limited
resources, implementation was challenging with the most difficult area
being patient recruitment and enrollment. We found that of the 84
inquiries made about the program, only 32 (38%) patients actually
attended a session. This represents less than 15% of our clinic's total
diabetic population. Maintaining attendance was also difficult with only
one-third of subjects attending all four sessions. This low level of interest
in diabetes education and management is not surprising. One survey in
Philadelphia found that only 22% of subjects with diabetes had ever
attended a diabetes education program and found that physician
recommendation, female gender, insulin use and higher degree of obesity
were important predictors of attendance.[40] Future strategies must
develop ways to increase the interest in diabetes education programs and
in reducing barriers to attendance. Our program will need to increase
exposure of patients to the idea of the diabetes program and to strengthen
incentives and systems to promote attendance may be helpful. Increased
group size and more consistent attendance will improve the cost-benefit
ratio for the clinic as a whole-making the clinician time devoted to the
group sessions worthwhile.
Another challenging aspect of implementation was designing and
running the group sessions themselves. We struggled to design each
session with the right balance of information, hands-on skills, and group
discussion. It was always a challenge to keep each group session well
organized and with efficient flow so that all the educational topics were
covered and so that individuals could participate freely in group
discussion. With time, this skill improved for both group leaders. Future
research should identify which aspects of the curriculum are the most
effective. Qualitative feedback from group participants may contribute
useful information as well.
This pilot study has several limitations. The subjects were not
randomized, and there was no control population. As this was a
feasibility study, we needed to recruit enough patients in order to run
several group sessions. The patients were likely to be a highly motivated
group as they were either self-selected or identified by their primary care
physician. Involvement was voluntary, and analysis included only those
subjects who agreed to participate. The effects of this program cannot be
effectiveness of this intervention, a randomized controlled trial will be
needed to eliminate the bias of selection and other confounding factors.
Because this study was conducted in a real-world clinical setting,
most of the data collection was obtained from routine clinical care, and not
research-driven protocols. This fact limited the completeness and
precision of the values collected. For example, clinical data such as blood
pressure levels were obtained from chart review of routine primary care
visits. No attempt was made to standardize the way that our clinic staff
measured blood pressure. Similarly, HgbA1c at six-month follow-up was
identified through chart review. Only a disappointing two-thirds of patients
had a follow-up value measured between five and seven months after
involvement in the program.
Another potential limitation is the variation between the two
providers leading the group sessions. Differences in experience, teaching
style, and personality may have had dissimilar effects on patients. The
curriculum outline and materials used were standardized to limit this
variation as much as possible.
The greatest limitation of this intervention is its short duration.
Patients did demonstrate changes in attitude and self-efficacy on
completion of the eight-week intervention; but it is maintaining these
improvements over time that may have the greatest health impact. Group
visit interventions with longer duration (at least six months) have often
A short-term group visit program in a primary care clinic appears
feasible, though patient recruitment and attendance need to be improved
to maximize cost-effectiveness. Developing an even more innovative
model of care is the next step, involving group visits for routine diabetes
management and education instead of individual, primary care visits. This
has been done in a few selected settings, most notably two large HMO
studies and in a specialty-run diabetes clinic in ltaly.[31, 32, 34)
Determining whether primary care providers in a non-specialty based
clinic can apply this model; whether it will be efficient and cost-effective;
and whether it will improve health outcomes needs to be studied.
Providing more efficient and effective primary care strategies for the
growing diabetic population is an essential undertaking for our healthcare
system. A group visit program for management of diabetes in primary care
Table 1-Curative Factors of Group Therapy[12]
Curative Factor Clinical Examples
Interpersonal Learning Patients learn from each others experiences with diabetes
Catharsis Sharing the emotions associated with diabetes such as venting anger and sharing fears
Group Cohesiveness Sense of belonging to the group helps to promote self-esteem and decrease isolation Insight Listening to others with diabetes can help
patients to understand why they feel or act the way that they do.
Development of Getting feedback from others helps to motivate Socializing Technique change
Existential Factors Membership in the group may help to generate improved outlook on fife
Universality Realizing that they are not alone and that other people struggle with the same problems with diabetes
Instillation of hope Learning from others who have been more successful with their diabetes
Altruism Feeling that the members of the group are
helping one another can be empowering Corrective recapitulation Group may provide a more positive outlook on of family of origin family relationships
Imparting information Sharing of information and learning from each others problem-solving attempts
Table 2- Review of Randomized Controlled Trials Using A Group Visit Model for Diabetes
Frequency of sessions
Study Design Setting Intervention description Population Group size Duration of Follow-up Outcomes
Sadur et al.[31] Randomized Large Multiwdisciplinary Poorly controlled 10-18 Monthly for six months HgbA 1c decreased by 1.3% vs. 0.02% controlled trial HMO (RN/CDE/Psych/RD) Type II OM (no patients with RN phone follow-up (p<0.0001)
Diabetes Care team-led group sessions AIC or>8.5)
1999 us Six month to one year Decreased utilization and increased self-97 Intervention follow-up efficacy
88Control
Wagner et al[32] Randomized Large Multi-disciplinary team Type II OM 6-10 patients Every three to six months No difference in A1c, but did show a trend controlled trial HMO with primary care MD, for decreased A1c with increased Diabetes Care RN, pharmacist, SW 278 Intervention attendance
2001 (Randomized by us 479 Control
clinic site) Seen by MD-then had Increased preventive services, satisfaction group education, social 35% invited with OMeara
support and self- never attended Increased office visits, but decreased ER
management visits
Group led by RN/SW "Mini-clinic" model as in Britain
Trento et al[34l Randomized General Routine group visit with Type II DM 9-10 patients Every three months A1c remained stable in group vs. controlled trial Medicine MD vs. individual (Four sessions per year) worsened in individual visits (p=0.0002) Diabetes Care Clinic with consultations 56 Intervention
2001 diabetes 56 Control Two year follow-up Increased knowledge, Quality of Life, and focus 1 hour group sessions behaviors
run my 1-2 physicians Physicians spent less time, patient had Italy and an educationist more MD time
Patients seen one-on-one by MD if individual attention needed
Rickheim et Randomized Minnesota Group vs. Individual Type II DM 4-8 patients Four sequential sessions Overall A1c went from 8.5% to 6.5% after al[33] Controlled Trial education sessions with over six months 6 months
an evidenced based 87 Intervention
Diabetes Care curriculum 83 Control Total of five to seven A1c decreased by 2.5% vs. 1.7% in group
2002 hours vs. control subjects (p=0.05)
Led by RN and RD
Six month follow-up No difference in knowledge, behaviors,
Qu~iitY of life, or attitud~-(both effectiv9) Raz et al[27] Randomized Diabetes Group diabetes clinic 51 patients Unknown Three weekly lessons Decreased A1c by 1.5-2% after 12months
Controlled Trial clinic held every 4 months vs. every four months (p<0.05)
Diabetes Care individual sessions only Volunteer
1988 Stratified based every 2 months patients only 12 month follow-up No change in knowledge or weight on level of Israel
Table 2 (continued)
I
Monthly group sessions
Southern
I
Used waiting listI
with emphasis on 28 Intervention Medical Journal subjects as behavior change and life 28ControlI
112 month follow-up
I
LDL and cholesterol dropped as well 1999 contol patients skills at six months in the intervention30% drop out Cost $195 group involved on rate
periphery-:--Supportive
~.rson et Randomized Communi! Group education 64p
al[28] Controlled Trial y sessions with focus on (46 random, 18 sessions 11.02% in intervention group patients empowerment for self not randomly compared to 10.82% to 10.78% in Diabetes Care Used waiting list care assigned) 12 week follow-up the control group (p=0.05) 1995 subjects as University
control of Presentations, Improved self-efficacy for goal Michigan worksheets setting, managing stress, obtaining
support, and making decisions 1ily involvement
ged
)torial intervention Type ll DM Unknown Three individual sessions Improved A1c from 8.
trial Center with both intensive group age 45~65 and two large group the intervention group"* compared to Diabetic
I
education and sessions with 20 a 0.2% increase in the control group Medicine Denmark pharmacological therapy 160 patients patients/spouses (p<,0.000001)
2001
Stano Run by a diabetes team Smoking cessation group **Likely due to other aspects of Type2 with physician, dietician sessions with 14 patients intervention such as medication
Study and nurse management
Figure 1-Recruitment of Subjects
Recruitment
Letters to 7 40 patients with DM Fliers and announcements to physicians
Posters in exam rooms
84 Inquires over 8 months
15 Patient Requests 53 Provider Referrals
Agreed to program but never attended
15 subjects (18% oftotal)
16 Other or unknown
Declined Program when program explained
12 subjects (14% oftotal) 2 (17%) Cost
4 (33%) Time/Schedule
1 (8%) Health Issues
4 (33%) Not interested
Unable to Contact
25 subjects (30% of total)
Patients Enrolled and Attended
Total 32 subjects (38% of total) 6 groups
Morning Sessions (17 total) Cohort 1A-7 subjects Cohort 2A--6 subjects Cohort 3A--4 subjects Evening Sessions (15 total)
Cohort 1 8-5 subjects Cohort 28--4 subjects Cohort 38---6 subjects
Attendance Rates 1 session-2 subjects 2 sessions-6 subjects
Table 3-Demographics of Study Population
Characteristic (N=32) Mean (SO) or % (N) Range
Age 54.2(11.2) 31-75
Year of Diagnosis 1995 1982-2002
Marital status
Manied 61% (19)
Widowed 3% (1)
Single 23% (7)
Divorced 13% (4)
Unknown 3% (1)
Race
Black 75% (24)
White 25% (8)
Gender
Female 50% (16)
Male 50% (16)
Insurance type
Medicaid 3% (1)
Medicare 16% (5)
Private 75% (24)
None 6% (2)
Education Level
Some High School 11% (3)
Completed High School 29% (8)
Some College 61% (17)
Ever attended DM education
Yes 7% (2)
Table 4-Baseline Clinical Characteristics
Characteristic Mean (SD) or % (N) Range
HbgA1c (n-31) 8.05 (1.8) 4.7-12.8
Total cholesterol (n-28) 206.9 (44) 132-339
LDL (n=19) 121.1 (26) 80-171
HDL (n=28) 48.6(12) 32-79
Triglycerides(n=19) 159.4(96) 66-511
Body Mass Index (n-32) 33.2 (7) 19-52.7
Systolic Blood Pressure (n-31) 143.7 (17.7) 118-180
Diastolic Blood Pressure (n-31) 83.9 (12.5) 54-110
DM Management
Diet only 22% (7)
Oral medications 66% (21)
Insulin + oral meds 6% (2)
Insulin only 6% (2)
Microvascular Complications
Yes 47% (15)
No 41% (13)
Unknown 12% (4)
Hypertension
Yes 72% (23)
No 25% (8)
Unknown 3% (1)
Coronary Artery Disease
Yes 19%(6)
No 47%(15)
Unknown 34%(11)
Hypercholesterolemia
Yes 63%(20)
No 25%(8)
Table 5- Results of the Intervention
Outcomes Baseline Sweeks* 6 month**
Clinical Measures N Mean(SO) N Mean (SO) N Mean (SO)
HgbA1c (%) 31 8.05 (1.8) 8 7.79 (1.4)
Weight (lbs) 32 223 (49) 24 219 (45)
BMI (kg/m') 28 33.6 (7.2) 23 32.9 (6.1)
Systolic BP (mmHg) 28 144.5 (18) 22 141.0 (22) 10 138.5 (20)
Diastolic BP (mmHg) 32 83.8 (13) 22 80.4 (12) 10 74(13)
Self-Efficacy/Attitude (DES)
Psychosocial attitudes 29 3.82 (0.60) 22 4.32 (0.51) 7 3.73 (0.42)
Readiness to change 28 3.80 (0.53) 22 4.31 (0.50) 7 3.94 (0.31)
Goal-setting 27 3.99 (0.48) 22 4.40 (0.41) 7 3.94 (0.24)
Overall empowerment 27 3.87 (0.47) 22 4.35 (0.44) 7 3.87 (0.28)
Quality of Life (SF-12®)
Physical Component 28 41.7 (8.1) 18 42.8 (8.4) 7 41.5 (10.7)
Score(PCS)
Mental Component 28 45.3 (10.3) 18 47.6 (8.8) 7 46.5 (8.9)
Score (MCS)
*For eight-week clinical follow-up, subjects who attended at least three sessions but missed the last session were included with values from the 3'd session (six weeks).
REFERENCES
1. Center for Disease Control and Prevention, National Diabetes Fact Sheet: Genera/Information and National estimates on diabetes in the United
States 2000. 2002, Atlanta, GA: US Department of Health and Human Services. 74.
2. DCCT Group, The effect of intensive insulin treatment of diabetes on the development and progression of long-term complications in insulin-dependent diabetes mellitus. N Eng J Med, 1993. 329: p. 977-986.
3. UKPDS Group, Intensive blood glucose control with sulphony/ureas or insulin compared with conventional treatment and risk of complications in patients with type 2 diabetes (UKPDS 33). Lancet, 1998. 352: p. 837-853. 4. Beckles, G., et al., Population-based assessment of the level of care
among adults with diabetes in the U.S. Diabetes Care, 1998. 21(9): p. 1432-1438.
5. Saddine, J., Engelgau, MM, Beckles, GL, Gregg, EW, Thompson, TJ, Narayan, KMV, A Diabetes Report Card for the United States: Quality of Care in the 1990's. Ann Intern Med, 2002. 136: p. 565-754.
6. Center for Disease Control and Prevention, Diabetes SuNeillance, Statistics. 1999.
7. Tuomilehto, J., et al., Prevention of type 2 diabetes mellitus by changes in lifestyle among subjects wt1h impaired glucose tolerance. New Eng J Med, 2001. 344(18): p. 1343-50.
8. Renders, C.M., et al., lnteNentions to improve the management of diabetes in primary care, outpatient, and community settings: a
systematic review. Diabetes Care, 2001. 24(10): p. 1821-33.
9. Harris, M., Non-insulin dependent diabetes mellitus in black and white Americans. Diabetes Metabolism Review, 1990. 6: p. 71-90.
10. Thompson, E., The power of group visits. Improved quality of care, increased productivity entice physicians to see up to 15 patients at a time.
Modern Healthcare, 2000. 30(23): p. 54, 56, 62.
11. Wellington, M., Stanford Health Partners: rationale and early experiences in establishing physician group visits and chronic disease
self-management workshops. Journal of Ambulatory Care Management, 2001. 24(3): p. 10-6.
13. Glanz, K., Lewis FM, Rimer, 8, ed. Health Behavior and Health Education: Theory, Research, and Practice. 1997, Josey-Bass: San Francisco.
14. Henry, L., Making Good Time with Group Visits. Family Practice Management, 1997. July/August.
15. Noffsinger, E., Working Smarter. Physicians Practice, 2002. 12(3): p. 18-22.
16. Osborn, L.M., Group well-child care. Clinics in Perinatology, 1985. 12(2):
p. 355-65.
17. Osborn, L., Woolley, FR, Use of groups in well child care. Pediatrics, 1981. 67(5): p. 701-6.
18. Anonymous, Group approach to prenatal care gamers enthusiasm among patients and providers. Disease Management Advisor, 2001. 7(9): p. 137-41, 129.
19. Coleman, E.A., et al., Reducing emergency visits in older adults with chronic illness. A randomized, controlled trial of group visits. Effective Clinical Practice, 2001. 4(2): p. 49-57.
20. Beck, A., et al., A randomized trial of group outpatient visits for chronically ill older HMO members: the Cooperative Health Care Clinic. Journal of the American Geriatrics Society, 1997. 45(5): p. 543-9.
21. Thorn, P., Russell RG, Diabetic clinics today and tomorrow: mini-clinics in general practice. BMJ, 1973. 2: p. 534-536.
22. Thorn, P., Watkins P, Organization of diabetic care. BMJ, 1982. 285: p. 787-789.
23. Masley, S., Phillips, S, Copeland, JR, Group office visits change dietary habits of patients with coronary artery disease-the dietary intervention and evaluation trial (D. I.E. T.). Journal of Family Practice, 2001. 50(3): p. 235-9.
24. Masley, S., Planning Group Visits for High-Risk Patients. Family Practice Management, 2000. 7(6): p. 33-37.
25. Sarkadi, A., Rosenqvist, U, Field test of a group education program for type 2 diabetes: measures and predictors of success on individual and group levels. Patient Education & Counseling, 2001. 44(2): p. 129-39. 26. Norris, S., Engelgau, MM, Narayan, KM, Effectiveness of
27. Raz, 1., Soskolne, V, Stein, P, Influence of small-group education
sessions on glucose homeostasis in NIDDM. Diabetes Care, 1988. 11(1): p. 67-71.
28. Anderson, R., Patient Empowerment: Results of a Randomized
Controlled Trial. Diabetes Care, 1995. 18(7): p. 943-949.
29. Ridgeway, N.A., et al., Improved control of type 2 diabetes mellitus: a
practical education/behavior modification program in a primary care clinic.
Southern Medical Journal, 1999. 92(7): p. 667-72.
30. Gaede, P., et al., Limited impact of lifestyle education in patients with
Type 2 diabetes mellitus and microalbuminuria: results from a
randomized intervention study. Diabetic Medicine, 2001. 18(2): p. 104-8. 31. Sadur, C.N., et al., Diabetes management in a health maintenance
organization. Efficacy of care management using cluster visits. Diabetes Care, 1999. 22(12): p. 2011-7.
32. Wagner, E. H., et al., Chronic care clinics for diabetes in primary care: a
system-wide randomized trial. Diabetes Care, 2001. 24(4): p. 695-700. 33. Rickheim, P.L., et al., Assessment of group versus individual diabetes
education: a randomized study. Diabetes Care, 2002. 25(2): p. 269-74. 34. Trento, M., et al., Group visits improve metabolic control in type 2
diabetes: a 2-yearfollow-up. Diabetes Care, 2001. 24(6): p. 995-1000. 35. Mensing, C., et al, National Standards for Diabetes Self-Management
Education. Diabetes Care, 2002. 25(Supplement 1): p. S140-S147. 36. Anderson, R., Fitzgerald, JT, Funnel, MM, Marrero, DG, The Diabetes
Empowerment Survey: A measure of psychosocial self-efficacy. Diabetes Care, 2000. 23(6): p. 739-743.
37. Ware, J., Kosinki, M, Keller, SD, A 12-item Short Form Health Survey:
Construction of Scales and Preliminary tests of Reliablity and Validity.
Medical Care, 1996. 34(3): p. 220-233.
38. Jenkinson, C., et al., A shorter form health survey: can the SF-12
replicate results from the SF-36 in longitudinal studies? Journal of Public Health Medicine, 1997. 19(2): p. 179-86.
39. Ware JE, K.M., Keller SD, SF-12: How to Score the SF-12 Physical and
Mental Health Summary Scales. Third Edition ed. 1998, Lincoln, Rl: QualityMetric Incorporated.
40. Graziani, C., Rosenthal, MP, Diamond, JJ, Diabetes Education Program
ACKNOWLEDGEMENTS
I would like to thank Paul Dunn, RN, MSN, FNP, CDE and Allen Daugird,
MD, MBA for their help in developing and implementing the program.
Warren Newton, MD MPH has been an excellent mentor in the area of
primary care research. All of the staff at the UNC Family Practice Center
![Table 1-Curative Factors of Group Therapy[12]](https://thumb-us.123doks.com/thumbv2/123dok_us/8345341.2217728/34.927.155.834.170.826/table-curative-factors-of-group-therapy.webp)