i
MINIMIZING DISINFECTION BY-PRODUCT FORMATION BY EVALUATING DRINKING WATER TREATMENT OPTIONS
Michael Weiss
A technical report submitted to the faculty of the University of North Carolina at Chapel Hill in partial fulfillment of the requirements for the degree of Master of Science in Environmental
Engineering in the Department of Environmental Sciences and Engineering in the Gillings School of Global Public Health
Chapel Hill
2015
Approved by:
Howard Weinberg, D.Sc. Advisor
Michael Aitken, Ph.D. Reader
ii
©2015
Michael Weiss
iii
ACKNOWLEDGEMENTS
The author is indebted to the Department of Environmental Sciences and Engineering at
the University of North Carolina at Chapel Hill for their assistance and feedback throughout the
technical report process. In particular, I would like to thank my advisor Howard Weinberg D.Sc.
for his guidance, mentorship, and support throughout the process of completing this report as
well as Professors Mike Aitken Ph.D. and Orlando Coronell Ph.D. for serving on the defense
committee. The author would also like to acknowledge the assistance of the following
organizations and individuals for their participation in this study: Ben Stanford, Cory Hopkins,
Megan Roberts of Hazen and Sawyer; Debra Cutler and Dan Wall of the Johnston County Public
Utility Department; Tiffanie Hawley of the Cape Fear Public Utility Authority; and Ken Loflin
of the Orange County Water and Sewer Authority. The author thanks the Weinberg Research
Group for their help and support in completing the report. The author also thanks Laura
iv
ABSTRACT
Michael Weiss: Minimizing Disinfection By-Product Formation by Evaluating Drinking Water Treatment Options
(Under the direction of Howard Weinberg)
Disinfection byproducts (DBPs) are a category of chemicals that form via reaction of
disinfectants with organic matter during drinking water treatment. Over 600 DBPs have been
identified, yet only eleven are currently regulated in the United States for their potential human
health risks. Unregulated DBPs have recently been shown to have genotoxic and cytotoxic
effects in laboratory studies. Many water treatment plants (WTPs) have switched from traditional
chlorination to chloramination to help meet the requirements of the Disinfection/Disinfection
Byproducts Rules, possibly exposing consumers to elevated levels of unregulated DBPs. When a
WTP considers alternate treatment processes, consulting engineer contractors run expensive pilot
testing with little independent information to guide a WTP’s decision. Data obtained from state
WTPs, current literature, readily available source water parameters, treatment methodologies,
and economics were utilized in the design of a decision tree which can assist WTPs in choosing
v
TABLE OF CONTENTS
Section 1: Introduction and History of DBP Regulation ...1
Section 2: Methods of Disinfection and Treatment ...3
Section 3: Significance of the Problem ...7
Section 4: Methodology ...10
Section 5: Switching to Chloramination ...13
Section 6: Incorporation of MIEX ...17
Section 7: Ozonation ...22
Section 8: Ultraviolet Irradiation ...26
Section 9: Enhanced Coagulation ...30
Section 10: Decision Tree ...32
Section 11: Economic Costs ...42
Section 12: Summary and Conclusions ...45
vi LIST OF TABLES
Table 1: Disinfection techniques and associated impact on various DBPs ...10
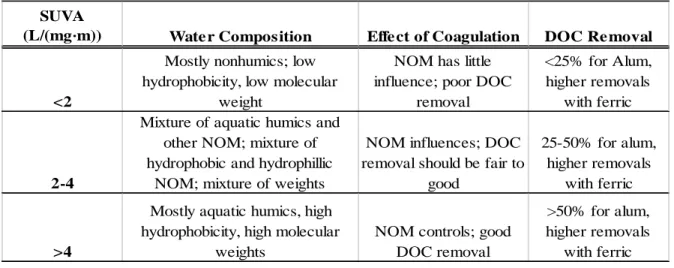
Table 2:SUVA values of NOM and corresponding composition ...34
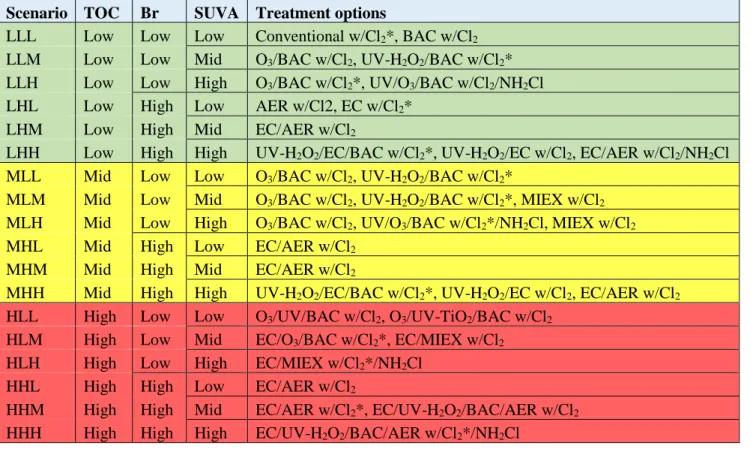
Table 3: Summary of decision tree scenarios and associated treatment ...35
Table 4: Annual costs of treatment technology for increasing demands ...44
vii LIST OF FIGURES
Figure 1: UV absorbance of raw water and MIEX treated waters of Johnston County, NC ...18
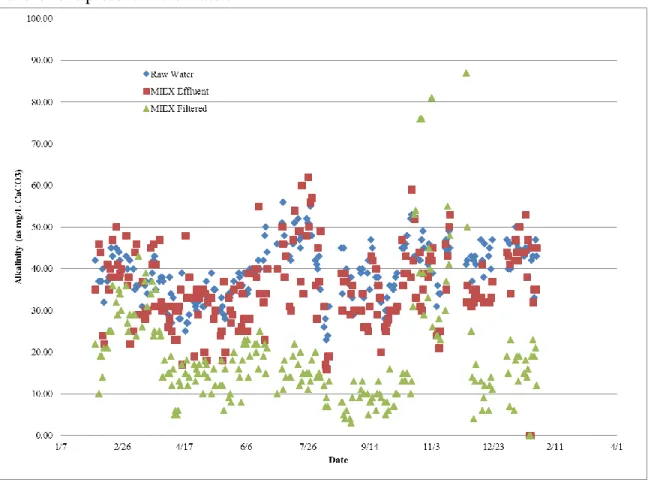
Figure 2: Alkalinity of raw and MIEX treated waters for Johnston County, NC ...19
Figure 3: Impact of high ozone conditions (5 mg ozone per mg C) on TOX distribution under chlorination and chloramination. ...24
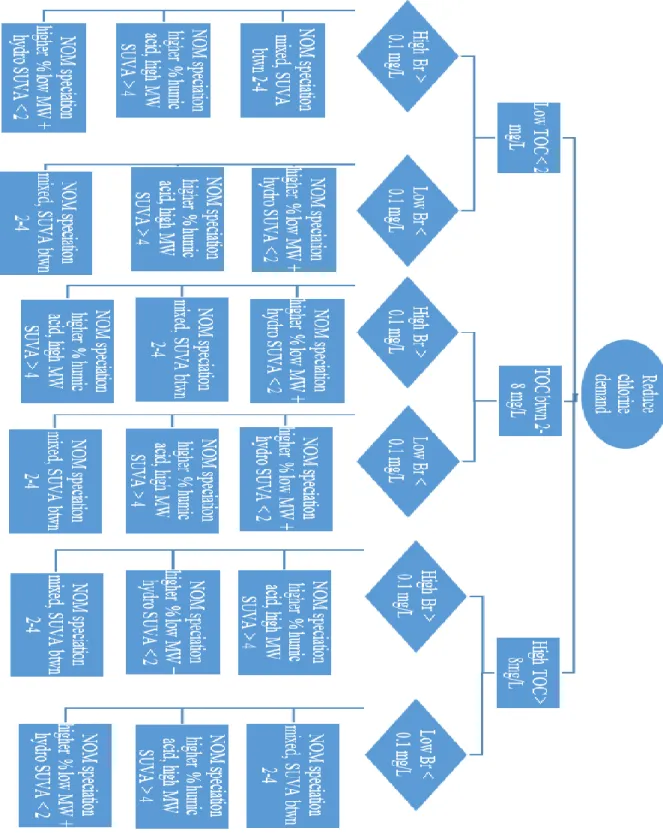
Figure 4: Decision tree outlining different treatment scenarios based on source water parameters ...36
viii LIST OF ABBREVIATIONS
AER - anion exchange resin
AWWA - American Water Works Association
AWWARF - American Water Works Association Research Foundation
BAC - biologically active carbon
BDOC - biodegradable organic carbon
Br - bromine/bromide ion
C-DBP - carbonaceous disinfection byproduct
CDI - capacitive deionization
CFPUA - Cape Fear Public Utility Authority
cm - centimeter
CNX - cyanogen halide
CP - chloropicrin
CT - measured disinfectant residual × time
CWS - community water system
1,1-DCP - 1,1-dichoropropanone
Da - daltons
D/DBP - disinfectant/disinfection byproduct
DBP - disinfection byproduct
DBPFP - disinfection byproduct formation potential
DBPR - Disinfectants and Disinfection Byproducts Rule
DENR - Department of the Environment and Natural Resources
DHAA - dihaloacetic acid
DHAN - dihaloacetonitrile
DOC - dissolved organic carbon
DOM - dissolved organic matter
DXAA - dihalogentated acetic acid
EBCT - empty bed contact time
EC - enhanced coagulation
ix
FP - formation potential
GAC - granular activated carbon
gpd - gallons per day
gpm - gallons per minute
H2O2 - hydrogen peroxide
HAA - haloacetic acid
HAA5 - sum of five regulated haloacetic acids
HAA9 - sum of the nine haloacetic acids
HAN - haloacetonitrile
HK - haloketone
HNM - halonitromethane
HPC - heterotrophic plate count
I-DBP - iodinated disinfection byproduct
MCDI - membrane capacitive deionization
MCL - maximum contaminant level
MCLG - maximum contaminant level goal
MF - microfiltration
MGD - million gallons per day
MHAA - monohaloacetic acid
MIEX - magnetic ion exchange
µm - micrometer
mm - millimeter
µg/L - micrograms per liter
mg/L - milligrams per liter
MW - molecular weight
N-DBP - nitrogenous disinfection byproduct
NDMA - N-nitrosodimethylamine
NF - nanofiltration
nm - nanometers
x
NPDWR - National Primary Drinking Water Regulation
NPOC - non-purgable organic carbon
O&M - operations and maintenance
O3 - ozone
OWASA - Orange County Water and Sewer Authority
PAC - powdered activated carbon
PACl - polyaluminium chloride
PEC - photoelectrocatalysis
ppb - parts per billion
ppm - parts per million
PWS - public water supply
RO - reverse osmosis
SDWA - Safe Drinking Water Act
SUVA - specific ultraviolet absorbance at 254 nm
SWTR - Surface Water Treatment Rule
TDS - total dissolved solids
THAA - trihaloacetic acid
THM - trihalomethane
THMFP - trihalomethane formation potential
THM4 - sum of four regulated trihalomethanes
TiO2 - titanium dioxide
TOC - total organic carbon
TOX - total organic halide
TTHM - total trihalomethane
TSS - total suspended solids
UF - ultrafiltration
UTOX - unknown total organic halide
UV - ultraviolet
UV254 - ultraviolet absorbance at 254 nm
1 Section 1: Introduction and History of DBP Regulation
All 300 million people in the United States must drink water to live. Most do so from
publicly provided water treatment plants, assuming that their drinking water is safe. Yet safe
becomes a relative term when discussing the disinfection byproducts (DBPs) that remain in
drinking water. DBPs are a category of chemicals that form in water during the water treatment
process. Strong oxidizing agents, usually chlorine or chloramine, are used to disinfect water but
react with organic and some inorganic molecules in the water to form these unintended
compounds, the DBPs. Studies have linked certain DBPs with various health consequences
ranging from mild irritation to anemia and cancer to birth anomalies. This report includes an
overview of the chief regulations driving water disinfection, the studies discovering the health
risks of DBPs, the types of byproducts, and the water treatment processes available with evaluation
of the pros and cons of said processes. Ultimately, a decision tree was formulated to assist
responsible civic leaders, individuals, communities and water treatment plants in the choice of the
best method of water treatment for their specific source water situation.
The United States Environmental Protection Agency’s (EPA) mission is “to protect human
health and the environment”1 and as such is responsible for setting water quality standards across
the United States. In 1974, the U.S. Congress passed the Safe Drinking Water Act, which required the EPA to determine the level of contaminants in drinking water which “may have any adverse
effect on the health of persons”2; however, DBPs were omitted from the act until amendments
were added in 1998.3 The DBP regulations were passed due to studies linking high concentrations
of DBPs to increased risks of bladder cancer4,5, reproductive abnormalities, and birth anomalies6,
2
longitudinal comparisons of human populations that may not have accounted for other factors
affecting carcinogenesis.
The Stage 1 Disinfectants and Disinfection Byproducts Rule (Stage 1 DBPR) was implemented to reduce “exposure to disinfection byproducts for customers of community water
systems and non-transient non-community systems, including those serving fewer than 10,000
people that add a disinfectant to the drinking water during any part of the treatment process”3. The
Stage 1 DBPR required water treatment facilities to begin monitoring for the specific DBPs
bromate, chlorite, total trihalomethanes (TTHM) and five haloacetic acids (HAA5), and for them
to be below specified maximum contaminant levels.8 Public water utilities were required to
develop monitoring plans, implement the plans, and report the results to the EPA by 2004. The
additional monitoring costs added up to approximately 2.3 billion dollars nationally which resulted
in a one dollar or less increase in water prices per month per household for 95% of Americans.9
Issues concerning the Stage 1 DBPR were addressed when the Stage 2 DBPR was passed
in 2006. Stage 2 DBPR improved upon Stage 1 by providing more consistent protection from
DBPs across drinking water distribution systems and by focusing on the reduction of DBP peaks
especially for TTHM and HAA5 levels.10 TTHM has been shown to increase the risk for colon
cancer, bladder cancer, and birth defects while HAA5 has been shown to increase the risk for liver
tumors, male reproductive development damage, and prenatal development as well.11
At the state level, the Division of Water Resources within the North Carolina Department
of Environment and Natural Resources (DENR) is responsible for ensuring state water utilities
meet EPA standards. An additional layer of organization, the Public Water Supply Section within
DENR, must regulate the 6,000 plus public water systems in North Carolina and guarantee the
3
Locally, the Orange Water and Sewage Authority (OWASA) supplies water to Chapel Hill
and Carrboro through rainwater collected in the Crane Creek and University Lake Watersheds.
OWASA must meet all EPA and any additional state water quality standards (although North
Carolina has no additional DBP regulations) otherwise the state/EPA can provide technical
assistance to meet the standards or the state/EPA can take legal action against systems that fail to
comply. According to a 2013 report by OWASA, the utility has never failed to meet DBP criteria
and currently uses chloramines as a disinfectant since it “produces fewer DBPs than chlorine”.13
As to the validity and health implications of the latter statement, the scientific jury is still out.14, 15
For example, chloramine is less reactive and more stable than chlorine which is generally a positive
in terms of forming potentially toxic DBPs; however, chloramines can generate other DBPs which
are not routinely analyzed such as those containing iodine and nitrogen, which may be more toxic
than regulated DBPs.15
Section 2: Methods of Disinfection and Treatment
As discussed in section 1, DBPs form when strong oxidizing agents are used to disinfect
drinking water; however, there are many different forms of disinfection, each with a varying
potential to form DBPs. The methods of disinfection include chlorine and chloramine
independently, and chlorine and chloramine in conjunction with: UV-H2O2,ozone, ion exchange
resins, photoelectrocatalysis with TiO2, and potentially others. Chlorine or chloramine must be
used as a terminal disinfectant, even when other oxidation techniques are used to deactivate
microbes, in order to maintain a disinfection residual that will prevent microbial growth throughout
4
Chlorine and chloramine are both strong oxidizing chemicals used in most water treatment
plants (WTPs). There has been a large increase in the number of plants using chloramine as the
primary disinfectant since the EPA passed the Stage 1 and 2 DBP Rules, but the byproducts
associated specifically with chloramine are less regulated. Over 20% of U.S. citizens drink water
that has been treated with monochloramine as a means to reduce formation of TTHMs and
HAAs17; however, less is known about the health risks associated with the unregulated DBPs that
may form as a consequence of chloramine use. For example, chloramine is more likely than
chlorine to generate hypoiodous acid (HOI) from iodide in a manner which allows it to react with
NOM to form iodinated DBPs (I-DBPs)18 which have been shown to be more cytotoxic than other
halogenated DBPs.19, 20 This process does not occur with free chlorine, as it oxidizes HOI to iodate
and thus limits the potential formation of iodinated DBPs.
As the residual of chloramine decreases through bulk water reactions and pipe
wall/sediment reactions within the drinking water distribution network, free ammonia can be
released resulting in nitrification and water quality degradation.21 The chlorine to ammonia mass
ratio and pH is essential for maintaining the effectiveness of chloramine as a disinfectant
throughout the distribution system. The Cl2:N mass ratio is usually kept between 3:1 and 5:1 (with
the American Water Works Association recommending a 4.5:1 ratio for drinking water) at a pH of
7-9 in order to help maintain monochloramine as the dominant disinfectant over dichloramine.21
Nitrification of a water system directly and indirectly affects water quality by lowering pH,
increasing corrosion potential and heavy metal leaching from the piping network, reducing
dissolved oxygen content, disinfectant depletion, and increasing heterotrophic plate count
(HPC).21 However, once nitrification begins as indicated by the presence of ammonia oxidizing
5
increasing chloramine concentrations.21 In order to combat nitrification associated with
chloramine usage, water utilities have embraced the practice of flushing the distribution network
or a burn with free chlorine to reach breakpoint, in order to maintain the correct ratio of chlorine
to ammonia, the latter often resulting in a temporary spike in DBP formation.21
The free chlorination burn may act as a periodic suture to resolve the problems associated
with nitrification and chloramine usage; however, the highly reactive chlorine may only inactivate
the outer layer of the biofilm present within the piping, and, hence, the inner layer of the biofilm
may aid in the reoccurrence of nitrification when the switch is made back to the less reactive
chloramine as the primary disinfectant since it can penetrate the biofilm more deeply and thus
release more components into the distributed water.21 In conjunction with adding free chlorine to
combat nitrification, utilities can also attempt directional flushing of the distribution network
which should help remove the biofilm and sediment present in the piping and increase disinfection
concentration by moving stagnant water.21
Ozone has long been a recognized disinfection technique due to the formation of hyper
reactive hydroxyl radicals that rapidly destroy microbes as well as breaking natural organic
material (NOM) into smaller fragments.22 Ozone has been linked to making “NOM more
hydrophilic and lower in molecular weight, while decreasing dissolved organic carbon (DOC)
content in the hydrophobic fraction”.22 However, ozone is often used in conjunction with hydrogen
peroxide, titanium, and UV light which can further lower regulated disinfection byproduct
formation potential (DBPFP) and degrade NOM more efficiently.22 Ultraviolet (UV) disinfection
used in conjunction with hydrogen peroxide or titanium is similar to ozone in that both generate
6
Ion exchange resins interchange anions with DOC in order to lower DBPFP. An example
reaction might be: Resin−NMe3+Cl- +DOC- ↔ Resin−NMe3+DOC-+Cl-, where a charged
quaternary ammonium resin molecule releases a chloride ion as it attracts the negatively charged
organic content.23 Magnetic Ion Exchange (MIEX) resins treatment could “dramatically reduce the
formation potential of HAAs, THMs and nitrogenous disinfection byproducts (N-DBPs) but due
to the quaternary amine functional groups of the anion exchange resins, they may serve as
precursors for N-DBPs.”24 Exchange resins can shed organic precursors that may contribute to
nitrosamine formation within distribution systems when chlorine disinfectants are added
downstream of the resin, and when free chlorine or chloramine are added upstream of the exchange
resin, nitrosamine, chloropicrin, and dimethylnitramine formation increases have been shown to
be significant.25 Negatively charged halide ions would compete with the negatively charged DOC
for exchange sites on the MIEX resin; a literature review found that bromide adsorption was
inversely related to the alkalinity yet iodide adsorption was not dependent on alkalinity.26 Overall
the adsorption of halides was related to the beginning halide concentration and MIEX resins
should decrease the formation of halogenated DBPs.26 MIEX can be regenerated by backwashing
with either sodium bicarbonate or sodium chloride.
Photoelectrocatalysis (PEC) can be carried out in conjunction with semiconductors
including ZnO, ZnS, WO3, SrTiO3 but most commonly TiO2 and operates by again forming
hydroxyl radicals.27 PEC oxidation has been identified as a good candidate for NOM degradation
due to “oxidation by hydroxyl radicals, reductive dechlorination by superoxide radicals, and
physical adsorption by TiO2”.27 Photocatalysis is often conducted using a slurry of microscopic
particles as the semiconductor, which then requires another treatment step to eliminate the particles
7 Section 3: Significance of the Problem
Extrapolating on the health risks associated with DBPs, the solution is more complex than
identifying determinants and contributing factors. One of the main issues with studying DBP
toxicology is that many levels of DBPs are extremely low (less than 100 nanograms/L) but can
bioaccumulate in body tissue, making ideal studies longer to conduct and more costly. Further,
depending on the disinfection mode (i.e. chlorination vs chloramination), organic carbon content,
inorganic content, reaction time, pH, temperature, and countless other factors, different DBPs of
varying concentrations can form in drinking water. 28 More than 600 distinct DBPs have been
identified in literature; research pertaining to potential health risks is still being conducted.28
As stated above, depending on the mode of disinfection (and many other factors) a
completely different DBP cocktail can be generated. It is, therefore, necessary for water utilities
and communities to be able decide upon the disinfection method which pairs best with their
untreated source water quality in order to minimize the formation of DBPs. Again, all humans
must drink water to live. As the population becomes more aware of potential health hazards of
DBPs, the demand for efficacious yet safe treatments should increase.
When a water treatment plant wishes to consider alternate treatment processes they usually
turn to consulting engineering contractors to run expensive pilot testing with little information
guiding the plant to make their decisions independently. In order to meet the requirements of the
DBPR, many plants have switched from traditionally used chlorine disinfection to chloramination
for which less is known about DBP formation. Some plants choose to stay ahead of regulation in
response to their community’s concerns about water quality issues and consider alternate treatment
strategies but are challenged to find easy-to-implement information to guide their decisions. Thus,
8
utilities to choose the best treatment methods that would minimize DBP formation in their water.
Based on the different methods of disinfection and the impact on the formation of DBPs, the “best”
method or methods of disinfection to reduce DBP formation will further be assessed in terms of
implementation costs, feasibility of implementation, and under what scenarios it will be best to
utilize a particular disinfection method.
Hence, a goal of this technical report is to develop a decision matrix where, given a series
of conditions (e.g. NOM, salinity, alkalinity, etc.), drinking water treatment operatorswill be able
to determine the best method of disinfection and associated costs depending on the required DBP
minimization.
While sedimentation and coagulation prior to disinfection have a large impact on DBP
formation potential and high pressure filtration could be used post disinfection to remove DBPs
formed, this technical report will mostly limit the scope of DBP formation by focusing on the
effects of disinfection, as that is where DBPs are formed. It should be noted that most NOM can
be removed by coagulation; however, “the hydrophobic fraction and high molar mass compounds
of NOM are removed more efficiently than hydrophilic fraction and the low molar mass
compounds”27, which results in subsequent DBPFP arising from the smallest and most difficult to
remove NOM. While studies have indicated that filtration methods are able to adequately remove
NOM and lower DBPFP, biofouling could increase the levels of DBPs above EPA limits.29
Pressure-based membrane technologies for water treatment have become more
commonplace and include reverse osmosis (RO), nanofiltration (NF), ultrafiltration (UF) and
microfiltration (MF), which all have different NOM and particle removal potentials. The use of
nanoparticles (including alumina, silica, silver, and iron oxide) in membrane structures has gained
9
nanoparticles being released into the water.30 High energy requirements and membrane biofouling
effects on water pose potential limitations on the widespread implementation of membrane
technologies; however, a novel method of reducing membrane fouling incorporates the
immobilization of TiO2 photocatalyst on the membrane surface.30
Since bromine- and iodine-containing DBPs are often linked with greater health risks than
those containing chlorine, special focus is made on how to remove halide ions or reduce halogen
DBPFP. Membrane techniques have excellent halide removal efficiencies, but membrane
technologies can be expensive and energy demanding. Electro-chemical techniques such as
electrolysis, capacitive deionization (CDI), and membrane capacitive deionization (MCDI) can
also have good halide removal abilities; however unlike the membrane techniques, they do not
efficiently remove NOM, which is paramount for controlling DBPFP.31 Studies on bromide and
iodide removal using adsorption techniques (layered double hydroxides, silver impregnated
activated carbons, carbon aerogels, ion-exchange resins, aluminum coagulation, and soils) have
shown mixed results, with the primary constraint being interference from competing anions and
NOM, resulting in diminished halogen adsorption.31
CDI is an emerging electrolysis technology in which ions are removed from a solution
through an induced electrical potential between porous activated or aerogel carbon electrodes,
while MCDI is a modification of CDI in which ion exchange membranes are included as well.31
Layered double hydroxides consist of positively charged metal hydroxide layers capable of ion
exchange and absorbency.31 Determining the best or hybrid choice for halide removal and
minimization of DBPFP is limited by the amount of information available on each subject, as well
10 Section 4: Methodology
In order to create a DBP decision matrix, first a set list of DBPs must be generated. While
there are over 600 known DBPs and emerging DBPs are always being discovered, for purposes of
feasibility the most common and most potentially hazardous DBPs, based on a scientific review,
will be the main focus for optimizing treatment. Included in that list are the 11 DBPs currently
regulated by the EPA as well “high priority” DBPs currently identified in literature but not
routinely measured in drinking water.28 Most of the high priority DBPs are halogen-containing
including trihalomethanes, brominated and chlorinated forms of haloacetonitriles (HANs),
haloketones (HKs), haloacids, and halonitromethanes (HNMs). 28 The DBPs of focus will almost
certainly be dynamic in the inclusion or removal of DBPs depending on where the research sheds
light. As indicated in Table 1, different disinfection methods and treatment options result in
differing efficacies of decreasing DBPFP for different types of DBPs, each with their own
associated costs.
In addition to a list of DBPs to focus on, a list of formation factors will have to be
determined. The factors will have to be readily available from research and case studies. Based on
the completed research, the list could include, pH, temperature, reaction time, NOM, total organic
carbon (TOC), total organic halides (TOX), turbidity, water source, molecular weight, and others. Table 1: Disinfection techniques and associated impact on various DBPs. 32 Abbreviations: THMs (trihalomethanes), NDMA
(N-nitrosodimethylamine), FP (formation potential)
DBP Chlorine Chloramines Ozone Coagulation Bio Filtration
THMs Forms Minimizes formation Reduces FP Reduces FP Small impact
Haloacetonitriles Forms
May reduce
formation Reduces FP Reduces FP Small impact
Chloropicrin Forms
May reduce
formation Increases FP Reduces FP May reduce FP
Trihaloacetaldehydes Forms Minimizes formation Increases FP Reduces FP May reduce FP
Iodinated DBPs
Oxidizes iodide to
iodate Preferentially forms
Oxidizes iodate to
odate Reduces FP Small impact
NDMA Reduces FP Preferentially forms Reduces FP
Certain polymers
11
Short and long term problems could also be factored into creating the decision tree. For short term
problems, meeting and maintaining current DBP water quality regulations will be the main focus.
As for longer term opportunities, possible future regulations/policies, drought scenarios, budgetary
limitations, and public perception will be included within the decision matrix. Future DBP
regulations, enacted at either the state or federal level, could include byproducts more closely
associated with chloramine, or more hazardous DBPs such as iodinated, brominated, or N-DBPs.
Extreme drought scenarios may require storage of treated secondary effluent in a reservoir or a
quicker turnover before treatment at a WTP, resulting in higher concentrations of DBP precursors
or residuals that might begin to accumulate in the public drinking water supply, hence requiring
supplementary treatment to reduce DBPs. As public awareness of DBPs and their health impacts
increases, community outcry might force water utilities to optimize water treatment methods that
will reduce DBPFP.
Working together with local and state water treatment utilities will provide real world
information and historical data about which disinfection techniques they currently use and have
used in the past and the subsequent effects any change in disinfection methods had on water
quality. The utilities will provide invaluable information about issues they might have had with
DBPs and how their disinfection method of choice has had an impact on solving DBP-related
problems. This might even include anecdotal stories on what has and has not worked in terms of
disinfection history. For example, OWASA made the switch from chlorine to chloramine in 2002,
stating the reason was attributed to improved taste and odor and overall quality of drinking water34,
which has reduced the levels of DBPs specifically mentioning THMs and HAAs. Conversely, the
Cape Fear Public Utility Authority (CFPUA) in Wilmington, North Carolina operates a
12
NC35. By being able to work with OWASA and CFPUA, data regarding the switch from
conventional treatment to alternative treatments and any resulting problems (nitrification,
unregulated DBPs, etc.) will allow for the creation of a more realistic decision matrix.
Incorporating any additional information from other water treatment plants throughout North
Carolina will only improve upon the analysis.
Lastly, the costs associated with the water treatment techniques described in Section 2 were
incorporated from current water treatment plants and pilot studies. The costs will obviously matter
in deciding which technique to implement, but reducing DBPFP and protecting public health
should take precedence. Feasibility of retrofitting a plant to incorporate any of the disinfection
processes could add another layer of difficulty in utilizing the decision matrix. By working in
conjunction with NC water utilities (including OWASA) and planning for potential future water
problems, a case study will determine the feasibility of implementing recommended water
treatment techniques in order to overcome possible future obstacles.
In order to determine which factors to include when deciding the best disinfection method
for a given water quality objective, this report investigates North Carolina water utilities that have
switched from one disinfection method to another. This report also analyzes pilot studies and bench
scale tests from the available scientific literature. Unless specified, the incorporation of an
alternative disinfection process is changing from conventional treatment with chlorination as the
13 Section 5: Switching to Chloramination
As mentioned in Section 2, chlorine and chloramine are both strong oxidants that are used
for disinfection purposes in nearly all municipal drinking WTPs in the U.S. There has been a large
increase in the number of plants using chloramine as the primary and secondary disinfectant since
the Stage 1 and 2 D/DBP Rules were promulgated, but less is known about the byproducts
associated with chloramine compared to chlorine and most are not regulated in drinking water.
A 2010 bench scale study of 11 water systems in the U.S. found that the use of chloramine
as the primary disinfectant, in comparison to chlorine, lowered the amount detected of nine HAAs
(HAA9) and four THMs (THM4).36 No specific disinfection goals were mentioned, as the chlorine
was added at a 3:1 weight ratio depending on the non-purgable organic carbon (NPOC), while a
chlorine to nitrogen mass ratio of 3:1 was used to form monochloramine which was then added
based on the NPOC level, with a combined chlorine to NPOC ratio of 3:1 by weight. While the
study suggested there was a general decrease in DBP concentrations (although the measured DBPs
are generally associated with chlorination) when shifting from chlorine to monochloramine, the
exception being haloketones specifically 1,1-dichloropropanone (1,1-DCP), there were large
variations between some of the sample results.36 The study did acknowledge the relative toxicity
between differing “classes” of DBPs, specifically making sure to note I-DBPs
(dichloroiodomethane and dibromoiodomethane) and bromo-DBPs (which were found to be at
higher concentrations when disinfected with chloramine) are more cytotoxic and genotoxic than
their chlorinated counterparts, likely due to iodine and bromine acting as better leaving groups due
to their greater polarizable bondings.36 While the results may seem promising for chloramination,
the correlation coefficients between the lower concentrations of iodo- and bromo-DBPs were not
14
A 2014 study compared carbonaceous, nitrogenous, and iodinated DBPFP from NOM
fractions with different hydrophobicities and molecular weight (MW) distributions after both
chlorination and chloramination. After introducing an iodide spike into the raw waters, the study
found that for chlorination, hydrophobic and NOM fractions with a MW less than 1 kDa tended to
form more carbonaceous DBPs (C-DBPs), and the dominant byproducts were the four regulated
THMs.37 The N-DBPs were formed from both hydrophilic NOM and NOM fractions with a MW
greater than 10 kDa, as well as hydrophobic NOM and NOM fractions with a MW less than 1 kDa,
depending on the water source, while the I-DBP formation came from the hydrophilic fraction at
both weights. Conversely for the chloraminated waters, NOM with a MW less than 1 kDa was the
dominant source of C-, N- and I-DBP formation and the amount of iodinated DBPFP was 2.5-10
times higher than chlorination.37 Since low MW and hydrophilic NOM is more difficult to remove
by conventional water treatment, the results imply that utilities might have to implement
alternative DBP control technologies when using chloramination.
A study as early as 2002 identified the formation pathways of the toxic and carcinogenic
N-nitrosodimethylamine (NDMA) by reactions involving monochloramine38 which was
interestingly not sampled for in the 2010 study discussed above. Moreover, that 2010 study only
cursorily analyzed or ignored any possible correlations between pH, TOC, specific UV absorbance
(SUVA), temperature, contact time (CT), and DBP formation. SUVA is defined as the UV
absorbance at 254 nm of a water sample normalized with respect to the DOC (TOC that can pass
through a 0.45 micron filter) concentration, expressed in units per meter of absorbance per mg/L
of DOC, or L/mg C/m.22
With the purposeful introduction of a nitrogen-containing compound in the form of
15
were found at elevated levels in chloraminated drinking water, consistent with a formation route
such as the monochloramination of formaldehyde. Further, the potential for formaldehyde release
from ozonation and chlorination of NOM indicates either of these treatments preceding
post-chloramination are combinations likely to promote CNX formation in potable water.39
Haloacetonitriles (HANs) can be produced through both chlorination and chloramination,
dependent on the precursors present; preoxidation with chlorine dioxide and post disinfection at
an acidic pH have been observed to enhance HAN formation. It has also been suggested that
common water treatment processes such as coagulation and filtration are typically rather
ineffective for removing dissolved organic nitrogen in general and N-DBP precursors in
particular.39
Another factor that could impact DBP formation is whether the monochloramine is formed
in-line or preformed; a 2013 study found in line-formed chloramines yielded higher DBP
concentrations than preformed monochloramine both from a dose of 25 mg/L as chlorine and based
on the results of prior demand tests with free chlorine for a target residual of 1mg/L as Cl2 after 24
hours of contact time.40 The study also found reaction time was more influential than pH for
trichloronitromethane, trichloromethane, trichloroacetonitrile, dichloroacetonitrile and
bromochloroacetonitrile formation. Dihalogenated acetonitriles and trichloronitromethane showed
continuous formation over time, whereas chloral hydrate and haloketone formation levelled off
within a day.40 On the positive side, lower DBP formation was observed for all DBPs studied, with
increasing pH.
An American Water Works Association (AWWA) case study found that the two most
influential factors attributed to dihalogenated haloacetic acid (DXAA) formation during
16
mass ratio was the next most significant contributor to DXAA formation which decreased as the
chlorine to nitrogen ratio decreased. In terms of the characteristics of the NOM present in the raw
water, the most influential factors in the DXAA mass and molar yield models were, in order,
hydrophobic DOC concentration, hydrophobic/DOC ratio, hydrophilic/DOC ratio, SUVA, and
ultraviolet absorbance at 254 nm (UV254).41
The local WTP, OWASA, switched to chloramine as the secondary disinfectant in 2002,
mostly as a means of meeting the requirements of the Stage 1 DBP Rule. Historic data provided
from before the switch showed that total HAAs were often above the regulated level of 60 µg/L,
even reaching levels as high as 90 µg/L in the distribution network. The HAAs were typically mass
speciated as follows: 30-45% as dichloroacetic acid, 30-50% as trichloroacetic acid, 0-15% as
monochloroacetic acid, 0-20% as bromoacetic acid, and 0-10% as dibromoacetic acid. After the
switch to chloramines in 2002, the total THMs rarely rose above 40 µg/L; however, the speciation
of HAAs changed so that almost all were either dichloroacetic acid (30-50%) or trichloroacetic
acid (50-70%). The decline in HAA concentration and occurrence as mostly chlorinated HAAs is
a good sign for public health, but it is possible that any bromide in the raw water produced other
unmeasured DBPs.
Data from before the switch showed that while the THM4 were below the 80 µg/L MCL
leaving the plant, often that total rose to over 100 µg/L at various distribution system sampling
sites. Since the switch to chloramination, the THM4 rarely rose above 40 µg/L when measured
leaving the plant or in the distribution network. Interestingly, before the switch chloroform
accounted for the majority of the THMs (80-90%), with bromodichloromethane accounting for the
second highest amount of approximately 10-20%. After the switch to chloramine, however, the
17
dibromochloromethane at approximately 10-20%. It should also be noted that for one month out
of the year, OWASA, like many utilities that chloraminate, switches to chlorination as the terminal
disinfectant as a means of combating nitrification. During this time, the DBP levels are not reported
and, therefore, not included in the locational running annual average used to meet regulation.
While the modification helped the WTP become compliant with regulations, the shift in
DBP speciation to more brominated forms of THM4, specifically a 10-20% increase in
dibromochloromethane, as a result of chloramine reactions could lead to more health risks. Other
possible health risks faced during chloramination include exposing the water consumer to a
chloramine residual that has a different health concern (i.e., can cause methemoglobinemia and
adversely affect the health of kidney dialysis patients at elevated levels of 0.2 to 0.5 mg/L, above
the chloramine residual regulation of 0.1 mg/L) than a chlorine residual.42 Moreover, among the
halogenated DBPs that are formed during chloramination, less than 40% have been identified and
there may be additional non halogenated N-DBPs that have yet to be discovered.53
Section 6: Incorporation of MIEX
As discussed in Section 2, MIEX or Magnetic Ion-Exchange was developed by Orica
Watercare to remove negatively charged organic contaminants, replacing them with negatively
charged ions, most often chloride.23 In order to be in compliance with the Stage 2 DBP Rule while
maintaining growing water supply demand, the Johnston County WTP’s main course of action
was to reduce organic DBP precursors in their water through the use of MIEX.43 MIEX was only
to be used on the water that was then subsequently treated with free chlorine as the residual
18
produces high water age (nearly two weeks), so the county switched to chloramine as the residual
disinfectant to control DBPs. Even with this switch, DBPs remained high and the county
sometimes experienced nitrification and loss of chlorine residual.43
The County decided to split its distribution system in order to separate chloraminated and
chlorinated water. However, the chlorinated portion of the distribution system had water age in
excess of two weeks, and was more prone to high concentrations of DBPs.43 The majority of places
with water age greater than one week were in the areas that were to be disinfected with free
chlorine. This water was treated with MIEX and thus had reduced levels of organic carbon, which
resulted in lower DBPs even with free chlorine as the residual disinfectant. According to the
consulting company responsible for the MIEX installation, Hazen & Sawyer, a 2007 pilot study
indicated MIEX reduced the UV254 absorbance by at least 50%.44 Figure 1 shows the substantial
19
decrease in UV254 absorbance at the Johnston County WTP after MIEX treatment when compared
to raw water. However, it appears the alkalinity wasmarginally reduced as shown in Figure 2.
The lack of reduction in alkalinity between the raw water and MIEX-treated water is logical
considering MIEX should be replacing negative ions with chloride or carbonate. The post MIEX
filtration process via a typical dual media filter (sand and anthracite) seemed to produce a larger
reduction in alkalinity than MIEX alone, suggesting the filter media is absorbing/reacting with
some of the ions present in the water.
As presented in the 2014 Annual Drinking Water Quality Report filed by Johnston County
Public Utilities, the TOC removal ratio was 1.33 (actual TOC removed divided by the required
removal) and all the regulated DBPs were well within compliance.45 The report did not explicitly
20
greater than 1.0, the County met their TOC removal requirements, proving that MIEX treatment
is indeed improving water quality for the County and an adequate treatment option for current
DBP compliance.
One of the main concerns with using MIEX at a WTP is how it may interact with other
negatively charged ions present in the water such as bromide, iodide and the subsequent impact on
DBP formation. According to a 2006 AWWA bench scale study, MIEX was able to reduce HAAs
to achieve treatment goals but was not able to meet the THM goals unless followed by
coagulation.46 Also a higher proportion of brominated DBP species formed as TOC concentration
decreased 60-70% along the treatment train; yet approximately 30% of the bromide present was
removed by MIEX in pilot studies. A 2013 study agreed with the AWWA research finding that
although the MIEX resin removed some bromide, it removed proportionately more of the reactive
DOC, resulting in a higher ratio of bromide to DOC in the water just prior to chlorination and,
hence, leading to more incorporation of bromide within DBPs.47
According to data acquired from the Johnston County WTP, the concentrations of the nine
regulated organic DBPs (HAA5 plus THM4) in most circumstances decreased in both the
distribution system and at the plant after switching to MIEX. The data compared the speciation of
the HAA5 and THM4, before and after MIEX treatment, in the winter and the summer. The only
instances of increased concentrations occurred in the winter when the average amount of
bromodichloromethane increased by 12 µg/L and chlorodibromomethane increased by 6 µg/L.
While the locational running average concentration of THM4 was still in compliance, the value in
the plant effluent was actually above the regulated 80 µg/L. However, the data does not include
water parameters on the days of the observations and the locations of the measurements within the
21
Additionally, MIEX has the capacity to adsorb iodide, depending on the source water
concentration, which should lead to a decrease in iodinated DBP formation. Less is known about
how MIEX interacts with iodide and the subsequent formation of iodinated DBPs.48 This should
be a focus for future research and a possible concern for public health as studies have shown
iodo-HAAs and I-DBPs in general are genotoxic in primary human lymphocytes with the rank order of
genotoxicity and cytotoxicity for DBPs typically going from those containing iodine, to bromine,
and then chlorine.49
As a relatively recent innovation, there is less real world information available regarding
MIEX being used in conjunction with chloramine; however, there are numerous laboratory studies
that focus on this combination. A 2013 study found that after treating simulated
wastewater-impacted surface water with MIEX and then exposing the water to monochloramine, MIEX
removed approximately 50% of the DOC and 60% of THM/HAA formation potential during each
jar test, but increased the NDMA formation potential by 70% when compared to the raw water.50
This outcome has been seen in other bench scale experiments wherein chloramination of
MIEX-treated waters led to an increase in NDMA concentration compared to the same waters without
MIEX treatment.50 Using MIEX as a pre-treatment option for more heavily contaminated waters
in WTPs using monochloramine, especially when produced from the simultaneous addition of
chlorine and ammonia during post disinfection, the likelihood of NDMA formation is higher and
22 Section 7: Ozonation
Ozone is a powerful oxidizing agent that has been increasingly used as a primary
disinfectant in water treatment due to its ability to inactivate cysts and oocysts, as well as improve
taste, odor, and color. Ozone chemistry results in the formation of the hydroxyl radicals that rapidly
destroy microbes as well as breaking NOM into smaller, hydrophilic fragments.22
An AWWA case study review identified specific WTPs that had recently incorporated
ozone as a disinfectant. The Greater Vancouver Regional District began using ozonation as the
primary disinfectant (with chlorine as the terminal disinfectant) fully in 2002. Two points in the
distribution system experienced substantial decreases in THM concentrations of 23% and 37%,
while other sites observed increases in THM levels by the same amount. Decreases ranging from
3% to 48% in HAA5 levels were observed at five of the six sampling locations after implementing
ozonation. However, at the 95% confidence level, there was no significant difference between the
mean values or variances of the HAA levels before and after ozonation across the distribution
system.51
Another case study presented in the AWWA report investigated a plant that switched to
ozone as the primary disinfectant and chloramine as the terminal disinfectant. The Milwaukee
Water Works obtains water from Lake Michigan and treats it at two conventional water treatment
plants that were modified in 1998 to include ozone addition for primary disinfection; the Linwood
Plant treats an average of 86 million gallons a day (MGD) and the Howard Avenue Plant an
average of 36 MGD. The conversion from chlorine to ozone as the pre-oxidant and primary
disinfectant reduced the already low levels of THM4 and HAA5 in the Milwaukee system. Since
the conversion to ozone, both treatment plants have observed a 30% to 50% reduction in regulated
23
reduced UV absorbing organics in the raw water by 45% to 60% as measured by UV254
absorbance.51 While the report did mention that ozonation leads to a reduction in
chlorine/chloramine dosage to meet residual requirements, DBPs of concern such as bromate,
brominated organics (e.g. bromoform, and bromoacetic acids), and biodegradable organic material
(e.g. aldehydes, acids, and ketoacids) have been found to increase in concentration.51
Another 2012 study compared the yields of regulated and emerging DBPs during
sequenced O3–Cl2, O3/H2O2–Cl2, O3–NH2Cl, and O3/H2O2–NH2Cl oxidation of 11 raw water
samples. For chlorination, O3 and O3/H2O2 pretreatment demonstrated benefits for THM and HAA
control in samples with SUVA values greater than 2.0 L mg-1 m-1, but the treatments
simultaneously enhanced the formation of some emerging DBPs, such as CH, 1,1,1-TCP, and
TCNM.52 Compared with ozone alone, O3/H2O2 generated more CH and HKs during chlorination,
and their extent of formation appeared to depend on the ozone doses. In contrast, ozone and
O3/H2O2 generally were more advantageous for controlling THM, DHAA, and HAN formation
when used prior to chloramination; yet O3 should be used cautiously in the chloramination process
for waters with high bromide concentrations.52 Higher ozone dosages had minor effects on
controlling regulated DBPs but increased concentrations of the emerging DBP species.
Further studies have investigated the effect ozonation has on DBP speciation, specifically
investigating emerging DBPs, including those containing iodine and bromine. Results showed that
preozonation decreased the formation of THMs, HAAs and TOX for most waters during
postchlorination.53 A net increase in THMs, HAAs and TOX was observed for a water of low
humic content. Both decreases or increases were observed in dihaloacetic acids and unknown TOX
(UTOX) as a result of preozonation when used with chloramination.53 A shift toward more
24
Fully brominated species (bromoform, dibromoacetic acid, and tribromoacetic acid) increased
while chlorinated and mixed species decreased as a result of preozonation.53 The increase in
bromo-DBPs during chlorination was more likely attributed to changes in NOM by ozonation. The
authors suggest preozonation increases the reactivity of NOM with bromide as measured by THM
and HAA formation.53 Figure 3 shows how under high ozone conditions (5 mg O3 per mg C) the
DBP concentrations and groupings can shift. In the figure it can be noted that the total amount of
DBPs formed decreased when waters were treated with ozone before chlorination/chloramination,
with an increase in the proportion of brominated species formed during chlorination.
25
Moreover, about 95% of initial iodide was oxidized to iodate by ozone. Subsequent
chlorination or chloramination only formed trace amounts of dichloroiodomethane probably
through the reaction of unoxidized iodide, NOM, and chlorine or chloramines. This confirms that
ozone is effective in the control of iodinated DBP formation by removing most of the iodide from
solution.53 A substantial amount of iodoform was formed by chloramines likely due to the fact that
chloramines can oxidize iodide to iodine but do not further oxidize iodine to iodate. Therefore,
iodine has a longer lifetime in samples treated with chloramines than with chlorine and ozone. As
a result, iodinated THMs, especially iodoform, are more prevalent in waters treated with
chloramine.53
A 2013 study found that high ozone doses (0.6–1.0 mg O3/mg DOC) should be avoided
during chlorination/chloramination, as it increased the formation of HNMs (4.7–5.6 times for
chlorination and 2.1–2.7 times for chloramination), HKs (4.8–7.1 times for chlorination and 2.5–
2.9 times for chloramination) and DHAAs (1.5–2.4 times for chlorination and 0.3–0.6 times for
chloramination), when compared to only chlorinating/chloraminating the water.54 The study found
chloramination, with and without ozonation, is usually the better choice to reduce the DBP yields
but again only a small subset of DBPs were actually measured. In general, the bromine substitution
factor of DBPs from chloramination (with and without ozonation) were lower than those from
chlorination (with and without ozonation)54 possibly attributable to the lower reactivity of
chloramine in comparison to chlorine.
Biologically active carbon (BAC) filtration of ozone-treated water has been increasingly
used by WTPs as it can remove the smaller NOM resulting from ozonation, and thus lower DBP
precursors before subsequent terminal disinfection. Relative to conventional treatment processes
26
dissolved organic nitrogen in the range of 98–99%, 58–72%, 31–53%, 16–93% and 35–74%,
respectively and enhanced the removal efficiency of the precursors for the measured DBPs.55
Ozonation followed by chlorination was found to have no effect on the formation of
dichloroacetamide, and actually increased the formation potential of trichloronitromethane, yet,
when followed by BAC filtration prior to chlorination both DBPs decreased. It was also suggested
that the BAC filtration process has the potential to control halogenated DBPs, including
unidentified DBPs, based on a decrease in the differential UV absorbance at 272nm compared to
conventional and ozone treatments.55
Ozonation can also be implemented after MIEX treatment has removed some of the TOC,
as investigated in a 2013 bench scale study where chlorine was still used as a secondary
disinfectant. The removal of TOC by MIEX resin reduced the ozone demand of the waters studied,
resulting in higher dissolved ozone concentrations and higher CT values for a given amount of
ozone.47 MIEX followed by ozonation led to the greatest reduction in THM formation; however,
since DOC is removed preferentially to bromide by MIEX, subsequent ozonation led to an increase
in bromine incorporation within the remaining THMs. Nevertheless, MIEX was still recommended
as a more appropriate pre-treatment process than alum, as it achieved better TOC and THM
precursor removal while decreasing the production of bromate, especially for bromide
compromised waters in which ozone disinfection is already employed.47
Section 8: Ultraviolet Irradiation
Ultraviolet (UV) irradiation is another alternative oxidation process that has become
27
chlorination/chloramination, in the hope of reducing DBP formation. A study investigating
changes in DBP speciation following UV treatment found that that increasingly higher UV doses
followed by chlorination decreased the maximum fluorescence intensity of all the identified
components of dissolved organic matter (DOM).56 The study utilized the different fluorescent
DOM (FDOM) signals correlated with low or high aromaticity carbon that corresponds to
microbial humic material, terrestrial humic material, and protein tryptophan-like DOM to identify
treatment impacts on each component. It was found that protein tryptophan-like DOM was the
most reactive of all the components to UV treatment, suggesting that UV treatment would be best
suited for raw waters with high protein tryptophan-like DOM such as those which might be
impacted by upstream anthropogenic inputs.56
The use of UV at disinfection doses (40–186 mJ/cm2) prior to chlorination/chloramination
had little effect on the formation of the four regulated THMs; however, UV treatment increased
the formation of trichloronitromethane, tribromonitromethane, and chloral hydrate when followed
by chlorination/chloramination, compared to samples treated with chlorine or chloramine alone.56
UV followed by chloramination also increased cyanogen chloride levels. Samples that were spiked
with nitrate had an increased formation of halonitromethanes following UV irradiation and
chlorination/chloramination which is hypothesized to result from the production of reactive
nitrogen species from photolysis of nitrate, while samples that were spiked with bromide had lower
chloral hydrate formation, likely due to a shift to the bromine-substituted species which were
unfortunately not measured in the study.56 The addition of bromide prior to chlorination reduced
maximum fluorescence intensity for all components compared to ambient samples, possibly
28
A related study found that at typical UV disinfection doses the formation of regulated DBPs
following subsequent chlorination/chloramination were unchanged; however, other DBPs were
affected by UV chlorine/chloramine treatment (namely trihalonitromethanes, chloral hydrate, and
cyanogen chloride), although the most significant changes were only observed at high UV doses
or in samples spiked with nitrate/bromide.57 UV had minimal impact on the formation of THM4,
HAA9, haloacetonitriles, haloketones, and haloacetamides at disinfection doses, while chloral
hydrate formation increased following UV chlorination compared to chlorination alone. Similarly
cyanogen chloride formation increased following UV then chloramination compared to just
chloramination alone, especially for nitrate- and bromide-spiked samples.57
Free chlorine followed by UV (chlorine/UV) has been shown to have comparable
efficiency to UV/H2O2 for the destruction of organic contaminants in water. Adding high doses of
free chlorine (2–10 mg/L) in short contact times (30–60 seconds) and then irradiating with high
energy UV raises concerns about DBP formation, justifiably. A recent study investigated this
disinfection process, finding that it was possible to treat water with chlorine/UV and maintain
regulated DBPs within compliance.58 However, there was evidence that the treatment formed some
DBP precursors, leading to higher organic DBP concentrations in formation potential tests and that
the likely limiting factor for chlorine/UV treatment would be the formation of the inorganic DBP,
chlorate.58
UV in conjunction with hydrogen peroxide generates hydroxyl radicals, which can react
with and break apart NOM. However, increased UV dosage (up to 1000 mJ/cm2) has been found
to increase chlorine demand as well as increase THMs and TOX.59 UV/H2O2 has a similar effect
of increasing chlorine demand by as much as 320% and THMs by 140%.59 Another study
29
SUVA, but these were not matched by reductions in HAA and THM formation potential.60
However, for waters with the most hydrophobic acid fraction removed, UV/H2O2 treatment led to
mineralization of NOM suggesting that when coupled with coagulation or membrane filtration,
UV/H2O2 could achieve substantial reductions in TOC as well as reductions in formation potential
of THMs and HAAs.60 Matching UV/H2O2 with BAC filtration showed significant reductions of
43%, 52%, and 59% relative to untreated raw water for DBPs, TOC, and UV254, respectively.61
The synergy found when incorporating BAC is of importance as UV/H2O2 is only effective at
reducing DBPs, at very high UV fluences (of greater than 1000 mJ/cm2) and initial H2O2
concentration of greater than 23 mg/L.61
It has also been found that the degradation of target compounds with UV/H2O2 and vacuum
UV is several times more efficient than with direct UV photolysis22 and it is possible to improve
the efficacy of UV through the addition of ozone.62 AWWA research has found that combining
the benefits of ozone for oxidation, improving the UV transmittance of water, taste/odor reduction
and virus inactivation, with UV for inactivation of protozoa can provide a cost-effective treatment
strategy, with results of inactivation of Cryptosporidium at greater than 99.999% (5 log) and
Giardia at greater than 99.9% (3 log).Pre-oxidation with ozone resulted in lower THM and HAA concentrations than UV-only treatment for samples from both the inlet and outlet of a 400 gallon
per minute (gpm) pilot scale model distribution system, as well as lower levels of halogenated
DBPs from this water source compared to the non-ozonated UV water. While the bromide levels
of the source water were low, at high doses ozone did increase the formation of biodegradable
organic matter such as aldehydes and ketoacids, as well as bromate.62
A North Carolina WTP situated at the mouth of the Cape Fear River, and with
30
in order by flocculation, coagulation, intermediate ozone, biological filtration, UV irradiation, and
chlorination for storage and ultimately distribution. Prior to this, this WTP had issues meeting the
Stage 2 D/DBP Rule requirements, ultimately deciding to add UV irradiation in 2008 over more
costly MIEX. THMs were the main DBP of concern before the upgrade and, as of April 2015,
THM4 was less than 20 µg/L. Still of concern are sudden drops in raw water quality and saltwater
intrusion, specifically the formation of brominated and iodinated DBPs. In order to combat
possible spikes in TOX, this WTP is considering adding an aeration tank for spray stripping
volatile DBPs out of the drinking water. Whether air stripping DBPs from the treated water will
be effective or will remove the chlorine residual as well are unresolved matters within the academic
community.
Section 9: Enhanced Coagulation
Perhaps the most straightforward approach to minimizing DBP formation is to remove
DBP precursors through coagulation, before choosing to expose the organic matter to powerful
oxidizing agents. Polyaluminium chloride (PACl), aluminum sulfate (alum), and ferric chloride
have been widely adopted in drinking water plants as recognized coagulants, excellent at removing
DBP precursors, specifically hydrophobic, charged, and larger sized (>10 kDa) NOM.63 However,
coagulation has shown poor removal efficiency of neutral, hydrophilic, and smaller NOM
fractions.63 Enhanced coagulation (EC) aims to improve the removal of DBP precursors through
the addition of innovative coagulants, adjusting coagulant dosages, and improving methods.
31
A jar test study of alum and ferric chloride found that in comparison to conventional
treatment practices, EC led to a removal of 50% for DOC, 34% UV254, 21% SUVA, and 28% for
THM formation potential while optimal conditions resulted in the reduction of 74% for DOC, 55%
UV254, 36% SUVA, and 53% for THM formation potential.64 However, for low DOC waters,
additional treatment would be necessary to achieve enhanced removal of NOM and there is no
guarantee that the conventional coagulants will remove all the fractions of NOM equally.
Another study investigated a novel composite high performance PACl coagulant, alongside
the more well-known coagulants for removing DBP precursors; aluminum polymeric coagulants
were slightly more efficient at low dosage, while ferric chloride exhibited better removal at high
dosage compared to aluminum based coagulants, and the composite PACl coagulant was the most
efficient at removing DOM at low dosages.65 Another study investigating the effect of ozone as a
coagulation aid on water with a high level of DOC and calcium hardness, found ozonation prior to
coagulation enhanced DOC removal and decreased THM formation potential.66 Incorporating EC
with MIEX or powdered activated carbon (PAC) is another possibility for the enhanced removal
of DBP precursors, as investigated in a 2014 study.26 Using alum as the coagulant, EC/PAC
obtained a DOC removal of 70% while EC/MIEX enabled a DOC removal of 66%, EC/PAC did
not remove halides, and as such is undesirable for high salt containing waters due to a likely
increase in brominated DBPs in the treated water. While EC/PAC and EC/MIEX reduced the
formation of regulated DBPs, both led to the increased formation of the highly brominated DBPs,
tribromomethane and dibromoacetonitrile.26 Enhanced coagulation can be an effective means of
DBP mitigation, yet shortcomings such as chemical storage, chemical feeds, and sludge disposal
32
The photolysis of titanium dioxide (TiO2) nanoparticles involves their irradiation with UV
light at 387 nm in order to produce hydroxyl radicals for oxidation and superoxide radicals for
reduction of target chemical species. The heterogeneous nature of the photocatalyst also provides
a substrate for physical adsorption that acts as a coagulant.67 With respect to DBP mitigation, the
oxidation pathway allows for decomposition and mineralization of organic precursors, while the
reduction pathway allows for reductive dechlorination of THMs and HAAs, and the adsorption
pathway allows for physical removal of the DBPs and their precursors.67 Photocatalysis can reduce
DBP formation potential, but the energy requirements are likely unfeasible for treatment plant
applications.
Section 10: Decision Tree
With any of the water treatment techniques discussed in Sections 5 through 9 there are
positive and negative outcomes ranging from health risks to high costs. Yet for each technique
there is a set of parameters possible that will optimize the positive while minimizing the negative
effects. Formulating an easy to use and straightforward decision tree would enable WTPs to
identify the best treatment technique which is the ultimate goal of this report.
Decision trees and matrices are not uncommon to environmental engineering; they enable
the visual representation of a complex problem and highlight corresponding logical solutions. The
EPA has published several decision guides to help WTPs meet specific regulations when they are
found noncompliant. Specific decision trees relating to the D/DBPR are available, usually
beginning with either the HAA5 or THM4 concentrations being greater than the MCL and often
ending with the recommendation to switch to chloramine as the secondary disinfectant. Other