A Closer Look:
A Spatial Analysis of African American Mortgage
Applications and Denials in North Carolina
UNIVERSITY OF NORTH CAROLINA AT CHAPEL HILL
Department of City and Regional Planning
Daniel Bullock
ABSTRACT
Table of Contents
Introduction ... 4
Background ... 4
Minority Exclusion from Credit Access ... 5
Assessing and Pricing Risk in Mortgage Lending ... 5
Minority Demand and Efforts to Expand Credit Access ... 6
Homeownership and Lending Differences Between Urban and Rural Areas ... 7
Summary and Research Questions ... 8
Methodology ... 8
Results ... …..11
Data Analysis ... 11
A Closer Look at High Denial Areas in Urban and Rural Contexts ... 22
High Denial Urban Tracts: A Brief Look at Downtown Durham, NC ... 23
High Denial Rural Tracts: A Brief Look at Bertie County, NC ... 28
Contrasting Downtown Durham and Bertie County ... 32
Manufactured Housing: Affordable or Not? ... 33
The Growing Role of Nonbank Lenders ... 36
Discussions and Implications for Planning ... 37
Recommendations for More Effective Lending ... 39
Urban Lending ... 40
Rural Lending ... 40
Areas for Future Research ... 41
Improving HMDA ... 42
Closing Remarks ... 43
References ... 44
Appendix A ... 48
Appendix B ... 51
INTRODUCTION
The homeownership gap between African American and White households has been a major point of focus of those in planning, public policy, community development and related fields for decades. It is a reminder of a horribly unequal past, and has been a particularly stubborn problem despite significant advancement for American minority communities over the last 60 years. Researchers have investigated the effects of legalized institutional barriers, illegal discrimination, current and generational income and wealth disparities, residential locational choice and a number of other factors to explain this gap. This research investigates one of the most crucial aspects of this issue, mortgage lending and credit access. The general recommendation of previous research has been to increase credit access for minorities, and Black Americans in particular.1 Government insurance, subsidy, and counseling have been used to
overcome historic exclusion from homeownership and the wealth building opportunity it represents. However, most studies make few distinctions about what kinds of new lending are needed, or take into account the acute differences in scale of place that are present across the US. It is highly unlikely that the lending needs are the same, for White or Black households, in a city of millions of people and an unincorporated township of a few hundred.
To uncover those differences in North Carolina, this paper takes an in-depth look at loan applications made in the state in 2015. This year-long snap shot provides a fine-grained look at the kinds of home loans North Carolinians need, using loan applications as an approximation of demand. This larger pool includes the loans that are actually being originated by financial institutions, information on what types of borrowers are being granted loans, who is being denied, the types and purposes of these loans, and where they are being made. This research endeavors to determine the kinds of home loans African Americans are seeking, where they are disproportionately likely to be denied home loans, and why. This analysis shows that disparate characteristics within census tracts can say a lot about the types of lending that are missing in different NC geographies, and that could make a difference in household financial outcomes. This research will help give planners and community development lenders a clearer picture of current lending to the Black community and an understanding of how to focus and structure future lending to improve homeownership rates and household financial asset building in communities with very different economic prospects and population densities.
BACKGROUND
To ground this investigation into NC mortgage lending in 2015, it’s important to provide broader context on the history of mortgage lending in the US. First, the history of minority exclusion from access to mortgage credit that has created much of the existing racial and ethnic wealth disparities and residential segregation. Existing research related to assessing and pricing risk in mortgage lending gives insight into the way lenders make decisions about whether to originate or deny a particular loan application, or whether to charge a higher interest rate. Next, findings on African American demand for
1 A note on identifying racial and ethnic groups - For the purposes of this research, the terms Black and African American are
mortgage credit, and the outcomes of previous attempts to expand the credit box to excluded communities provides more immediate understanding of current challenges in boosting
homeownership. Finally, though spatial factors have received less attention, research into the effect of geography on lending and homeownership presents the unique obstacles facing rural communities.
Minority Exclusion from Credit Access
Well established in the literature is the understanding that minorities, and especially African Americans, have been denied full participation in the home mortgage market throughout American history.
Beginning with a period of policy change in the 1930’s, the Federal government identified the goal of increased homeownership, incentivizing ownership over renting and implementing housing and tax policy designed to increase opportunities for households to own their own home.
However, this new mortgage credit was not available to all as African Americans were prevented from obtaining government backed mortgages, effectively removing them from the market and preventing household wealth-building through homeownership.2 The first government-sponsored enterprises were
then established to ensure greater amounts of capital would be available for new home loans, but the racial restrictions already in place remained, and again prevented minorities from accessing this new pool of credit.3
Credit to minorities continued to be constrained well after active legal and institutional barriers to mortgage lending, like redlining and restrictive covenants were removed.4 In the 1990’s government
efforts to increase access to homeownership among lower income populations caused a rise in homeownership, including among minorities, though a large gap persists between White and African American homeownership rates, and has even risen in recent years.5 Federal policy incentivizing
homeownership has changed little and ownership still represents the best way for the average American household to build wealth. However, these benefits are much easier to access for
households of higher income and wealth, to the detriment of many African American households still suffering from this long period of exclusion.6
Assessing and Pricing Risk in Mortgage Lending
As outlined by Quercia and Stegman in 1992, early research into mortgage default investigated the relationships between mortgage characteristics and risk, before expanding to include analysis of borrower characteristics.7 Findings generally supported higher loan-to-value (LTV), the relationship
between the loan amount and the value of the property on which the borrower is receiving a loan, as a greater indicator of risk than borrower income, payment-to-income ratio, or other characteristics specific
2 Gordon, A. (2005). "The Creation of Homeownership: How New Deal Changes in Banking Regulation Simultaneously Made
Homeownership Accessible to Whites and out of Reach for Blacks." The Yale Law Journal 115, no. 1 (2005): 186-226.
3 Carr, J. H., Anacker, K. B. (2014). The past and current politics of housing finance and the future of fannie mae, freddie mac,
and homeownership in the united states. Banking & Financial Services Policy Report, 33(7), 1-10.
4 Duca, J.V., Rosenthal, S.S. (1993). “Borrower Constraints, Household Debt and Racial Discrimination in Loan Markets.” The
Journal of Financial Intermediation v. 3, no.1: 77-103, October.
5 Gabriel, S. Painter, G. (2003) “Pathways to Homeownership: An Analysis of the Residential Location and Homeownership
Choices of Black Households in Los Angeles.” The Journal of Real Estate Finance and Economics, v.27, no.1: 87-109
6 Belsky, E.S., Collins, J.M., & Retsinas, N. P. (1999). Towards a targeted homeownership tax credit. Washington: Brookings
Institution Press.
7 Quercia, R.G., Stegman, M.A. (1992). “Residential Mortgage Default: A Review of the Literature.” Journal of Housing
to the borrower.8 A borrower is therefore more likely to walk away from a mortgage when they have
little equity in the home or owe more on their home loan than the property is worth. Based on this understanding, models were developed to analyze the borrower default decision from the perspective of home equity, allowing for the input of other borrower characteristics and trigger events that create or compound risk in the LTV ratio at the time of default.9
Credit scoring has since emerged as one of the most accurate ways to ascertain likelihood of borrower default. Originating as a way to provide credit to an increasingly mobile population after World War II, credit scores allow lending institutions a way to rate a borrower’s risk without a long-term financial relationship with that borrower. 10 This tool has advantages and disadvantages for minority and
low-income borrowers. A credit score can remove some of the bias in decision making, as the inputs that go into one’s score are entirely based on financial history. However, a good credit history requires
unblemished past relationships with financial institutions and creditors, as well as sufficient, and steady, income to justify taking on debt. Long-held mistrust of these kinds of institutions exists in many minority communities, along with unstable employment histories, lower incomes relative to the general
population and subsequently poorer credit histories for individual households.11
Minority Demand and Efforts to Expand Credit Access
A household’s finances are the obvious limiting factor in the choice to rent or pursue homeownership. Homeownership, contrasted with renting, has been found to be positively correlated with income, wealth, age of head of household, and marital status, all of which are often correlated with financial stability.12 Research that controls for location choice and both purchaser income and wealth, and
parental wealth, has indicated that Black and White households choose homeownership at similar rates.13 This implies a broad preference for homeownership in this country, which is unsurprising given
a number of economic and cultural factors, and demonstrates that the current homeownership gap would be drastically reduced with more equal levels of household wealth and housing availability across geographies and racial and ethnic groups.
In additional to the previously discussed long-term wealth benefits, homeownership has been shown to have other positive social and emotional effects on homeowners and households. 14 These findings
have supported the push for increased homeownership among low-income minority populations. Efforts to increase the homeownership rate among these populations have had mixed success. Well before the recession, research hinted at the potential for damage to low-income minority borrowers from subprime lending patterns.15 However, additional studies illustrated that, despite the high default rates
8 Von Furstenberg, G.M. (1969). "Default Risk on FHA-Insured Home Mortgages as a Function of the Terms of Financing: A
Quantitative Analysis." The Journal of Finance v. 24, no. 3 : 459-77.
9 Foster, C., Vanorder, R. (1984). "An option-based model of mortgage default." Housing Finance Review 3, no. 4: 351-372. 10 Fishelson-Holstein, H. (2006) “Credit scoring’s role in increasing homeownership for underserved populations.” Building
Assets, Building Credit: Creating Wealth in Low-Income Communities, eds. Belsky, Retsinas and Gramlich.
11 Berry, C. (2006) “To bank or not to bank? A survey of low-income households.” Building Assets, Building Credit: Creating
Wealth in Low-Income Communities, eds. Belsky, Retsinas and Gramlich.
12 Sorenson, J.F.L. (2010) “Spatial dimensions of the demand for homeownership. A Danish rural-urban perspective.” Journal
of Housing and the Built Environment, v24. No3: 313-330
13 Hilber, C. & Lui, Y. (2008) “Explaining the black-white homeownership gap: The role of own wealth, parental externalities
and locational preferences.” Journal of Housing Economics v.12, no.2: 152-174
14 Rohe, William M., Basolo, Victoria. (1997). “Long-term effects of homeownership on the self-perceptions and social
interactions of low-income persons.” Environment and Behavior 29: 793-819.
15 Tyuse, Sabrina W., Beirkenmaier, Julie. (2006). “Promoting homeownership for the poor: Proceed with caution.” Race
experienced after the recession, lending can be structured for lower income households in ways that lead to much lower rates of foreclosure.16
Specifically, homeownership counseling programs, a model in which the federal government has invested heavily, have been shown to have some positive impact on prepayment, when a borrower becomes distressed, though the quality of counseling and level of touch make a difference.17 Individual
Development Account (IDA) programs, have shown inconclusive benefit to low-income minority homeowners, though the research is limited.18 Since the recession, new research advocates for
additional support for low-income minority owners to guard against delinquency. This includes longer assistance periods, new development structures that guarantee longer affordability, and more targeted purchase assistance.19
Homeownership and Lending Differences in Urban vs Rural Areas
Research into mortgage finance, housing demand and minority exclusion is primarily focused on urban or metropolitan contexts and much less on rural areas or in comparisons between the two. One subject that has been well covered is the comparative economic suffering of rural areas in recent years
compared to urban, with fewer job prospects and shrinking populations, though with the possible benefit of lower housing costs. As a starting point, one study in 1977 indicated even greater residential segregation patterns along racial lines than those observed in urban areas, as well as lower levels of housing quality, homeownership, and public service provision for minority communities than for Whites.20
In terms of lending, the closing of smaller community banks and bank consolidation has limited lender choice, at least between banks, in many urban and rural areas alike. However, this has had the
greatest impact on rural areas, with community banks, and bank branch closures critically reducing the options for lending in rural communities.21
However, simply being rural does not automatically doom a place to economic stagnation. Rural areas that have more educated populations, more diverse economies, a larger share of non-farming jobs, more creative class contributions, as well as fewer minority residents or recent immigrants fare far better by measures of community prosperity than rural America as a whole.22 For rural places that are
faring poorly in the modern economy, there are indications that homeownership can act as a barrier to
16 Quercia, R.G., Stegman, M.A., Davis, W.R., Stein, E. (2004) “Performance of community reinvestment loans: Implications
for secondary market purchases.” Low-Income Homeownership: Examining the Unexamined Goal, eds. Retsinas and Belsky.
17 Quercia, R. and Spader, J. (2008). “Does homeownership counseling affect the prepayment and default behavior of
affordable mortgage borrowers?.” Journal of Policy Analysis and Management, v. 27: 304–325.
18 Grinstein-Weiss, M., Sherraden, M., Gale, W.G., Rohe, W.M., Schreiner, M., Key, C. (2013). “Long-term impacts of
individual development accounts on homeownership among baseline renters: follow-up evidence from a randomized experiment.” American Economic Journal: Economic Policy v. 5, no. 1: 122-145, February.
19 Jacobus, R., Abromowitz, D. M. (2010). A path to homeownership: Building a more sustainable strategy for expanding
homeownership. Journal of Affordable Housing & Community Development Law, 19(3), 313-328,330-344.
20 Urban Systems Research & Engineering, Inc. (1997) “The Barriers to Equal Opportunity in Rural Housing Markets: Case
Studies and Analysis of Twelve Selected Markets.” Prepared for the Department of Housing and Urban Development, Office of Policy Development and Research.
21 Covington, M. Courtney, J. (2014) “Banking in Rural America, Insight from a Community Development Financial Institution.”
Southern Bancorp.
22 Isserman, A. Feser, E. Warren, D. (2009) “Why Some Rural Places Prosper and Other Do Not.” International Regional
employment mobility and exacerbate periods of unemployment.23 Despite these issues,
homeownership among rural areas is often higher, because of the high preference for ownership and lower cost of housing in rural areas.
Summary and Research Questions
The effects of past exclusion are shown not just in the racial gap in wealth and homeownership, but in the persistence of factors that make closing these gaps difficult, like lower incomes, poorer employment prospects, and less familiarity with financial institutions and managing debt. Consistent across the literature, though possibly biased by the focus of study, is an assumption that, despite the losses of the recession, homeownership still represents the best way to build wealth and financial stability in this country. The remaining gap in homeownership rate between minority and White households then indicates the need for efforts to expand access to high quality, non-predatory, mortgage credit. The wide variation between rural and metropolitan areas means that these credit needs might look significantly different across NC or the US as a whole.
This research will help illustrate the forms that mortgage credit might take by discovering the lending needs of Black North Carolinians that are not currently being met. Specifically, I seek to understand the nature of loan denials of Black households, whether certain lenders are overrepresented among
different racial and ethnic groups, geographies or income groups, and the types and purposes of loans for which Black households are applying in both urban and rural areas. Answering these questions will allow community development lending to directly meet the needs of both urban and rural African American households and more effectively create and maintain homeownership in communities that deserve to be better understood and prioritized by all lending institutions.
METHODOLOGY
This analysis uses a combination of 2015 Home Mortgage Disclosure Act (HMDA), and 2010 - 2015, 5-Year American Community Survey (ACS) data, for North Carolina.24 The HMDA dataset provides the
most comprehensive information about lending activity in this state, including information on every new loan application submitted for residential property in NC, and every mortgage purchased by a financial institution that was originated for NC residential property (institutional purchases). The fields in the dataset that were used for this analysis include the ethnicity, race and sex of the primary applicant, the applicant’s income, the census tract in which the property is located, the lending institution that received the application, the loan type, property type, loan purpose, loan amount, the action taken by the lender, and whether the lender required an interest rate above prime and the amount of that increase. 25
Further details about the information and options recorded in the HMDA dataset are included in Table 1 in Appendix B.
23 Monckuk, D. Kilkenny, M. Phimister, E. (2014) “Rural Homeownership and Labour Mobility in the United States.” Regional
Studies, v.48, no.2: 350-362
24 I would like to thank Sarah Wolfe of the Center for Responsible Lending (CRL) for her guidance and for allowing me access
to CRL’s database of HMDA data. HMDA data can be downloaded from https://www.consumerfinance.gov/data-research/hmda/ but the dataset I received from CRL included the name of each lending institution and parent company matched to the identification numbers used in HMDA which saved me a significant amount of time.
25 Acknowledging the differences between gender and sex and the potentially complicated nature of using these labels, I have
To further the analysis, I chose to pair census data at the tract level to the tracts that contained the property for which borrowers were applying. Tract-level census data include a number of demographic, economic, poverty and housing indicators. The complete list is included in Table 2 in Appendix B.
Methodology
Because the focus of this analysis is loan applications made for NC property in 2015, I first eliminated institutional purchases from my dataset. Next, to focus on African American applications specifically, I removed loans in census tracts that had fewer than 12 applications where the primary applicant was Black. Next, I calculated the denial rate, for African American applications only, for each census tract. I grouped these tracts into four categories; tracts with an African American denial rate below 20%, those between 20-30%, between 30-40%, and those tracts with a denial rate above 40%. The resulting map of NC census tracts is shown in Figure 1 below.
Figure 1: Census Tracts in NC with 12 or More African American Loan Applications by the Tract’s Overall Denial Rate for African American Applicants
Data Source: 2015 HMDA, map created by author in ESRI ArcGIS
This analysis indicated most of the high denial tracts (colored red in Figure 1)were either in very rural areas, or in clusters near the larger city centers in NC. To account for the difference in proximity to larger metro areas, I divided these tracts into urban or rural categories, creating a buffer around each city. This buffer was intended to capture suburban development in the urban category, as suburban areas have access to lending institutions at rates more comparable to urban dwellers than those in rural areas.26 The exact boundaries of the urban-rural split are shown in Figure 2, with only the urban tracts
displayed. Table 3 in Appendix B indicates the distribution of tracts within these new categories. Figure 2 in Appendix B, shows this urban boundary in relation to population density of NC census tracts, where the highest population densities are well within the identified urban boundaries.
Figure 2: Map of Urban Census Tracts in NC with 12 or More African American Loan Applications by the Tract’s Overall Denial Rate for African Americans
Data Source: 2015 HMDA, map created by author in ESRI ArcGIS
Categorizing Lenders
1,048 different lenders received at least 1 loan application for residential property in NC in 2015. Most of them received a small number of applications, and only 11 lenders received more than 10,000, and accounted for 45% of all applications. To concentrate on the major lenders I decided to only individually focus on these lenders and group lenders with fewer applications into the following categories; lenders
26 Avery, R., Bostic, R., Calem, P., Canner, G. (1997) “Changes in the Distribution of Banking Offices.” Federal Reserve
that received between 10,000 and 5,000 applications, those that received between 5,000 and 1,000 applications, between 1,000 and 500 applications, between 500 and 100 applications, and those lender’s that received less than 100 applications. A more in-depth description of the major lending institutions and lending categories is included in Table 4 in Appendix B.
For the sake of brevity, I have chosen to include this simplified version of my methods here. A complete explanation of my methods is included in Appendix A.
RESULTS
The results given in this section do not represent an exhaustive list of the analysis completed but summarize the main takeaways before moving on to deeper discussion of findings. Many of the census data and HMDA variables were also mapped by census tract and will be included where relevant when analyzing and discussing results in greater detail.
Data Analysis
There are a number of correlations within the data that were expect based on previous research into denial rates and loan risk. For tract-level census data, the denial rate of African Americans by tract is negatively correlated with tract income, owner-occupied home values, and rents, and positively correlated with poverty rates for all age groups, unemployment, number of vacant units, and the percentage of renters compared to homeowners.
While suburban development was intended to be captured in the urban tracts category, based on the data and mapping of census tracts, a number of tracts that represent the outer edges of suburban development around many NC cities have ended up in the rural category. This accounts for some of the tract characteristics observed in that category, and is supported by maps of the urban – rural split, where the rural map (Figure 2, Appendix B) includes a number of low denial tracts on the edges of urban areas, especially Charlotte and the Triangle region in central NC (Durham and Raleigh in Figure 1).
Race, Ethnicity and Sex
There is an obvious relationship between increasing tract denial rate and the percentage of the tract population that is Black. The percentage of the tract population that is White is inversely correlated with the Black population, and subsequently with Black denial rate. The effect of the tract denial rate for African Americans is much less pronounced on Whites and Hispanics in those tracts. In general, denial rates for all groups are slightly higher in rural tracts than in corresponding denial categories of urban tracts.
loan applications per capita than other groups and Black households made more than Hispanic households.
White and Hispanic women make up between 25% and 35% of their respective primary loan applicants, while Black women make up between 39% and 47% of Black primary loan applicants. Black women are also more likely to be the primary loan applicant in urban areas, and the percentage of Black female applicants increases with higher denial rate.
Table 1: Demographic Makeup, and Loan Applications and Denial Rate by Race, Ethnicity and Sex
Tracts with 12 or More Black Loan Applications Denial Rate Category (By Percent Denial Rate
for African Americans)
20% and under
21-30%
31 -
40% 41%+
20% and under
21-30%
31 -
40% 41%+
Denial Category Code from Figure 1 & Figure 2
Rural - Urban Split Rural Urban
Average Percent of tract population that is Black Alone 15.5% 20.6% 30.7% 34.4% 21.0% 27.2% 38.4% 43.2% Average Percent of tract population that is White Alone 68.8% 66.3% 56.0% 53.3% 62.6% 55.5% 44.1% 38.8% Average Percent of tract population that is Hispanic (all
races) 9.2% 8.6% 8.1% 8.0% 9.0% 10.6% 11.9% 12.7%
Percent of All Loan Applicants that are Black 9.0% 13.5% 17.1% 19.8% 16.1% 18.5% 25.4% 23.4% Percent of All Loan Applicants that are White 65.4% 66.1% 62.2% 58.5% 60.3% 57.6% 51.3% 53.1% Percent of All Loan Applicants that are Hispanic (all races) 4.5% 4.6% 3.5% 3.3% 5.1% 5.7% 6.6% 5.9% Average Denial Rate for Black Applicants 15.6% 25.8% 35.7% 50.0% 16.3% 25.5% 34.3% 48.0% Average Denial Rate for White Applicants 14.8% 17.3% 19.4% 24.0% 13.1% 13.8% 16.1% 18.9% Average Denial Rate for Hispanic Applicants 18.2% 24.5% 29.7% 32.1% 20.1% 21.6% 24.8% 28.1% Black Application Rate (Black Loan Applications Divided by
the Tract Population that is Black Alone) 3.3% 2.8% 1.7% 1.5% 4.1% 3.4% 2.5% 1.4% White Application Rate 5.4% 4.3% 3.5% 2.8% 5.2% 5.2% 4.5% 3.6% Hispanic Application Rate 2.8% 2.3% 1.3% 1.1% 3.1% 2.7% 2.1% 1.2% Percentage of Black Primary Applicants that are Female 38.7% 40.2% 43.4% 45.6% 44.5% 44.7% 46.7% 46.5% Percent of White Primary Applicants that are Female 25.9% 28.2% 28.1% 29.2% 30.7% 30.2% 31.2% 34.0% Percent of Hispanic Primary Applicants that are Female 24.8% 31.3% 31.1% 29.9% 30.9% 29.5% 30.0% 32.9% Denial Rate for Black Female Applicants 15.8% 26.7% 38.1% 53.1% 16.6% 26.2% 35.2% 48.4% Denial Rate for White Female Applicants 16.9% 20.4% 22.9% 27.3% 14.9% 15.5% 18.3% 20.6% Denial Rate for Hispanic Female Applicants 22.9% 26.1% 37.1% 35.8% 20.5% 22.7% 27.6% 30.2%
Data Source: 2015 HMDA
The Lenders – Loan Share and Denial Rates
The largest overall lending category is those lenders who received between 5,000 and 1,000 applications, making up between 25% and 33% of loans in each denial category. There is greater variation in lender’s share of loans in rural census tracts than in urban tracts. In urban tracts, the major lenders received roughly their expected share of loan applications, with the exception of JP Morgan Chase, which is underrepresented in the tracts included in my analysis overall, and Vanderbilt
Mortgage which specializes in financing manufactured housing and is subsequently overrepresented in rural tracts.
Table 2: Percentage of Total Loan Applications
Tracts with 12 or More Black Loan Applications Denial Rate Category (By Percent Denial Rate
for African Americans)
20% and under
21-30%
31 -
40% 41%+
20% and under
21-30%
31 -
40% 41%+
Rural - Urban Split Rural Urban
Wells Fargo 7.1% 6.5% 6.7% 6.2% 8.6% 8.6% 8.6% 8.8%
State Employees Credit Union 5.7% 7.9% 9.3% 10.7% 5.6% 5.7% 6.7% 7.0%
BB&T 5.1% 5.7% 7.2% 8.9% 3.7% 4.0% 5.1% 5.9%
Quicken Loans 4.0% 4.5% 4.6% 4.6% 4.6% 5.0% 5.2% 4.6%
Suntrust 2.6% 3.1% 2.9% 3.3% 2.8% 3.0% 3.3% 4.0%
LoanDepot.com 3.0% 3.5% 3.5% 3.0% 3.5% 3.5% 4.0% 3.3%
Movement Mortgage 2.9% 3.4% 1.6% 0.9% 4.3% 3.8% 3.1% 2.6% Bank of America 2.5% 2.0% 1.3% 1.1% 3.3% 3.5% 3.0% 2.5% JP Morgan Chase 0.9% 0.7% 0.6% 0.5% 0.9% 1.0% 0.8% 0.7% Vanderbilt Mortgage 1.6% 3.9% 7.0% 11.6% 0.7% 1.0% 1.4% 3.7% Freedom Mortgage 2.5% 2.8% 2.3% 1.7% 2.7% 2.9% 3.2% 2.0% Lenders with Between 10,000 - 5,000 Applications 8.8% 8.2% 9.3% 7.5% 8.2% 8.7% 9.4% 8.6% Lenders with Between 5,000 - 1,000 Applications 33.2% 29.1% 26.3% 24.6% 30.7% 30.0% 27.6% 26.4% Lenders with Between 1,000 - 500 Applications 10.7% 8.8% 7.6% 7.5% 10.6% 9.8% 9.1% 9.0% Lenders with Between 500 - 100 Applications 7.0% 7.6% 7.1% 5.7% 7.5% 7.3% 7.3% 8.1% Lenders with Under 100 Applications 2.3% 2.2% 2.8% 2.1% 2.3% 2.3% 2.4% 2.6%
Data Source: 2015 HMDA
The percentage of each lender’s total loan applications where the primary loan applicant was Black served to give a sense of how lenders are serving the African American population of NC. In general, the percentage of black loan applications increased with denial rate for each lender, and was higher for most lenders in urban areas than rural. The highest individual percentages were between 39% and 48%, including Vanderbilt loans in higher denial rate rural tracts, and Freedom Mortgage and
LoanDepot.com in higher denial rate urban tracts. The lowest percentages of Black applicants were for BB&T and Bank of America in the lowest denial rate category for rural tracts, at 7%.
Table 3: Percentage of Each Lender’s Total Loan Applications that were made by African Americans
Tracts with 12 or More Black Loan Applications Denial Rate Category (By Percent Denial Rate
for African Americans)
20% and under
21-30%
31 -
40% 41%+
20% and under
21-30%
31 -
40% 41%+
Rural - Urban Split Rural Urban
Wells Fargo 10% 16% 19% 30% 16% 19% 30% 31%
State Employees Credit Union 22% 24% 27% 30% 23% 33% 40% 35%
BB&T 7% 11% 14% 16% 11% 15% 20% 24%
Quicken Loans 11% 14% 16% 20% 15% 21% 30% 30%
Suntrust 9% 14% 15% 21% 14% 21% 31% 36%
LoanDepot.com 8% 18% 26% 30% 25% 32% 44% 41%
Movement Mortgage 9% 12% 8% 8% 21% 19% 24% 11%
Bank of America 7% 14% 17% 16% 18% 16% 26% 24%
JP Morgan Chase 13% 15% 13% 12% 13% 16% 27% 16%
Vanderbilt Mortgage 26% 27% 48% 39% 25% 36% 38% 35%
Freedom Mortgage 13% 23% 24% 25% 33% 36% 41% 37%
Lenders with Between 10,000 - 5,000 Applications 9% 18% 22% 30% 21% 25% 32% 33% Lender with Between 5,000 - 1,000 Applications 9% 12% 15% 18% 16% 18% 25% 22% Lenders with Between 1,000 - 500 Applications 10% 16% 20% 23% 18% 21% 27% 25% Lenders with Between 500 - 100 Applications 10% 15% 16% 16% 18% 18% 24% 20%
Lenders with Under 100 8% 12% 18% 20% 17% 18% 28% 29%
Data Source: 2015 HMDA
Lenders - Denial Rates by Lender
rates between 2% at the low end and 8% at the highest. On the other end of the scale, LoanDepot.com has the highest denial rates, between 50% and 70%. Suntrust has the second highest denial rates, between 30% and 55%. There is also a wide range in the difference between the lowest and highest denial rate categories, ranging from less than 1% for Freedom Mortgage loans in urban tracts, to a 24% difference for Suntrust loans in both rural and urban tracts.
Table 4: Lender Denial Rate for All Loan Applications
Tracts with 12 or More Black Loan Applications Denial Rate Category (By Percent Denial
Rate for African Americans)
20% and under
21-30%
31 -
40% 41%+
20% and under
21-30%
31 -
40% 41%+
Rural - Urban Split Rural Urban
Wells Fargo 23.4% 26.1% 30.8% 44.2% 18.1% 22.8% 31.2% 39.8% State Employees Credit Union 18.7% 24.3% 30.3% 43.7% 14.7% 20.1% 28.4% 35.8% BB&T 19.2% 22.3% 25.2% 30.6% 17.5% 21.1% 24.5% 30.5% Quicken Loans 19.3% 26.8% 28.8% 36.0% 22.8% 24.2% 31.5% 39.3% Suntrust 28.8% 36.6% 45.3% 53.3% 30.7% 33.9% 41.8% 55.0% LoanDepot.com 58.7% 62.1% 67.4% 71.2% 49.8% 56.3% 63.0% 66.2% Movement Mortgage 4.4% 4.5% 5.6% 6.2% 4.7% 4.9% 6.9% 8.2% Bank of America 12.8% 17.9% 23.6% 20.0% 13.1% 16.6% 19.5% 24.0% JP Morgan Chase 19.0% 20.6% 31.0% 28.4% 17.5% 20.1% 25.8% 23.4% Vanderbilt Mortgage 24.9% 34.9% 32.6% 34.3% 31.8% 37.2% 39.1% 35.2% Freedom Mortgage 2.0% 1.9% 3.3% 4.2% 2.3% 2.2% 3.1% 2.5% Lenders with Between 10,000 - 5,000 Applications 21.8% 27.8% 34.0% 43.7% 22.3% 24.7% 30.1% 34.4% Lender with Between 5,000 - 1,000 Applications 11.7% 11.7% 15.7% 14.3% 20.5% 19.5% 29.9% 24.7% Lenders with Between 1,000 - 500 Applications 9.9% 13.7% 17.9% 25.6% 10.6% 12.7% 15.3% 20.5% Lenders with Between 500 - 100 Applications 10.0% 12.1% 13.8% 15.6% 10.2% 11.5% 11.8% 16.1% Lenders with Under 100 13.4% 15.9% 15.3% 19.8% 10.6% 11.5% 16.2% 21.0%
Data Source: 2015 HMDA
In comparison to each lender’s overall denial rate, their denial rates for African Americans are higher across the board, and lower for Whites. Hispanic denial rates vary more widely by lender, but are also general higher than those for White applicants. Most lenders, however, don’t show dramatic change from their overall denial rate in denial rates by race and ethnicity. Movement Mortgage and Freedom Mortgage still have the lowest denial rates, and LoanDepot.com, followed by Suntrust, still has the highest.
Table 5: Denial Rate for African American Loan Applications
Tracts with 12 or More Black Loan Applications Denial Rate Category (By Percent Denial
Rate for African Americans)
20% and under
21-30%
31 -
40% 41%+
20% and under
21-30%
31 -
40% 41%+
Rural - Urban Split Rural Urban
Wells Fargo 31% 35% 51% 65% 20% 34% 45% 63%
State Employees Credit Union 8% 16% 23% 38% 10% 15% 22% 35%
BB&T 18% 39% 33% 52% 23% 30% 44% 51%
Quicken Loans 26% 35% 38% 50% 24% 35% 42% 57%
Suntrust 36% 46% 64% 72% 35% 52% 62% 80%
LoanDepot.com 63% 68% 74% 78% 46% 65% 73% 75%
Movement Mortgage 5% 8% 20% 8% 7% 5% 12% 17%
Bank of America 9% 25% 28% 28% 11% 21% 23% 30%
JP Morgan Chase 36% 22% 29% 22% 22% 26% 43% 43%
Vanderbilt Mortgage 16% 30% 30% 43% 27% 46% 49% 46%
Freedom Mortgage 5% 1% 8% 8% 2% 3% 4% 4%
Lenders with Between 10,000 - 5,000 Applications 25% 32% 49% 61% 24% 35% 43% 51% Lender with Between 5,000 - 1,000 Applications 12% 23% 37% 54% 14% 23% 31% 48% Lenders with Between 1,000 - 500 Applications 11% 21% 27% 48% 12% 17% 23% 34% Lenders with Between 500 - 100 Applications 7% 14% 22% 28% 13% 14% 20% 36%
Lenders with Under 100 14% 31% 27% 37% 9% 17% 22% 34%
Data Source: 2015 HMDA
*For comparison, denial rates for White and Hispanic applicants are included in Table 5 and Table 6 in Appendix B
The Lenders - The Use of Rate Spreads
In the HMDA dataset the rate spread field is an indication of a higher cost loan and represents the difference in interest rate when the rate recorded for an originated loan is at least 1.5% higher than the prime rate that would be given to a low-credit risk borrower. Most lenders in my analysis used rate spreads sparingly. Freedom Mortgage used no rate spreads for any of their originated loans, and a number of lenders used spreads for under 5% of their loans outside of the highest denial rate category. For grouped lenders who received less than 1000 applications, they consistently used rate spreads between 12% and 15% in the highest denial rate category, increasing their use of spreads in
conjunction with denial rate from around 2-7% in the lowest denial rate category. The major outlier is Vanderbilt Mortgage which uses rate spreads on almost all of the loans it originates, between 90% and 100%.
Table 6: The Percentage of Originated Loans that had Rates at Least 1.5% over the Prime Rate
Tracts with 12 or More Black Loan Applications Denial Rate Category (By Percent Denial Rate
for African Americans)
20% and under
21-30%
31 -
40% 41%+
20% and under
21-30%
31 -
40% 41%+
Rural - Urban Split Rural Urban
Wells Fargo 3% 6% 6% 10% 2% 4% 6% 7%
State Employees Credit Union 7% 6% 10% 9% 4% 4% 7% 7%
BB&T 0% 1% 1% 2% 1% 1% 2% 1%
Quicken Loans 0% 0% 0% 1% 0% 0% 1% 1%
Suntrust 0% 0% 0% 1% 0% 0% 0% 2%
LoanDepot.com 3% 5% 2% 7% 14% 7% 9% 13%
Movement Mortgage 4% 10% 8% 15% 10% 12% 16% 14%
Bank of America 0% 2% 2% 3% 1% 1% 3% 2%
JP Morgan Chase 1% 2% 2% 0% 3% 1% 2% 4%
Vanderbilt Mortgage 98% 93% 97% 97% 93% 98% 90% 100%
Freedom Mortgage 0% 0% 0% 0% 0% 0% 0% 0%
Lenders with Between 10,000 - 5,000 Applications 2% 4% 4% 3% 6% 6% 6% 8% Lender with Between 5,000 - 1,000 Applications 2% 5% 7% 10% 3% 4% 5% 6% Lenders with Between 1,000 - 500 Applications 3% 7% 10% 13% 5% 8% 12% 15% Lenders with Between 500 - 100 Applications 7% 6% 10% 13% 7% 8% 11% 12%
Lenders with Under 100 7% 7% 11% 18% 5% 6% 10% 15%
Loan Type
The majority of applications in this analysis are for conventional mortgages, without any kind of
government backing or support. Depending on the area of the state, the second most common is FHA loans (insured by the Federal Housing Administration) or VA loans (available to the households of US veterans and service members and guaranteed by the Veteran’s Administration). VA loans are
clustered primarily in the eastern part of the state, around the handful of large military installations. The final category is the combined housing loan programs of the Farm Service Agency and the Rural Housing Service, both of which are intended to support rural residents and have a larger share in rural tracts. FHA loans are a slightly large share of urban tract applications, while VA loans are a larger share of rural tracts (Figure 3 and Figure 4, Appendix B).
Comparing rates of Black applications for different loan types to the percentage of each category that is Black, it’s clear that African Americans make up a much greater percentage of government backed loans, especially FHA loans, compared to conventional loans. That share increases with denial rate in both rural and urban areas, with the exception of the highest denial rate category. The outcome in this category may be caused by lower incomes, greater poverty, and subsequently poorer credit histories in these tracts, which would prevent a greater number of households from being eligible for government backed loans, due to strict underwriting guidelines.27
Denial rates among loan types follow overall trends by denial category, with FSA and RHS loans having the lowest denial rates, followed by VA loans. African Americans make up a larger share of government backed loans in lower denial rate categories. African Americans for the most part, experience equal or lower denial rates than the overall denial rate for each loan type in lower denial rate categories, but much higher denial rates comparatively, in higher denial rate categories.28
Table 7: Share and Denial Rate for Different Loan Types
Tracts with 12 or More Black Loan Applications Denial Rate Category (By Percent Denial
Rate for African Americans)
20% and under
21-30%
31 -
40% 41%+
20% and under
21-30%
31 -
40% 41%+
Rural - Urban Split Rural Urban
% Conventional 66.8% 62.3% 65.5% 69.6% 66.7% 66.3% 63.4% 71.4%
% FHA 11.7% 15.4% 14.6% 15.6% 16.7% 17.6% 19.6% 17.4%
% VA 18.0% 18.0% 16.5% 11.2% 15.0% 14.6% 15.7% 10.1%
% FSA & RHS 3.5% 4.4% 3.4% 3.6% 1.6% 1.5% 1.3% 1.2% Conventional Denial Rate 16.3% 21.8% 26.7% 34.1% 15.1% 18.3% 24.3% 28.6% Denial Rate FHA 18.5% 22.3% 27.6% 32.8% 16.8% 19.4% 23.0% 29.7% Denial Rate VA 11.0% 12.8% 15.8% 20.1% 12.3% 13.7% 17.9% 25.1% Denial Rate FSA & RHS 10.0% 12.0% 11.9% 17.9% 11.8% 9.3% 10.1% 13.0% % Conv. Loans to Blacks 6.8% 11.4% 16.4% 19.2% 11.1% 14.1% 21.3% 21.2% % FHA loans to Blacks 13.8% 18.0% 21.7% 24.1% 26.5% 28.7% 34.4% 30.2% % VA loans to Blacks 12.8% 16.8% 16.5% 19.5% 25.9% 26.1% 31.8% 28.5% % FSA & RHS Loans to Blacks 15.1% 14.3% 13.0% 13.1% 20.6% 17.8% 13.2% 11.2% Conv. Loan Black Denial Rate 19.3% 29.9% 39.6% 53.5% 19.0% 30.7% 40.5% 52.6% FHA denial rate to Blacks 13.8% 25.0% 35.5% 48.0% 15.0% 21.4% 28.3% 40.2% Black denial rate for VA loans 11.4% 18.4% 24.2% 38.4% 12.6% 18.9% 26.3% 38.8% Black FSA &RHS denial rate 8.1% 17.6% 13.4% 24.1% 14.5% 13.5% 20.0% 27.8%
Data Source: 2015 HMDA
27 Federal Housing Commissioner, Office of the Assistant Secretary for Housing. (2013) “Federal Housing Administration Risk
Management Initiatives: New Manual Underwriting Requirements.” Department of Housing and Urban Development, Federal Register Vol. 78, No. 238. Wednesday, December 11, 2013.
28 According tothe 2015 American Community Survey (ACS), African Americans make up 22% of NC population, and are
Property Type
The overwhelming majority of loan applications in NC in 2015 were in the HMDA reporting category of 1-4 unit family dwelling which includes detached, single-family homes, as well as multi-unit housing like duplexes, in structures with up to four units that share walls. In urban areas, this category makes up between 95% and 99% of loan applications. In rural areas this makes up between 95% and 80% of applications, with manufactured housing making most of the rest.
As denial rate increases in rural tracts the percentage of loans for manufactured housing increases dramatically, and is likely correlated with the increasing distance from urban centers. Denial rates for manufactured housing loans are higher than those for 1-4 unit family dwellings, and applicant incomes are much lower.
Table 8: Share of Loan Applications, Denial Rates and Applicant Incomes by Housing Type
Tracts with 12 or More Black Loan Applications
Denial Rate Category (By Percent Denial Rate for African Americans)
20% and
under 21-30% 31 - 40% 41%+
20% and
under 21-30%
31 -
40% 41%+
Rural - Urban Split Rural Urban
Percent 1-4 Family Loans 95.2% 92.1% 87.6% 80.6% 98.7% 98.5% 97.7% 95.3% Percent Manufactured Loans 4.8% 7.9% 12.4% 19.3% 1.2% 1.5% 2.2% 4.6% Total Denial Rate for 1-4 Fam. Loans 14.0% 17.9% 22.0% 28.5% 13.9% 16.7% 22.0% 27.2% Total Denial Rate for Manufactured. Loans 26.8% 31.9% 33.7% 40.9% 37.9% 40.7% 41.2% 41.0% Black percent of all 1-4 Fam. Loan applications 9.9% 14.9% 17.7% 21.1% 18.2% 20.9% 28.8% 26.7% Black percent of all Manufactured Loan
applications 15.7% 20.3% 33.8% 32.9% 15.8% 26.7% 29.5% 33.3% Black denial rate for 1-4 fam loans 15.3% 25.0% 35.2% 48.5% 16.1% 25.0% 34.0% 47.6% Black denial rate for Manufactured loans 20.4% 32.2% 37.8% 54.2% 35.5% 50.4% 46.8% 54.7% Average Income of 1-4 Fam. Applicants $97,000 $83,000 $79,500 $69,600 $95,000 $89,600 $77,800 $79,400 Average Income of Manufactured Applicants $49,500 $46,300 $48,000 $45,700 $46,900 $41,800 $44,100 $43,300 Average income of Black 1-4 Fam. Applicants $81,300 $69,200 $59,300 $53,000 $78,100 $71,100 $63,300 $55,000 Average income of Black Manufactured
Applicants $43,900 $40,900 $44,200 $41,500 $43,500 $36,700 $44,000 $41,000
Data Source: 2015 HMDA
*There were too few loans on the Multi-family type of housing to allow for analysis
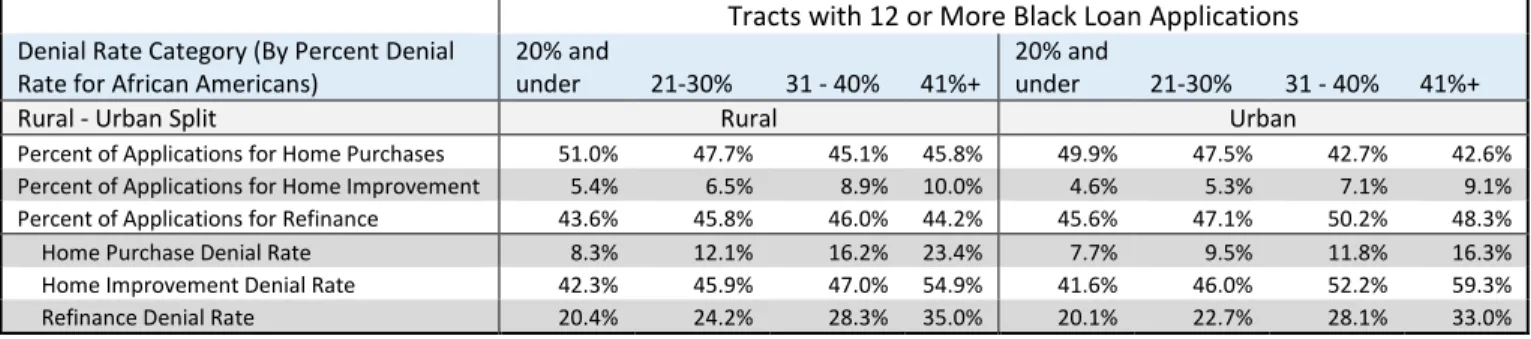
Loan Purpose
Across NC, loan applications for new home purchases account for about 50-42% of all applications, while refinancing accounts for 50-43%, with home improvement loans accounting for the remaining 5-10%. Denial rates for all three purposes increase with denial rate category, though are lowest for new home purchases, followed by refinance, and highest for home improvement.
Table 9: Share of Total Loans and Denial Rates by Loan Purpose
Tracts with 12 or More Black Loan Applications
Denial Rate Category (By Percent Denial Rate for African Americans)
20% and
under 21-30% 31 - 40% 41%+
20% and
under 21-30% 31 - 40% 41%+
Rural - Urban Split Rural Urban
Percent of Applications for Home Purchases 51.0% 47.7% 45.1% 45.8% 49.9% 47.5% 42.7% 42.6% Percent of Applications for Home Improvement 5.4% 6.5% 8.9% 10.0% 4.6% 5.3% 7.1% 9.1% Percent of Applications for Refinance 43.6% 45.8% 46.0% 44.2% 45.6% 47.1% 50.2% 48.3% Home Purchase Denial Rate 8.3% 12.1% 16.2% 23.4% 7.7% 9.5% 11.8% 16.3% Home Improvement Denial Rate 42.3% 45.9% 47.0% 54.9% 41.6% 46.0% 52.2% 59.3% Refinance Denial Rate 20.4% 24.2% 28.3% 35.0% 20.1% 22.7% 28.1% 33.0%
Data Source: 2015 HMDA
There is some variation by racial and ethnic group, though Black applicants tend to make up a greater percentage of each loan purpose as denial rate increases. This is also largely correlated with higher Black populations. The exception is in the highest denial urban category, indicating that in these tracts loan applications, particularly for new home purchases, have larger than expected shares of White and Hispanic applicants. There are two possible trends at work here. Because the highest denial tracts often have the lowest incomes and highest poverty they represent both the opportunity for lower-income Hispanics to purchase homes and for White investors seeking property in formerly poor
neighborhoods near revitalizing downtown centers. This second pattern is observed in detail through a deeper look at downtown Durham, NC, beginning on page 22.
Table 10: Loan Purpose by Racial and Ethnic Group
Tracts with 12 or More Black Loan Applications
Denial Rate Category (By Percent Denial Rate for African Americans)
20% and under
21-30%
31 -
40% 41%+
20% and under
21-31%
31 -
40% 41%+
Rural - Urban Split Rural Urban
Applicants for Home Purchases that are Black 9.1% 13.1% 16.5% 19.3% 17.2% 17.5% 21.1% 16.6% Applicants for Home Improvements that are Black 9.9% 18.5% 27.2% 31.5% 18.5% 27.1% 37.2% 43.4% Applications for Refinancing that are Black 11.4% 17.1% 21.2% 25.3% 19.2% 24.0% 34.3% 33.1% Applicants for Home Purchases that are White 72.1% 75.8% 74.3% 71.8% 67.4% 67.2% 63.7% 68.3% Applicants for Home Improvements that are White 78.8% 73.4% 64.6% 61.6% 69.5% 61.5% 52.3% 47.5% Applicants for Refinancing that are White 75.0% 74.1% 70.4% 68.3% 68.6% 64.1% 54.6% 58.0% Applicants for Home Purchases that are Hispanic 5.3% 6.3% 5.1% 5.4% 6.3% 7.4% 9.4% 9.7% Applicants for Home Improvement Loans that are Hispanic 7.0% 5.3% 4.4% 3.2% 6.9% 6.4% 6.7% 5.0% Applicants for Refinancing that are Hispanic 4.6% 4.1% 2.9% 2.7% 4.9% 5.5% 6.0% 4.6%
Data Source: 2015 HMDA
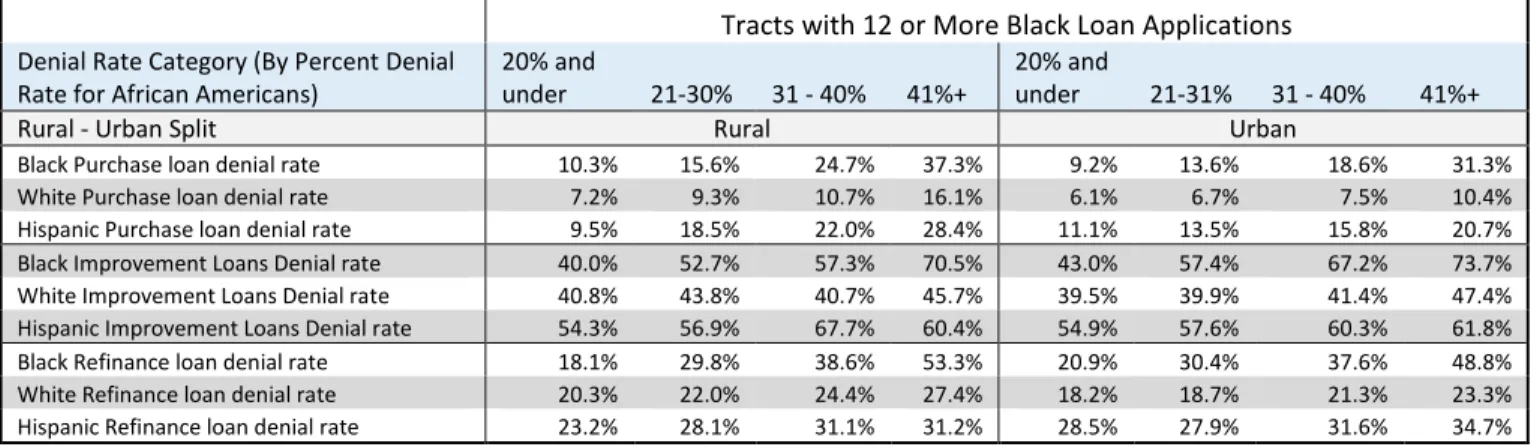
Table 11: Denial Rates for Loan Purpose Categories by Race and Ethnicity
Tracts with 12 or More Black Loan Applications
Denial Rate Category (By Percent Denial Rate for African Americans)
20% and
under 21-30% 31 - 40% 41%+
20% and
under 21-31% 31 - 40% 41%+
Rural - Urban Split Rural Urban
Black Purchase loan denial rate 10.3% 15.6% 24.7% 37.3% 9.2% 13.6% 18.6% 31.3% White Purchase loan denial rate 7.2% 9.3% 10.7% 16.1% 6.1% 6.7% 7.5% 10.4% Hispanic Purchase loan denial rate 9.5% 18.5% 22.0% 28.4% 11.1% 13.5% 15.8% 20.7% Black Improvement Loans Denial rate 40.0% 52.7% 57.3% 70.5% 43.0% 57.4% 67.2% 73.7% White Improvement Loans Denial rate 40.8% 43.8% 40.7% 45.7% 39.5% 39.9% 41.4% 47.4% Hispanic Improvement Loans Denial rate 54.3% 56.9% 67.7% 60.4% 54.9% 57.6% 60.3% 61.8% Black Refinance loan denial rate 18.1% 29.8% 38.6% 53.3% 20.9% 30.4% 37.6% 48.8% White Refinance loan denial rate 20.3% 22.0% 24.4% 27.4% 18.2% 18.7% 21.3% 23.3% Hispanic Refinance loan denial rate 23.2% 28.1% 31.1% 31.2% 28.5% 27.9% 31.6% 34.7%
Data Source: 2015 HMDA
When the purpose of loan applications is broken down by lender and lending category it becomes clear that many lenders specialize or have a preference for one over the others. For new home purchases Vanderbilt is most heavily overrepresented, with a greater share of rural than urban, particularly in the highest denial category. Movement Mortgage and lenders that received between 5,000 and 1,000 applications in NC are also overrepresented. SECU is overrepresented, but only in rural areas and higher denial urban categories.
Table 12: Percent of New Home Purchase Loan Applications by Denial Category Received By Each Lender and Lending Category
Tracts with 12 or More Black Loan Applications
Denial Rate Category (By Percent Denial Rate for African Americans)
20% and
under 21-30% 31 - 40% 41%+
20% and
under 21-31% 31 - 40% 41%+
Rural - Urban Split Rural Urban
Wells Fargo 5.57% 5.12% 5.15% 4.07% 7.15% 7.16% 6.58% 6.28%
SECU 6.33% 9.13% 10.73% 12.54% 6.45% 6.68% 8.19% 8.82%
BB&T 5.17% 6.10% 7.23% 8.45% 3.60% 4.16% 5.44% 6.35% Quicken Loans 1.64% 1.83% 1.60% 2.02% 1.78% 2.07% 2.22% 1.86% Suntrust 1.62% 1.51% 0.76% 0.80% 1.61% 1.79% 1.48% 1.60% Loandepot.com 0.28% 0.24% 0.18% 0.09% 1.18% 0.51% 0.45% 0.33% Movement Mortgage LLC 5.07% 6.40% 3.32% 1.80% 7.94% 7.25% 6.59% 5.53% Bank of America 1.83% 1.39% 0.89% 0.71% 2.98% 3.15% 2.70% 2.28% JP Morgan Chase 0.60% 0.42% 0.23% 0.20% 0.57% 0.52% 0.35% 0.35% Vanderbilt Mortgage 3.21% 8.14% 15.53% 25.45% 1.31% 2.01% 3.20% 8.75% Freedom Mortgage 0.36% 0.15% 0.13% 0.09% 0.27% 0.23% 0.17% 0.24% Lenders between 10K and 5K mortgages 6.56% 5.29% 5.15% 3.19% 6.30% 6.25% 6.40% 5.93% Lenders between 1k and 5K mortgages 39.60% 34.03% 31.22% 26.74% 36.37% 36.51% 34.15% 30.03% Lenders between 500 and 1000 mortgages 12.35% 9.51% 6.59% 5.45% 11.74% 11.04% 10.46% 9.97% Lenders between 500 and 100 mortgages 7.71% 8.85% 8.92% 6.78% 8.68% 8.57% 9.01% 9.43% Lenders under 100 mortgages 2.10% 1.89% 2.36% 1.60% 2.08% 2.12% 2.61% 2.26%
Data Source: 2015 HMDA
Table 13: Percent of Home Improvement Loan Applications by Denial Category Received by Each Lender and Lending Category
Tracts with 12 or More Black Loan Applications
Denial Rate Category (By Percent Denial Rate for African Americans)
20% and
under 21-30% 31 - 40% 41%+
20% and
under 21-31% 31 - 40% 41%+
Rural - Urban Split Rural Urban
Wells Fargo 20.2% 17.2% 16.8% 19.9% 21.2% 22.1% 22.7% 26.1%
SECU 3.8% 6.5% 5.8% 7.2% 3.9% 3.5% 4.5% 5.1%
BB&T 15.4% 13.5% 17.7% 20.5% 12.7% 12.8% 14.4% 13.7% Quicken Loans *no reported applications for home improvement loans
Suntrust 17.3% 20.0% 17.4% 18.7% 20.7% 21.9% 20.4% 24.8%
Loandepot.com 0.1%
Movement Mortgage LLC 0.2% 0.1% 0.1% 0.0%
Bank of America 1.2% 1.2% 0.7% 0.3% 1.9% 1.8% 1.1% 1.4%
JP Morgan Chase 0.3% 0.1% 0.1% 0.2% 0.1% 0.2%
Vanderbilt Mortgage *no reported applications for home improvement loans
Freedom Mortgage 0.1% 0.1% 0.1% 0.0% 0.0%
Lenders between 10K and 5K mortgages 17.0% 17.1% 18.7% 13.0% 13.6% 13.1% 13.1% 8.0% Lenders between 1k and 5K mortgages 8.7% 9.7% 8.3% 8.0% 9.0% 9.8% 10.1% 9.7% Lenders between 500 and 1000 mortgages 2.9% 1.8% 2.4% 2.5% 3.2% 2.8% 2.8% 2.8% Lenders between 500 and 100 mortgages 9.2% 9.8% 6.3% 6.1% 9.7% 8.6% 7.5% 4.9% Lenders under 100 mortgages 3.8% 3.1% 5.8% 3.7% 3.7% 3.5% 3.2% 3.5%
Data Source: 2015 HMDA
JP Morgan Chase and lenders that received between 10,000 and 5,000 applications, as well as the rest of the large non-bank lenders, Quicken, LoanDepot.com and Freedom Mortgage, received a higher proportion of applications for refinancing. Bank of America also shows a slightly higher frequency of these loans, though only for lower denial rate categories.
Table 14: Percent of Refinancing Loan Applications by Denial Category Received by Each Lender and Lending Category
Tracts with 12 or More Black Loan Applications
Denial Rate Category (By Percent Denial Rate for African Americans)
20% and under
21-30% 31 - 40% 41%+
20% and under
21-31% 31 - 40% 41%+
Rural - Urban Split Rural Urban
Wells Fargo 7.28% 6.50% 6.18% 5.24% 8.97% 8.55% 8.33% 7.80%
SECU 5.25% 6.82% 8.47% 9.62% 4.86% 4.91% 5.68% 5.75%
BB&T 3.70% 4.28% 5.13% 6.80% 3.00% 2.92% 3.40% 4.08% Quicken Loans 7.33% 8.02% 8.50% 8.27% 8.26% 8.53% 8.55% 7.83% Suntrust 2.03% 2.35% 2.15% 2.41% 2.22% 2.13% 2.43% 2.25% Loandepot.com 6.48% 7.30% 7.37% 6.75% 6.35% 6.81% 7.50% 6.47% Movement Mortgage LLC 0.79% 0.76% 0.22% 0.12% 0.84% 0.76% 0.55% 0.54% Bank of America 3.45% 2.81% 1.87% 1.78% 3.75% 4.09% 3.47% 2.97% JP Morgan Chase 1.24% 1.06% 1.11% 0.90% 1.37% 1.50% 1.24% 1.13% Vanderbilt Mortgage *no reported applications for refinancing loans
Freedom Mortgage 5.37% 5.86% 4.80% 3.81% 5.55% 5.88% 6.28% 4.02% Lenders between 10K and 5K mortgages 10.36% 9.91% 11.57% 10.68% 9.71% 10.61% 11.33% 11.16% Lenders between 1k and 5K mortgages 28.72% 26.75% 24.97% 26.25% 26.61% 25.68% 24.57% 26.46% Lenders between 500 and 1000 mortgages 9.79% 9.13% 9.67% 10.67% 10.14% 9.33% 8.76% 9.21% Lenders between 500 and 100 mortgages 5.91% 6.03% 5.45% 4.50% 5.92% 5.97% 5.76% 7.51% Lenders under 100 mortgages 2.31% 2.42% 2.57% 2.18% 2.45% 2.32% 2.16% 2.82%
Data Source: 2015 HMDA
Low-Income African American Applicants
Black, then applications where the borrower’s income was lower than the median income for their census tract.
Results of this analysis are shown in Tables 15, 16, and 17 below. First, the lenders that
disproportionally received applications from this population of applicants are Wells Fargo, especially in the higher denial categories, Quicken Loans, Freedom Mortgage and lenders that received between 10,000 and 1,000 loan applications. SECU and Vanderbilt are overrepresented in rural areas, but not urban areas. LoanDepot.com, Movement Mortgage and lenders that received under 1000 loan
applications are underrepresented. JP Morgan Chase, which is underrepresented in the primary level of analysis, is also slightly underrepresented in this group of applicants.
Table 15: Percent of Loan Applications by Lender for African American Borrowers Below Tract Median Income
Tracts with 12 or More Black Loan Applications
Denial Rate Category (By Percent Denial Rate for African Americans)
20% and under
21-30% 31 - 40% 41%+
20% and under
21-31% 31 - 40% 41%+
Rural - Urban Split Rural Urban
Wells Fargo 7.67% 7.15% 7.79% 10.05% 7.86% 8.41% 9.97% 10.51%
SECU 9.32% 9.06% 8.95% 11.17% 5.70% 6.98% 6.75% 6.43%
BB&T 3.01% 4.35% 4.62% 4.61% 1.72% 2.34% 2.84% 3.63% Quicken Loans 3.61% 2.73% 2.60% 2.30% 2.38% 3.36% 3.46% 2.87% Suntrust 2.71% 3.46% 3.03% 3.77% 1.72% 3.17% 3.79% 6.73% Loandepot.com 3.76% 4.86% 3.03% 3.70% 5.50% 6.15% 6.85% 4.99% Movement Mortgage LLC 2.86% 3.02% 0.72% 0.14% 5.46% 4.10% 2.87% 0.61% Bank of America 1.95% 2.36% 0.72% 0.56% 3.65% 2.94% 3.01% 2.57% JP Morgan Chase 0.75% 0.88% 0.43% 0.21% 0.49% 0.63% 0.54% 0.45% Vanderbilt Mortgage 3.61% 5.23% 12.55% 15.14% 0.62% 1.09% 1.66% 3.63% Freedom Mortgage 6.32% 7.37% 5.77% 3.98% 7.90% 8.49% 8.20% 6.05% Lenders between 10K and 5K mortgages 7.52% 10.17% 12.55% 11.37% 10.30% 10.79% 11.18% 14.60% Lenders between 1k and 5K mortgages 27.37% 21.67% 19.62% 18.77% 26.92% 23.82% 21.94% 21.03% Lenders between 500 and 1000 mortgages 10.38% 9.14% 9.16% 7.61% 10.94% 10.23% 9.38% 9.00% Lenders between 500 and 100 mortgages 7.67% 7.30% 5.77% 4.68% 7.04% 5.72% 5.61% 4.69% Lenders under 100 mortgages 1.50% 1.25% 2.67% 1.95% 1.79% 1.79% 1.94% 2.19%
Data Source: 2015 HMDA
The most striking outcome of this analysis was the variation in loan purpose for lower-income Black applicants across different denial tracts in urban and rural areas. Generally, the overall trends observed in the previous look at loan purpose are magnified for this population. In lower denial rate categories the proportion of applications for each purpose was similar to the overall rates shown earlier, though with slightly fewer applications for new purchases. However, as denial rate increases applications for new purchases drop off especially in urban areas. In both rural and urban areas the rate of applications for home improvement loans increases. In rural areas, as denial rate increases, demand for refinancing goes down, while in urban areas it increases.
Denial rates are low for the lowest denial rate category, both urban and rural, even for Black
Table 16: Percent of Loan Purpose and Denial Rate by Loan Purpose for African American Borrowers Below Tract Median Income
Tracts with 12 or More Black Loan Applications
Denial Rate Category (By Percent Denial Rate for African Americans)
20% and
under 21-30% 31 - 40% 41%+
20% and under
21-31%
31 -
40% 41%+
Rural - Urban Split Rural Urban
Percent of Applications for New Home Purchases 42.3% 35.2% 32.8% 34.7% 43.1% 35.4% 28.5% 23.3% Percent of Applications for Home Improvement Loans 6.5% 8.1% 14.6% 16.7% 4.1% 6.8% 9.1% 14.8% Percent of Applications for Refinancing 51.3% 56.7% 52.7% 48.6% 52.9% 57.8% 62.3% 62.0% Denial Rate for New Home Purchase Applications 13.9% 20.9% 30.6% 46.5% 11.0% 15.6% 24.0% 37.3% Denial Rate for Home Improvement Applications 44.2% 60.0% 61.9% 78.8% 50.5% 63.3% 72.3% 84.6% Denial Rate Refinancing Applications 15.8% 28.3% 36.2% 52.7% 19.6% 28.9% 36.0% 49.1%
Data Source: 2015 HMDA
Compared with overall use of FHA for all NC mortgage applicants, and Black applicants of all income ranges (Table 7 above), lower-income African Americans showed a much greater reliance on
government backed loans than the general population, especially in lower denial categories. In higher denial categories, use of government backed loans declines, representing either lack of access to lenders willing to use those types of loans, or incomes and credit histories that do not meet the underwriting requirements for government backed loans. Even more pronounced than for all Black applicants, there is greater use of government backed loans in urban areas compared to rural for this population.
Table 17: Percent of Each Loan Type for African American Borrowers Below Tract Median Income
Tracts with 12 or More Black Loan Applications
Denial Rate Category (By Percent Denial Rate for African Americans)
20% and
under 21-30% 31 - 40% 41%+
20% and
under 21-31% 31 - 40% 41%+
Rural - Urban Split Rural Urban
Conventional 41.8% 46.1% 58.2% 65.5% 38.4% 42.2% 43.8% 56.7% FHA-insured 24.1% 26.8% 22.3% 22.2% 34.4% 34.7% 34.6% 29.8% VA-guaranteed 27.7% 22.3% 16.0% 9.6% 24.9% 21.3% 20.8% 12.8% FSA/RHS-guaranteed 6.5% 4.9% 3.5% 2.7% 2.4% 1.7% 0.8% 0.8%
Data Source: 2015 HMDA
A Closer Look at High Denial Tracts in Urban and Rural Contexts
To get a more complete picture of what these high denial rate tracts, both urban and rural, actually look like on the ground, I’m going to zoom in to downtown Durham, and Bertie County, NC. Durham is one of NC’s larger cities, has a large African American population, and is illustrative of the patterns
High Denial Urban Tracts: A brief look at Durham, NC
Durham is North Carolina’s fourth largest city with a population of about 250,000.29 Located in central
NC, Durham is part of the Triangle metro region, with Chapel Hill and Raleigh. Durham has a population density of 2,291.9 and is about 40% African American, well above the ratio for NC as a whole. For the purposes of my study, Durham is large enough to have a significant urban core surrounded by dense neighborhoods, and many different lending institutions have a presence in the City.
Durham’s real growth began as a tobacco processing center in the years following the civil war, and continued to see growth as a hub for both tobacco and textiles until well into the 20th century.30 Durham
has also had a large, and historically vibrant and entrepreneurial, African American population,
originally centered in the Hayti District southeast of Downtown. Hayti served as both an economic and cultural center for the Black population of central NC, and the South in general for many years. Durham was home to the Black owned and operated North Carolina Mutual Insurance Company and what would become North Carolina Central University.31
In the 1950’s, Durham began to experience stalling economic conditions as industrial employment and textile and tobacco wholesaling declined.32 In response, the City followed the example of many
stagnating municipalities, and drafted urban renewal plans. These efforts resulted primarily in the destruction of the black economic district of Hayti, leaving the Black community and Durham as a whole in dire economic straits that would include disinvestment and fleeing downtown businesses until the 2000s.33
In the 1990s the City intentionally began encouraging a process of revitalization. It started slowly at first, but with the help of some crucial partners has recently led to a vibrant and active downtown, attracting new businesses and residents. Since 2000 there has been $1.2 billion in investment in downtown Durham, with $250 million of projects currently under construction and $200 million in the planning stages.34 This current and planned construction translates to 115,060 square feet of new retail
space, 1.2 million square feet of new office space, and 1,348 new residential units.35
This renewal has come at some costs, and has effected some sections of the City more than others. The areas around Duke University (census tracts 5.00, 4.02, 3.01, 15.01, 15.02 in the map below) and adjacent to downtown (tracts 22.00, 3.02, and 2.00) have experienced faster change in home prices and rents than areas farther south and east of the city center.36 That change is starting to expand
outward, as new investment, new residents and property speculation move farther into the traditionally lower-income and African American south and east Durham. This investment is beginning to cause displacement, especially of low-income renters.37
29 NC League of Municipalities. “Cities by Population.”
30 Anderson, J.B. (2011) Durham County: A History of Durham County North Carolina, 2nc Ed. Duke University Press. Pg
108-130, 147-186
31 Ibid, pg 130-139, 187-190 32 Ibid, pg 349-352, 33 Ibid, pg 342-344
34 Downtown Durham Inc. (2017) “Welcome to Your Downtown, Downtown Durham by the Numbers.”
35 Downtown Durham Inc. (2016) “Downtown Durham 2016 Annual Report”.
36 Social Explorer Tables: ACS 2015 (5-Year Estimates)(SE), ACS 2009 (5-Year Estimates)(SE), Census 2000, Social
Explorer; U.S. Census Bureau
The area chosen for further investigation is made of up of twenty-three census tracts that form a rough circle around Durham’s urban core and includes all of its urban neighborhoods. These tracts are
labeled in Figure 2 below, and outlined in blue. It is important to note that this circle includes all but one of the highest denial census tracts in Durham, with the rest of the county, mostly suburban areas, having lower denial rates. This small study area also includes all of the tracts referenced above, the Hayti area and the traditional majority-Black sections of the City.
Figure 2: Downtown Durham – African American Denial Rate by Census Tract for Tracts with More than 12 African American Loan Applications
Data Source: 2015 HMDA, map created by author in ESRI ArcGIS
Tracts with Less Than 12 African American Loan Applications
Durham’s central business district is primarily within tract 22.00. Currently made up of mostly commercial buildings housing office space and an increasing number of retail and dining
establishments, the lack of residential property is one of the reasons there are not enough African American loans in this tract to analyze. Duke University’s East Campus is tract 15.03, labeled
specifically on the map, and is entirely owned by the University. The remaining tracts that do not have at least 12 Black loan applications do so for two main reasons; lower black populations than the rest of
the area around downtown Durham, and a high percentage of renters, in many cases because of the presence of Duke students. Tracts 4.01, 3.02, have the highest rates of homeownership in the area around downtown but are only 2% and 15% Black respectively by population. Tracts 15.01 and 15.02 contain Duke Hospital, most of Duke’s West Campus, and a number of student rentals, and have rental rates of 84% and 98% respectively. Tract 4.02, adjacent to Duke’s East and West Campus’, is also 72% rental.
Tracts 9.00 and 23.00 are 72% and 89% renter respectively, while also being majority black, unlike the tracts around Duke’s campuses. These tracts also have the highest rates of unemployment, and lowest incomes (accounting for high student areas) in this category. Combined with the fact that they have some of the higher numbers of Black loan applications among those tracts with fewer than 12 Black applications, this indicates these are non-student residential areas and unlike the other tracts in this category, poverty may be a factor in the number of mortgage applications. The non-student
neighborhoods in this group tend to have low African American populations and higher median incomes than the other downtown tracts, including all tracts with more than 12 Black loan applications. A
comparative map of the Black percent of the population of each downtown tract is included in Appendix B, Figure 5.
Table 18: Downtown Durham Tracts with Fewer than 12 Black Loan Applications
Tract Percent Black Alone
Median Household Income
Percent Renter Occupied
Significant Student Presence 4.01 2% $72,778 25% No 4.02 5% $45,610 72% Yes 3.02 15% $50,474 57% Some 15.01 21% $9,107 84% Yes 22.00 26% $62,917 73% No 15.02 34% $25,393 98% Yes 9.00 65% $25,069 72% No 23.00 72% $17,115 89% No
Data Source: 2015 HMDA
Tracts with More Than 12 African American Loan Applications
Overall, the tracts included in the primary analysis, those with more than 12 Black loan applications, have similarly high percentages of renters but lower median incomes and much larger Black
populations than those tracts with fewer than 12 Black applications in Durham. In downtown Durham, these tracts include a wide range of African American denial rates, from 20% to almost 60%. To get a better idea of the factors involved in these differences I split them into three categories; those tracts that were at or below a 30% denial rate, those between 30% and 50%, and those over 50% as laid out in Table 19 below. As tract denial rate increases applicants move away from Wells Fargo and SECU, and are replaced by Suntrust, nonbank lenders and lenders that made fewer loans in NC in 2015.
Similarities