H2B Monoubiquitylation and H3 Methylation Levels Throughout Drosophila Development
By Holly Pittard
Senior Honors Thesis Biology
University of North Carolina at Chapel Hill April16, 2016
This thesis has been prepared in conjunction with BIOL692H and in partial satisfaction of the
Abstract
Histones are DNA-associated proteins that contribute to chromatin structure and
regulation. Modification of the histone H2B by ubiquitylation is thought to be an important
regulator of metazoan gene expression and, by inference, development. However, the levels
of H2B ubiquitylation across developmental stages, and how H2B ubiquitylation affects
other Post Translational Modifications (PTMs), such as H3 methylation, are unknown. To
investigate H2B ubiquitylation levels and its effect on H3 methylation, we have carried out
western blot analysis on developmentally staged Drosophila melanogaster (fruit fly) lysates. We compared H2B ubiquitylation levels and H3 methylation levels of the embryo,
larvae, pupae, and adult fruit flies. To ensure optimal levels of detection, we compared two
types of membranes for our western blotting protocol. We found that the PVDF membranes
showed more sensitive detection of protein levels than did nitrocellulose membrane. We
have also confirmed the effectiveness of antibodies for H2Bub1, H3, and trimethylated
H3K4 Drosophila, which previously had only been tested on budding yeast. Based on our current results, H2Bub1 levels appear to increase as development progresses. Additionally,
further analysis will confirm if there is a correlation between H2B ubiquitylation levels and
H3 methylation levels in different stages, which could indicate the stages in development in
which these modified histones are utilized most. Ongoing studies to mutate H2B and
thereby block ubiquitylation will determine the extent to which this PTM is required for
metazoan development. Together, these studies should improve our understanding of
Introduction
Epigenetics literally means ‘on top of ’ genetics, as it refers to the change in how
genes are expressed without actually changing the nucleotide sequence within DNA. There
are many different ways by which epigenetics can alter gene expression, including
methylation of DNA, chemical changes of RNA, posttranslational modifications (PTMs) of
gene products, and post-translational modification of histones in chromatin. Chromosomes
are made up of chromatin, which consists of DNA and the proteins with which it interacts.
The basic unit of chromatin is the nucleosome.
Nucleosomes are proteins that wrap eukaryotic DNA around itself in order to
condense the DNA within the nucleus of a cell. Each nucleosome is comprised of an octamer
of 4 histones: H2A, H2B, H3 and H4 (as
shown in Figure 1). Posttranslational
modifications (PTMs) of histone proteins
are chemical modifications that can change
how tightly condensed the DNA is around
the nucleosome. Histones can either cause
the DNA to be more condensed, otherwise
known as heterochromatin, or cause the
DNA to be more open, known as euchromatin. The more condensed the DNA is, the harder
it is for proteins to access it and transcribed it into RNA. In contrast, less condensed DNA is
more accessible for transcription.
Figure 1. The above figure shows a nucleosome with the 4 types of histones (H2A, H2B, H3, H4) within an octamer. The Ub attached to the H2B tail stands for the protein ubiquitin. The K4me attached to the H3 tail
One of the most studied PTMs is methylation of lysine residues, which occurs when
a methyl group is added in place of a hydrogen group. This chemical change can sometimes
cause the overall structure of a protein to change, which can respond by creating a
heterochromatic section within the DNA sequence, which blocks transcription.
Ubiquitylation is another type of PTM. Ubiquitin is a small polypeptide that can be added
to, or removed from, histone H2B at a conserved lysine residue. This happens by linking the
ubiquitin to a lysine residue on the protein, histone H2B. This may lead to a change in the
chromatin structure. The proteins Bre1 and Rad6 work together to add ubiquitin to histone
H2B, although each protein is also involved in other processes. Through regulation of
ubiquitylation, methylation, and other histone PTMs, gene expression can be altered.
The gene for adding ubiquitin is evolutionarily conserved in most species, although
the lysine where the ubiquitin is added onto H2B is a slightly different number in each
organism, even though it is technically the same lysine. For example, yeast have a few extra
residues before the lysine that ubiquitin is added to; thus this particular lysine is the 123rd
residue in yeast (H2B-K123). In flies the lysine is the 118th residue, thus H2B is
monoubiquitylated at H2B-K118. In humans the lysine is the 120th residue, thus H2B is
monoubiquitylated at H2B-K120. Since the number that goes with the lysine residue is
different in each organism, the evolutionary conserved ubiquitin mark is referred to as
H2Bub1 across all organisms.
The Matera Lab uses fruit flies (Drosophila melanogaster) as its primary model organism. If all of the genes in a fly stay the same, but histone H2B is not ubiquitylated, then
how does that affect the fly? Past research has shown that the loss of histone PTMs can
histone 3 (H3K36) is essential for viability (McKay et al. 2015). In a past experiment it was
found that in yeast, when Rad6 is deleted, methylation of histone H3 at lysine 79 (H3K79
methylation) is lost, but methylation of histone H3 at lysine 36 (H3K36 methylation) is not.
Thus, in yeast, Rad6, and therefore H2B ubiquitylation, regulates the methylation of H3K4
and H3K79 in a ‘trans-histone’ pathway (Briggs et al. 2002). This has also been shown
directly in yeast. By mutating H2B-K123, H3K4 and H3K79 methylation was shown to be
solely dependent on H2B monoubiquitylation in yeast (Nakanishi et al. 2009). We are
investigating if this relationship between H2B ubiquitylation and H3 methylation is
evolutionarily conserved in Drosophila.
Another study found Bre1p (S. cerevisiae Bre1) to be a homolog of dBre1
(Drosophila Bre1). They found that dBre1 acted in a similar manner to Bre1p, in that dBre1 null mutants also expressed reduced H3K4 methylation (Bray et al. 2005). Sarah Bray,
Hannah Musisi, and Mariann Bienz believed that Bre1 helped to ubiquitylate H2B in both
yeast and flies. At the time of the study, there was no antibody for H2Bub1 suitable for use,
so the investigators were only able to look at H3K4 methylation. Our lab has obtained a
quality antibody for assaying levels of H2B ubiquitylation (H2Bub1) by western blot, along
with H3K4 methylation. Thus, it is now possible to quantify how much of an effect a
mutated Bre1 has on H2Bub1 levels, and how much of an effect H2Bub1 has on H3K4
methylation levels.
Currently, the Matera Lab is investigating how the monoubiquitylation levels of
histone H2B affect trimethylation of lysine 4 on histone 3 (H3K4me3). We are examining
Bre1 null mutants and comparing the ubiquitylated levels of H2B, and methylated H3K4. So
Drosophila melanogaster Oregon R (wild-type) flies. Additionally, H2Bub1 and H3K4me3 levels are low in embryo, larvae, and pupae stages, and increase once flies are adults.
H2Bub1 and H3K4me3 levels have not yet been observed across development. Our results
indicate that adult Drosophila have a distinct pattern of H2Bub1 that is not seen in earlier stages. This shows that there could be potential adult stage-specific functions of H2Bub1, as
well as H3K4me3. These findings will help inform future experiments on the role of
H2Bub1.
Methods
Embryo collection:
Embryos were collected from molasses plate fruit fly cages. The embryos were rinsed in
a solution containing 50% water and 50% bleach, and then collected in a 1.5mL tube.
Approximately 300𝜇𝐿 of buffer with 2x PIC was used for 100𝜇𝐿 embryos. The embryos
were then crushed and centrifuged for 10 minutes at 13,000 RPM at 4ᵒC. The levels of
protein extracted from embryos were then quantified and stored at -80°C.
Larvae collection:
Larvae (3rd instar) were collected from fruit fly cages in a 1.5mL tube, and then
washed 3 times with water. A total of 5𝜇𝐿 of RIPA buffer with 10x PIC per larvae was added.
The larvae were then crushed and centrifuged at 13,000 RPM at 4ᵒC and then stored at
Pupae and Adult collection:
Lysate was prepared from pupae or adult Oregon R flies by collecting 20 flies in a
1.5mL tube, washing them 3 times with water, adding 5 𝜇𝐿 RIPA buffer with 10x PIC per
fruit fly, crushing and centrifuging for 10 minutes at 13,000 RPM at 4ᵒC, and then storing
at -80°C.
Bradford Assays:
Bradford Assays were used to measure lysate concentration by using a dilute
Bradford reagent (1:5) in 1 mL of water with 0.5 𝜇𝐿 protein sample. Absorbance was
measured at 595 nm and concentrations calculated using a BSA standard curve.
Gel Preparation:
A standard SDS-PAGE gel protocol was followed using NuPAGE 12% Bis-Tris Gel
(1.0mm X 10 wells). The gel was pre-run at 165 volts for approximately 1 hour. Protein
lysates, SDS, and 1 X MOPS buffer were boiled for 10 minutes before loading onto gel. The
first well had 5 𝜇𝐿 of protein ladder, and the remaining well rows had 20 𝜇𝐿 of sample in
each. The gel was run at 165 volts for an hour, or until the bands were sufficiently
separated.
Gel Transfer:
A standard transfer protocol was followed. To make a “sandwich”, materials were
put in the following order from bottom to top: 5 sponges, whatman paper, gel,
membrane was used it was dipped in methanol for a few seconds before being stacked onto
the transfer sandwich. The materials were loaded into a transfer box and then filled with
transfer buffer on the inside and cold water on the outside. Each transfer was set to run for
an hour at 450mA at 4ᵒC.
Western Blots:
After the transfer, each NC membrane was put in a 5% blocking solution (0.5g milk
in 10mL of TBST) for 30 minutes. Each PVDF membrane was dipped in methanol, left to dry
for 5 minutes, cut at the desired locations, re-dipped in methanol, and placed in TBST to be
rinsed for 5 minutes. Then the primary antibody was added in TBST with buffer and left
shaking at 4°C overnight. The primary antibody for H2Bub1 was at a 1:1000 dilution in
2.5% buffer (5mL TBST, 0.125 g milk, 5𝜇𝐿 antibody). The primary antibody for H3 was
used at a 1:20,000 dilution in 2.5% milk (0.5 grams milk, 20 mL TBST, and 1 𝜇𝐿 of H3
antibody). The primary antibody for H3K4me3 was at a 1:1000 dilution in 1% milk (0.03g
milk, 3mL TBST, and 3 𝜇𝐿 antibody). The primary antibody for tubulin was added at a
1:30,000 dilution. The membrane was washed with TBST 3 times (5 min each) at room
temperature. The secondary antibody for H2Bub1 and H3 was GC2 Rabbit HRP, which was
added at a 1:5000 dilution on NC membranes, and at a 1:10,000 dilution on PVDF
membranes. The secondary antibody for H3K4me3 was GC2 Rabbit HRP, which was added
at a 1:5000 dilution on both the NC and PVDF membrane. The secondary antibody for
tubulin was anti-mouse, which was added at a 1:5,000 dilution on both the NC and PVDF
hour. Finally, each membrane was sprayed with ECL while on saran-wrap and left for 5
minutes before developing on film.
Results
Before H2Bub1 levels could be determined, it was necessary to optimize the
western blotting protocol. Originally we had minimal detection from the NC membranes,
therefore we decided to compare them to the PVDF membranes. We tested each membrane
under the same protocol as described in Methods, and found that the PVDF membranes
showed more sensitive detection of protein levels than did the NC membranes. This can be
seen in Figure 2, when comparing A and B to C. We have also confirmed the effectiveness of
antibodies for H2Bub1, H3, and trimethylated H3K4 Drosophila, which previously had only been tested on budding yeast. We performed western blots with lysates prepared from
Oregon R flies, a commonly used wild-type strain, and found expected levels of each (Figure
3, Figure 4).
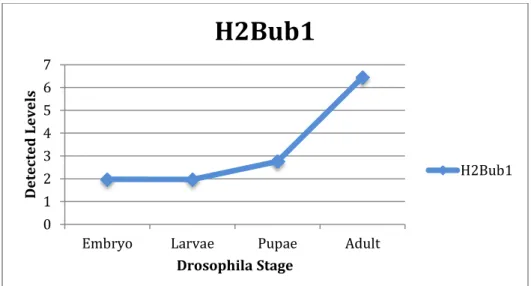
In order to figure out how H2Bub1 levels change throughout development,
developmental western blots were performed with each stage: embryo, larvae, pupae, and
adult. Based on our current results, when normalized to H3 levels, H2Bub1 levels appear to
increase as development progresses (Figure 9, Table 3). Similar low levels of H2Bub1 were
found in both the embryo and the larvae stages. Pupae have intermediate to lower levels of
H2Bub1, while adults have the highest levels of H2Bub1. One experiment shows pupae
levels to be intermediate between larvae and adult levels of H2Bub1 (Figure 5, Figure 6,
Table 1), while another experiment shows pupae levels to be similar to larvae and embryo
Developmental western blots were performed to compare H3K4me3 levels to
H2Bub1 levels between stages. A correlation was identified between H2B ubiquitylation
levels and H3K4me3 levels (Figure 7, Figure 8, Table 2). Similar to H2Bub1 levels, embryo,
larvae, and pupae all tend to have minimal H3K4me3 levels compared to adults. These
findings will help inform and guide future experiments on the role of H2Bub1.
Figure 2. Western blots of H2Bub1 levels in adult Oregon R flies. Each blot shows
Figure 3. Western Blots of H3 levels in adult Oregon R flies, with increasing amounts of lysate loaded from left to right.
Figure 4. Western Blot of H3K4me3 levels in adult Oregon R flies, with increasing amounts of lysate loaded from left to right.
Figure 6. Quantified results of the H2Bub1 developmental western blot, with H3 levels normalized and held constant throughout development. H2Bub1 levels increase
throughout development.
H2Bub1 Embryo 1.98 Larvae 1.97 Pupae 2.76 Adult 6.46 Table 1.
Figure 7. Results of the H2Bub1 and H3K4me3 developmental western blot. Quantification of detection levels are shown in Figure 8 and Table 2.
0 1 2 3 4 5 6 7
Embryo Larvae Pupae Adult
D
et
ect
ed
L
evels
Drosophila Stage
H2Bub1
Figure 8. Quantified results of H2Bub1 and H3 developmental western blots, with H3 levels normalized and held constant. H2Bub1 levels increase overall throughout development. H3K4me3 levels show a similar trend as H2Bub1.
H2Bub1 H3K4me3
Embryo 1.88 0.01
Larvae 2.14 0.33
Pupae 1.75 0.07
Adult 19.29 13.42
Table 2.
Figure 9. The H2Bub1 levels for Figure 6 and Figure 8 are averaged together. H2Bub1 increases throughout development.
0 5 10 15 20 25
Embryo Larvae Pupae Adult
D et ect ed L evels Drosophilia Stage
H2Bub1 and H3K4me3
H2Bub1 H3K4me3 0 2 4 6 8 10 12 14 16 18
Embryo Larvae Pupae Adult
D et ect ed L evels
Drosophila Stage
H2Bub1 Blots Averaged
Average H2Bub1 Embryo 1.93
Larvae 2.05 Pupae 2.26 Adult 12.87 Table 3.
Discussion
Levels of H2Bub1 were slightly higher in larvae than in embryo levels in each
experiment performed. However, in some experiments, larvae levels appeared higher than
pupae levels, which was unexpected. These lower levels of H2Bub1 in pupae could be due
to experimental error. One cause of this experimental error could stem from the
computer’s interpretations, such as the background being detected as higher, resulting in
lower detection of H2Bub1 levels (using ImageQuant TL).
Additionally, one experiment showed pupae levels to be intermediate between
larvae and adult levels of H2Bub1 (Figure 5, Figure 6, Table 1), while another blot (Figure
7, Figure 8, Table 2) shows pupae levels to be similar to larvae and embryo levels. One
possible explanation is that the pupae from the first experiment were more developed and
closer to eclosing than the pupae from the second experiment. Thus, the pupae stage
made to ensure appropriate staging of flies, this possibility cannot be ruled out. This
scenario would be consistent with the high levels of H2Bub1 seen in adults.
There is a correlation between H3K4me3 levels and H2Bub1 levels throughout
development, both having the highest levels at the adult stage. The increase in H3K4me3 is
likely to be related to the increase in H2Bub1 levels. In yeast, it has been shown that H3K4
is solely dependent on H2B monoubiquitination. Considering the conserved nature of H2B
monoubiquitination, current results indicate that H2Bub1 is directly linked to H3K4me3 in
Drosophila as well. Due to the nature of yeast, H2Bub1 and H3K4me3 levels cannot be
tracked over different stages of their lifetime. H2Bub1 and H3K4me3 levels across
Drosophila development has not been observed in the past, and attempting to look at levels throughout development in humans would be very difficult. Thus, the findings that
H3K4me3 is correlated to H2Bub1 levels, and that they both drastically increase into
adulthood give us a first glimpse of how these PTMs are important in each stage of
development.
Ongoing studies to mutate H2B at lysine 118 in Drosophila and thereby block ubiquitylation will determine the extent to which this PTM is required for metazoan
development and H3 methylation. Together, these studies should improve our
understanding of gene regulation in metazoan development, which is often misregulated in
cancer and other diseases. For example, Bray et al. (2005) have shown that H2B
ubiquitylation and H3K4 methylation may be involved with the Notch target genes in fruit
flies. The Notch Signaling pathway is a highly conserved pathway that is also seen in
humans. In fact, misregulation of the Notch pathway is associated with several human
signaling will improve understanding of such diseases. In addition, it is well-known that
regulation of the Notch pathways is essential for healthy development. Thus,
understanding H2Bub1 and its effects on H3K4 and H3K79, among other PTMs, is
important for understanding development.
References:
Bray, Sarah, Hannah Musisi, and Mariann Bienz. Bre1 Is Required for Notch Signaling and Histone Modification. Developmental Cell. Vol 8, 279-286. Feburary, 2005.
Briggs SD, T Xiao, ZW Sun, JA Caldwell, J Shabanowitz, DF Hunt, CD Allis, and BD Strahl. Trans-histone regulatory pathway in chromatin. Gene silencing. Nature publishing Group. Vol 418. August 2002.
“Genome Variations.” Genome News Network, last modified January 15, 2003. [accessed November 15, 2015]
http://www.genomenewsnetwork.org/resources/whats_a_genome/Chp4_1.shtml
McKay, Daniel J., Stephen Klusza, Robert J. Duronio, A. Greg Matera. 2015. Developmental Cell. Interrogating the Function of Metazoan Histones using Engineered Gene Clusters. Cell Press. [accessed 2015 November 20]
http://www.cell.com/developmental-cell/references/S1534-5807%2814%2900846-6
Acknowledgements: