Data-driven Multi-touch Attribution Models
Xuhui Shao
∗ Turn, Inc. 835 Main St. Redwood City, CA 94063[email protected]
Lexin Li
† Department of Statistics North Carolina State UniversityRaleigh, NC 27695
[email protected]
ABSTRACT
In digital advertising, attribution is the problem of assign-ing credit to one or more advertisements for drivassign-ing the user to the desirable actions such as making a purchase. Rather than giving all the credit to the last ad a user sees, multi-touch attribution allows more than one ads to get the credit based on their corresponding contributions. Multi-touch at-tribution is one of the most important problems in digital advertising, especially when multiple media channels, such as search, display, social, mobile and video are involved. Due to the lack of statistical framework and a viable modeling ap-proach, true data-driven methodology does not exist today in the industry. While predictive modeling has been thor-oughly researched in recent years in the digital advertising domain, the attribution problem focuses more on accurate and stable interpretation of the influence of each user inter-action to the final user decision rather than just user clas-sification. Traditional classification models fail to achieve those goals.
In this paper, we first propose a bivariate metric, one mea-sures the variability of the estimate, and the other meamea-sures the accuracy of classifying the positive and negative users. We then develop a bagged logistic regression model, which we show achieves a comparable classification accuracy as a usual logistic regression, but a much more stable estimate of individual advertising channel contributions. We also pro-pose an intuitive and simple probabilistic model to directly quantify the attribution of different advertising channels. We then apply both the bagged logistic model and the prob-abilistic model to a real-world data set from a multi-channel advertising campaign for a well-known consumer software and services brand. The two models produce consistent gen-eral conclusions and thus offer useful cross-validation. The
∗Xuhui Shao is Chief Technology Officer, Turn, Inc.
†Lexin Li is the corresponding author and Associate
Profes-sor, Department of Statistics, North Carolina State Univer-sity.
Permission to make digital or hard copies of all or part of this work for personal or classroom use is granted without fee provided that copies are not made or distributed for prof t or commercial advantage and that copies bear this notice and the full citation on the f rst page. To copy otherwise, to republish, to post on servers or to redistribute to lists, requires prior specif c permission and/or a fee.
KDD’11,August 21–24, 2011, San Diego, California, USA. Copyright 2011 ACM 978-1-4503-0813-7/11/08 ...$10.00.
results of our attribution models also shed several important insights that have been validated by the advertising team.
We have implemented the probabilistic model in the pro-duction advertising platform of the first author’s company, and plan to implement the bagged logistic regression in the next product release. We believe availability of such data-driven multi-touch attribution metric and models is a break-through in the digital advertising industry.
Categories and Subject Descriptors
I.6.5 [Computing Methodologies]: Simulation and
Mod-eling, Model Development
General Terms
Algorithms, Performance, Theory
Keywords
Digital Advertising, Multi-touch Attribution Model, Bagged Logistic Regression
1. INTRODUCTION
Digital advertising started 16 years ago as a new media where traditional print ads can appear [1]. When internet continues to grow with an exploding rate, advertising indus-try embraced digital advertising and has made it a $40 Bil-lion a year mega industry in US alone. Digital advertising’s appeal is not only in its ability to precisely target different groups of consumers with customized ad messages and ad placements, but probably more importantly in its ability to track responses and performances almost instantaneously.
Advertising campaigns are often launched across multiple channels. Traditional advertising channels include outdoor billboard, TV, radio, newspapers and magazines, and di-rect mailing. Digital advertising channels include search, online display, social, video, mobile and email. In this arti-cle, we focus on the digital advertising channels. Typically multiple advertising channels have delivered advertisement impressions to a user. When the user then makes a pur-chase decision or signs up to a service being advertised, the advertiser wants to determine which ads have contributed to the user’s decision. This step is critical in completing the feedback loop so that one can analyze, report and optimize an advertising campaign. This problem of interpreting the influence of advertisements to the user’s decision process is called the attribution problem.
Figure 1: An illustration of multi-touch attribution problem.
The goal of attribute modeling is to pin-point the credit assignment of each positive user to one or more advertising touch point, which is illustrated in Figure 1. The resulting user-level assignment can be aggregated along different di-mensions including media channel to derive overall insights. Attribution modeling is not to be confused with market-ing mix modelmarket-ing (MMM), which is limited to the temporal analysis of marketing channels and can not perform any in-ference at the user level or any dimensions other than mar-keting channel.
To determine which media channel or which ad is to be credited, initially a simple rule was developed and quickly adopted by the online advertising industry: The last ad the user clicked on before he made the purchase or sign up deci-sion, or say, converdeci-sion, gets 100% of the credit. This “last-click win” model was extended to include “last-view win” if none of the ads was clicked within a reasonable time win-dow before user conversion. We call both these two mod-els “last-touch attribution” (LTA), where “touch” or touch point is defined to be any ad impression, click or advertising related interaction the user has experienced from the adver-tiser. The last-touch attribution model is simple. However, it completely ignores the influences of all ad impressions ex-cept the last one. It is a highly flawed model as pointed out by [2].
Alternatively, the concept of multi-touch attribution (MTA) model has been recently proposed, where more than one touch point can each have a fraction of the credit based on the true influence each touch point has on the outcome, i.e., user’s conversion decision. Atlas institute, a division of Mi-crosoft Advertising first proposed the notion of MTA [2]. However, in that paper and other related research from Mi-crosoft Atlas, there is no proposal for how to assign the per-centage of credit statistically based on the campaign data.
Clearsaleing is a consulting company specialized in attri-bution analysis, whose attriattri-bution model assigns equal frac-tion of credits to the first and the last touch point, and collectively all the touch points in between [3]. While a data-driven custom model is described as available upon request, the methodology of the custom model is not publicized.
Another company, C3 Metric, also offers a rule-based MTA model [4]. But like [3], their model assigns credit to certain touch points simply based on the temporal order of touch points and with fixed percentages. In our opinion, because user’s decision process is largely dependent on the
adver-tiser, the product offer, and how advertising messages and creative design are structured, a desirable attribution model should be campaign-specific and be driven by a solid statis-tical analysis of user response data.
In addition to the lack of a true data-driven MTA model, a good metric to evaluate different MTA models is not avail-able either. Intuitively, a good MTA model should have a high degree of accuracy in correctly classifying a user as positive (with a conversion action) or negative (without a conversion action). Equally or more important in digital ad-vertising is that, a good MTA model should provide a stable estimation of individual variable’s (for example, media chan-nel) contribution. Unlike predictive models, the stability of the estimation is especially important here because attribu-tion model determines the performance metric for the ad campaign. Every advertising company and every advertis-ing tactic ultimately are judged by the performance metric set forth in the attribution model. Having stable and re-producible result is by definition what a performance metric needs to be. Ideally the attribution model should be easy to interpret as the results of attribution analysis are often used to derive insights to the ad campaign and its optimization strategy.
Although in recent years predictive modeling has been thoroughly researched in the digital advertising domain, for example in [5] and [6], the focus has been on the classifica-tion accuracy. The resulting models, many generated from a black-box type predictive approach, are very hard to in-terpret. Furthermore, little attention has been paid to the stability issue of the variable contribution estimate. There is also the problem of variable correlation when one tries to interpret the model coefficients directly, which was discussed in section 4.4.2 of [7].
In this paper, we first propose a new bivariate metric. One component of this metric measures the variability of the estimate, and the other measures the accuracy of clas-sifying the positive and negative users. We then develop a bagged logistic regression model, which we show achieves a comparable classification accuracy as a usual logistic regres-sion, but a much more stable estimate of individual vari-able contributions. We also propose a simple and intuitive probabilistic model to compute the attribution of different variables based on a combination of first and second order conditional probabilities. We evaluate both models using the proposed bivariate metric, and find the two generate consis-tent results. We then analyze a large advertising campaign data set, which has 72.5 million anonymized users with over 2 billion ad impressions coming from search, display, social, email and video channels over a four-week period. As for implementation, the probabilistic model has been deployed in the production advertising system of the first author’s company. The bagged logistic regression model is currently being developed for future product release in the production system.
The rest of the paper is organized as follows. We present the bivariate metric in Section 2, and the two data-driven multi-touch attribution models in Section 3. We evaluate the empirical performance the proposed models in Section 4. We conclude the paper with a discussion.
2. A BIVARIATE METRIC
purchase or sign up for a service based on his exposure to various advertisement channels. This is a typical classifi-cation problem, where the outcome is binary, with positive meaning a user is to make a purchase action and negative meaning otherwise, and the covariates are the number of touch points of different channels. Towards that end, we employ the usual misclassification error rate as part of an evaluation metric for an MTA model.
On the other hand, human behavior is complex and the user data are highly correlated. As a consequence, a sim-ple MTA model, e.g., a usual logistic regression, could have highly variable estimate which would make the model dif-ficult to interpret. In addition, the high collinearity in at-tributes also causes strong variables to suppress weaker, cor-related variables as described in Section 4.4.2 of [7]. There-fore we aim to capture the variability of an MTA model in our model evaluation metric. Towards that goal, we employ the notion of standard deviation and also take advantage of the fact that the advertising campaign data almost always have a large number of users.
More specifically, we first obtain a random subset of sam-ples of both positive and negative users as a training data set, then another random subset as a testing data set. To avoid having too few positive users in the samples, we fix the ratio of positive versus negative users. In our numerical analysis, we have experimented this ratio with 1 : 1 and 1 : 4 and the two yield very similar results. For brevity we only report the results based on 1 : 4 ratio below. We then fit an MTA model to the training data. We record the con-tribution of each advertisement channel, i.e., the coefficient estimate, from the fitted MTA model. We also evaluate the fitted model on the independent testing data and record the misclassification error rate.
We then repeat the above process multiple times in order to compute the standard deviation of individual coefficient estimates across multiple repetitions. We report the aver-age of all standard deviations across different channels as the variability measure (V-metric), and the average of mis-classification error rates across data repetitions as the accu-racy measure (A-metric). We evaluate an MTA model based upon the bivariate metric of both the variability and the ac-curacy (the V-A-metric). A small A-metric indicates that the model under investigation has a high accuracy of pre-dicting the active or inactive user, while a small V-metric indicates that the model has a stable estimate. Ideally a good MTA model should have both metrics small.
3. MULTI-TOUCH ATTRIBUTION MODELS
3.1 A Bagged Logistic Regression
There have been intensive research on classification mod-eling in the literature. Some well known examples include support vector machines [8], neural networks [10], and other unique methods designed for online advertising in [6] and [9]. See [7], [10] and [11] for a good review. Most of those methods generate a complex model, some of which are of a black-box type. The resulting classification boundary is rather flexible, so it can achieve a competent classification accuracy. However, in attribution modeling, it is more of a concern to obtain a model that is stable and relatively easy to interpret, so that advertisers can develop a clear
strat-egy to optimize their resource allocations and optimization among multiple advertising channels.
The bagging approach as a meta learning method was first proposed in [12]. One of the most popular bagged ap-proaches is random forest [13] where decision tree models are stacked to increase performance and robustness. Bagged lo-gistic regression is not of much interest in terms of predictive modeling, since it is more productive to combine nonlinear models in order to increase the prediction accuracy. It has been shown to be outperformed by the tree-based method [14]. On the other hand, the bagging approach possesses the ability to isolate variable collinearity, as discussed in Section 15.4.1 of [7].
In our context of attribution modeling, we combine the commonly used logistic regression, which is simple and easy to interpret, and the bagging idea, which is to help reduce the estimation variability due to the highly correlated co-variates. This results in the bagged logistic regression, which retains the ease of interpretation of a simple logistic model, whereas achieving a stable and reproducible estimation re-sult. More specifically, the bagged logistic regression is fitted using the following steps.
Step 1. For a given data set, sample a proportionpsof
all the sample observations and a proportionpcof all
the covariates. Fit a logistic regression model on the sampled covariates and the sampled data. Record the estimated coefficients.
Step 2. Repeat Step 1 forM iterations, and the final
coefficient estimate for each covariate is taken as the
average of estimated coefficients inM iterations.
The sample proportion ps, the covariate proportion pc,
and the number of iterationsM are the parameters of the
bagged logistic regression. We will examine their choices in detail in Section 4. Our observations are that, for a range of values ofpsandpcthat are not close to either 0 or 1, the
bagged logistic regression yield similar results. Besides, the
results are not overly sensitive to the choice of M. When
evaluating the model using the proposed V-A-metric, we find that, the bagged logistic regression achieves a very similar misclassification rate (A-metric) but enjoys a much smaller variability (V-metric) compared to a usual logistic regres-sion, which is desirable for attribution modeling.
3.2 A Simple Probabilistic Model
In addition to the bagged logistic regression model, we also develop a probabilistic model based on a combination of first and second-order conditional probabilities. This new model is even simpler than a logistic model. Such a model simplicity translates into both low estimation variability and ease of interpretation, meanwhile it trades off accuracy. As such, compared to the bagged logistic model, we expect the new model would achieve a smaller V-metric but a larger A-metric. Our numerical analysis confirms this expectation.
The probabilistic model is generated using the following steps:
Step 1. For a given data set, compute the empirical probability of the main factors,
P(y|xi) =
Npositive(xi)
Npositive(xi) +Nnegative(xi)
and the pair-wise conditional probabilities
P(y|xi, xj) =
Npositive(xi, xj)
Npositive(xi, xj) +Nnegative(xi, xj)
, (2)
for i 6= j. Here y is a binary outcome variable
de-noting a conversion event (purchase or sign-up), and
xi, i= 1, . . . , p, denotepdifferent advertising channels.
Npositive(xi) and Npositive(xi) denote the number of
positive or negative users exposed to channel i,
re-spectively, and Npositive(xi, xj) and Nnegative(xi, xj)
denote the number of positive or negative users
ex-posed to both channelsiandj.
Step 2. The contribution of channeliis then computed
at each positive user level as:
C(xi) = p(y|xi) + 1 2Nj6=i X j6=i n p(y|xi, xj) −p(y|xi)−p(y|xj) o , (3)
whereNj6=i denotes the total number ofj’s not equal
to i. In this case it equals to N-1, or the total
num-ber of channels minus one (the channel iitself) for a
particular user.
The model is essentially a second-order probability esti-mation. Due to the similarly designed advertising messages and user’s exposure to multiple media channels, there are a fair amount of overlapping between the influences of dif-ferent touch points. Therefore it is critically important to include the second-order interaction terms in the probability model. Theoretically we can go to the third-order, fourth-order interactions or higher. However, the number of ob-servations with the same third-order interaction drops sig-nificantly for even a data set as large as the one analyzed in Section 4. Therefore, it is of little practical use to at-tempt to estimate the empirical probability with the third or higher order. Furthermore, we make an important as-sumption in the probability model in that the net effect of the second-order interaction goes evenly to each of the two factors involved. Based on the Occam’s Razor principle, we feel this is the minimal assumption we need to make without any data evidence to suggest otherwise. Focusing on the first and second-order terms also helps to reduce any assumption to a minimum – for example, trying to split the effect in the third-order interactions can be more hazardous than in the second-order interactions.
In Section 4, we will employ both the bagged logistic re-gression model and the probabilistic model to analyze the same advertising campaign data set for overall attribution results across all main media channels. Our results show that, while there are small differences, the general conclu-sion is consistent between the two models.
The reason that we consider more than one model is the following. Digital advertising relies on a fair amount of sub-jectivity. Having two different modeling approaches give ad-vertiser the flexibility to choose. The bagged logistic regres-sion model is more accurate and more flexible with a larger number of covariates. It is slightly more difficult to interpret. On the other hand, the probabilistic model is less accurate but much more intuitive to interpret. In addition, the result from both models can cross-validate the general conclusion reached in the overall advertising campaign analysis.
4. NUMERICAL ANALYSIS
4.1 Data Background
In this section, we analyze a large advertising campaign data set using both proposed methods. This is a 2010 ad-vertising campaign of a consumer software and services com-pany. The campaign ran over a four week period. The size of the data set is over 300GB compressed. We sampled one-third, i.e., 72.5 million anonymous users. In total these 72.5 million users received over 2 billion ad impressions coming from search, display, social, email and video channels over a four-week period. Because search advertising is priced as pay-per-click model, only search clicks are reported for each user. Furthermore, more than a dozen advertising networks or equivalent media buying channels are involved in deliver-ing identically designed advertisements. In our study, there are 39 channels in total. It is an unresolved but critically im-portant problem for the advertiser to determine the true ef-fectiveness of each media buying channels. This attribution analysis is not only important for ranking the effectiveness of the channels, but also in deriving insights so that different optimization tactic can be deployed under different circum-stances. We apply the bagged logistic regression model and the simple probabilistic model to analyze this data.
4.2 Bagged Logistic Regression Analysis
In this section we examine the empirical performance of the bagged logistic regression model, and compare with the usual logistic regression using the V-A-metric. In addition, we also examine the choice of the tuning parameters in the bagged logistic regression. The simulation setup is based upon the following scheme.
Step 1. Randomly sample a subset ofN users as the
training data. We chooseN = 50,000, and the ratio
between the active and inactive users is 1 : 4. (The results for the ratio of 1 : 1 are very similar, so are omitted for brevity.) This leads to 10,000 randomly selected active users and 40,000 inactive users. Step 2. Randomly sample another independent subset
ofN users as the testing data.
Step 3. Fit the bagged logistic regression to the
train-ing data, with the pre-specified sample proportionps
and the covariate proportionpc, and obtain the
coeffi-cient estimate.
Step 4. Fit the usual logistic regression to the training data, and obtain the coefficient estimate.
Step 5. Evaluate the misclassification error rate of both regression models on the testing data.
Step 6. Repeat Steps 1 to 5 forS = 100 times.
Com-pute the V-A-metric for both regression models. Be-cause each sampling is random, all data have chance of being selected as training or testing data.
We set the sample proportion asps = 0.25,0.5 and 0.75,
and the covariate proportion as pc = 0.25,0.5 and 0.75,
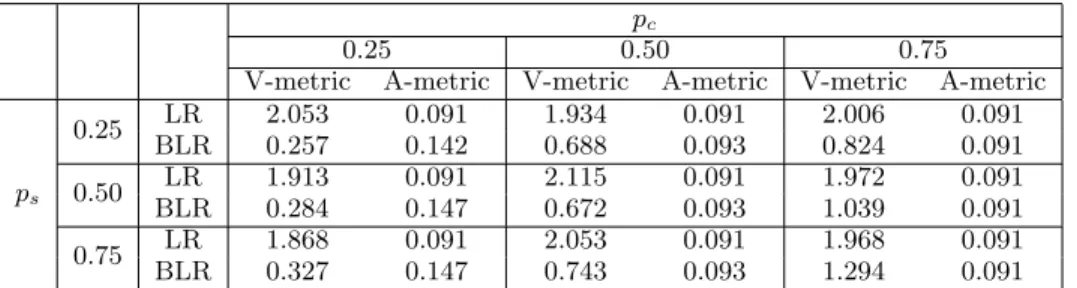
re-spectively. Table 1 reports the results. It is seen from the
Table 1: Comparison of the bagged logistic regression (BLR) and the usual logistic regression (LR) in terms of the V-A-metric.
pc
0.25 0.50 0.75
V-metric A-metric V-metric A-metric V-metric A-metric
ps 0.25 LR 2.053 0.091 1.934 0.091 2.006 0.091 BLR 0.257 0.142 0.688 0.093 0.824 0.091 0.50 LR 1.913 0.091 2.115 0.091 1.972 0.091 BLR 0.284 0.147 0.672 0.093 1.039 0.091 0.75 LR 1.868 0.091 2.053 0.091 1.968 0.091 BLR 0.327 0.147 0.743 0.093 1.294 0.091
logistic model achieves a substantially smaller V-metric but also a worse A-metric compared to the usual logistic model.
Whenpsandpctake some value in the middle range of zero
and one, e.g., when ps = 0.5 and pc = 0.5, we clearly see
that the bagged model achieves a variability measure that is much smaller than the variability of the usual logistic model, whereas the accuracy measure of the two models become
al-most identical. As ps and pc increase closer to one, the
bagged model exhibits a A-metric that is essentially iden-tical to that of the usual logistic model, but with a lower
V-metric. As such we recommend to choose ps and pc to
take values around 0.5 if both the variability and the
accu-racy are of the concern. For the number of iterations M,
we have experimented with a number of values and observe the same qualitative patterns. For brevity, we only report
in Table 1 the results based on M = 1000 iterations. We
also note that the V-metric for the usual logistic regression varies a little although it does not depend on the varying
parametersps andpc. This is due to the random sampling
variation, which to some extent reflects how variable the usual logistic model can be for the advertising data — even a random subset of samples would cause visible estimation variation.
4.3 Probabilistic Model Analysis
We next apply the simple probabilistic model to the same data set, and we evaluate the model with the V-A-metric. The resulting V-metric is 0.026, whereas the A-metric is 0.115. Comparing with the results in Table 1, we see that the probabilistic model achieves a very low variability due to its deterministic logic and simple model structure. On the other hand, its misclassification rate is higher than the bagged logistic model, which again is intuitively attributable to the low model complexity. These observations reflect the well known bias-variance tradeoff. Although more compli-cated models, e.g., a higher order probabilistic model, could improve estimation accuracy, it would also induce higher variation. Besides, higher order models are often computa-tionally infeasible for ad data of such a scale.
We also compare the bagged logistic regression model and the simple probabilistic model in terms of MTA user-level assignment. For the bagged logistic model, we take the lin-ear term ˆβ′xias the contribution of the channeli, where ˆβ
denotes the coefficient estimate based on the bagged model. For the simple probabilistic model, we use equation (3) to
compute user-level assignment for each channel. We
re-sample the data S = 100 times, and show the box plot
for the two models in Figure 2. First, we observe that the two models yield very similar patterns, suggesting a good agreement of the two models. Second, the bagged logistic regression model exhibits a relatively low variability across data re-sampling, whereas the simple probabilistic model shows a even smaller variability due to its model simplicity. We also comment that, for ease of comparison, we choose the simplest feature construction scheme for all the mod-els, i.e., we only encode the presence of each channel as a binary variable. The actual model can take on more com-plex features such as the creative design, web-site category, time of advertisement, frequency of the user’s exposure to the same ad, among others. While the scaling constants are different, both proposed models have a computation
com-plexity ofO(p2N), wherepis the number of dimensions and
N is the data sample size. These additional variables have
been implemented in the production environment of the first author’s company with the help of a cluster of multi-core Linux servers. The general conclusion reached in this paper extends well to those more complex models.
4.4 Interpretation of the Results
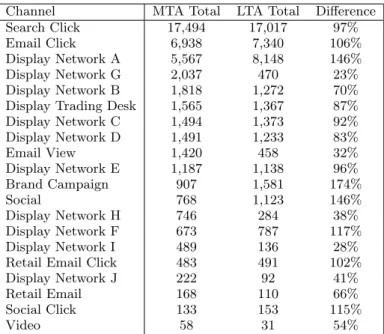
We presented the user-level attribution analysis to the ad-vertising team. Some interesting observations were made when comparing the MTA model with advertiser’s existing LTA model. The comparison is show in Table 2 for a subset of channels that are of particular interests to the advertising team. As seen from the table, for search click, email click, retail email click and social click, MTA and LTA get very similar numbers. Essentially these types of user initiated responses are both: highly correlated to the final purchase decision; and temporally occurring very close to the pur-chase decision.
On the other hand, the effectiveness of display ad net-works are widely different. Overall, display ads (or banner ads) are undervalued by the LTA model since these ad im-pressions are usually further away in time from the purchase action than, say, search click. In addition, some ad networks (for example, Network G) are doing much better and some (for example, Network A) are doing much worse. This may be attributed to a trick some ad networks play in gaming the LTA model. It is called “cookie bombing” where large amount of low-cost almost invisible ads are shown to large amount of users. While these impressions do not have much real influence on user’s decision, they appear quite often as the last ad impression user ”sees” and therefore gets the credit from LTA model.
V1 V3 V5 V7 V9 V11 V13 V15 V17 V19 V21 V23 V25 V27 V29 V31 V33 V35 V37 V39
0
5000
15000
bagged logistic regression model
V1 V3 V5 V7 V9 V11 V13 V15 V17 V19 V21 V23 V25 V27 V29 V31 V33 V35 V37 V39
0
5000
15000
simple probabilistic model
Figure 2: MTA user-level assignment for the bagged logistic regression model and the simple probabilis-tic model.
Our models provided some important insights that helped the advertiser to gauge the true effectiveness of each media channel and root out those gaming tactics. By this change alone, it is estimated that the advertiser can improve the overall campaign performance by as much as 30%.
5. DISCUSSION
In this article we proposed two statistical multi-touch at-tribution models. We also proposed a bivariate metric that can be used to evaluate and select a data-driven MTA model. We consider the main body of this work falls under descrip-tive or interpredescrip-tive modeling, a field that has been largely ignored in comparison to predictive modeling. For digital advertising, having the right attribution model is critically important as it drives performance metric, advertising
in-Table 2: The MTA user-level attribution analysis.
Channel MTA Total LTA Total Difference
Search Click 17,494 17,017 97%
Email Click 6,938 7,340 106%
Display Network A 5,567 8,148 146%
Display Network G 2,037 470 23%
Display Network B 1,818 1,272 70%
Display Trading Desk 1,565 1,367 87%
Display Network C 1,494 1,373 92% Display Network D 1,491 1,233 83% Email View 1,420 458 32% Display Network E 1,187 1,138 96% Brand Campaign 907 1,581 174% Social 768 1,123 146% Display Network H 746 284 38% Display Network F 673 787 117% Display Network I 489 136 28%
Retail Email Click 483 491 102%
Display Network J 222 92 41%
Retail Email 168 110 66%
Social Click 133 153 115%
Video 58 31 54%
sights and optimization strategy. We believe our work makes some useful and unique contribution in this field.
Current state-of-the-art attribution models are represented by [2], [3] and [4]. Comparing to our proposed models, none of the existing publicized models are statistically derived from the advertising data in question. To apply those mod-els, one needs to either rely on some universal rule that would result in identical assignment regardless of advertis-ers or user context ([3] and [4]), or one needs to come up with some subjective assignment rule oneself based on hu-man intuition. By contrast, our methods are data-driven and are based upon the most relevant advertising data, and as such are believed to be more accurate and objective.
The probabilistic model is currently deployed in the pro-duction environment of the first author’s company. It is the industry’s first data-driven multi-touch attribution model commercially available to the best of our knowledge. Be-cause of this, at the time of this writing, a number of top-5 media holding companies and several Fortune 100 advertis-ers have signed up to test this MTA model. We are also planning to develop and deploy the bagged logistic regres-sion model as a follow-up verregres-sion so that advertisers can choose either model to focus more on accuracy or more on interpretation.
While we believe both methods are statistically sound, to make MTA models useful for digital advertising requires additional heuristics in the following areas:
1. Select the right dimensions to model on. Introduc-ing unnecessary dimensions would introduce noise and make results difficult to interpret.
2. Control the dimensionality and cardinality. Higher di-mensionality and cardinality would either significantly increase the amount of data needed for statistical sig-nificance or drown out the important conclusions.
3. Carefully encode variables so that domain knowledge could help choose a compact yet effective model. There are a number of avenues for future research. First, bagging process is a wrapper method that can be applied to many types of learning machines. For example Random Forrest [13] is a very popular bagged decision tree model. We choose logistic regression for the ease of implementation and the simple interpretation of the coefficients. One area of the future development is to extend this MTA framework to other learning machines so that we can choose a more powerful learning method while still be able to easily derive the user-level attribution assignment. Another area of devel-opment is in formalizing the heuristics needed for building specific types of MTA models that can address typical dig-ital advertising questions such as budget allocation, cross-channel optimization, and message sequencing. The third area is in incorporating the MTA model into predictive ad-vertising models. Attribution model defines the success met-ric of each advertising campaign. Because of the dominance of the LTA model, many predictive models used today are influenced by it. New predictive models are needed when advertisers start to adopt the new attribution model.
6. REFERENCES
[1] D’Angelo, F. Happy Birthday, Digital Advertising! 2009.
http://adage.com/digitalnext/post?article_id=139964 [2] Chandler-Pepelnjak, J. Atlas Institute, Microsoft
Advertising. Measuring ROI Beyond the Last AD. http://www.atlassolutions.com/uploadedFiles/Atlas/ Atlas_Institute/Published_Content/
dmi-MeasuringROIBeyondLastAd.pdf.
[3] Clearsaleing Inc. Clearsaleing Attribution Model. http://www.clearsaleing.com/product/
accurate-attribution-management/ [4] C3 Metric, Inc. What is C3 Metric.
http://c3metrics.com/executive-summary/
[5] Provost, F., Dalessandro, B., Hook, R., Zhang, X., and Murray, A. Audience Selection for On-line Brand Advertising: Privacy-friendly Social Network
Targeting. InProceedings of the Fifteenth ACM
SIGKDD International Conference on Knowledge
Discovery and Data Mining, 2009.
[6] Li, W., Wang, X., Zhang, R., Cui, Y., Mao, J., and Jin, R. Exploitation and Exploration in a Performance
Based Contextual Advertising System. InProceedings
of the Fifteenth ACM SIGKDD International
Conference on Knowledge Discovery and Data Mining,
2010.
[7] Hastie, T., Tibshirani, R., and Friedman, J.The
Elements of Statistical Learning: Data Mining, Inference and Prediction, 2nd Edition, Springer, New York, 2009.
[8] Cortes, C., and Vapnik, V. Support-Vector Networks. Machine Learning, 20, 273-297, 1995.
[9] Jin, X., Li, Y., Mah, T., and Tong, J. Sensitive Webpage Classification for Content Advertising. In Proceedings of the 1st international workshop on Data mining and audience intelligence for advertising, 2007.
[10] Bishop, C.M.Neural Networks for Pattern
Recognition, Oxford University Press, 1996.
[11] Bishop, C.M.Pattern Recognition and Machine
Learning, Springer, 2007.
[12] Breiman, L. Bagging Predictors.Machine Learning,
24, 123-140, 1996.
[13] Breiman, L. Random Forests.Machine Learning, 45,
5-32, 2001.
[14] Perlich, Cl, Provost, F., and Simonoff, J.S. Tree Induction vs. Logistic Regression: A Learning-Curve
Analysis.Journal of Machine Learning Research, 4,