Consistency Test of
Revealed Comparative
Advantage Index:
Evidence from India’s
Agricultural Export
Subhash Jagdambe
1Abstract
This article analyses the competitiveness of India’s agricultural products in world markets. Four indices of revealed comparative advantage (RCA) were used at the four-digit level of harmonized system (HS) of classification for the period of 1996–2015. Under live animal products, 7 out of 26 products showed RCA. For vegetable products, 21 out of 58 showed strong RCA. For products like animal or vegetable fat and prepared foodstuff, 2 out of 16 and 9 out of 49 showed RCA, respectively. Further, the consistency tests reveal that the indices are less satisfactory as the cardinal and dichotomous measures but relatively satisfactory as ordinal measure. Hence, study would propose an ordinal interpretation of RCAs indices for better policy formulation. The study has also found the pattern of RCA indices to be fairly stable over the years.
JEL Codes: F1, Q1 Keywords
RCA index, consistency test, agriculture, India and world
Introduction
The growth in international trade has been quite impressive in the last two-and-a-half decades due to falling trade costs and lower trade barriers. The reduction in trade barriers will lead a country towards its comparative advantages; it results in Article
1 Institute for Social and Economic Change (ISEC), Bangalore, Karnataka, India. Corresponding author:
Subhash Jagdambe, Institute for Social and Economic Change (ISEC), Bangalore, Karnataka 560072, India.
E-mails: [email protected]; [email protected]
Foreign Trade Review 54(1) 16–28, 2019
©2018 Indian Institute of Foreign Trade Reprints and permissions: in.sagepub.com/journals-permissions-india DOI: 10.1177/0015732518810838 journals.sagepub.com/home/ftr
Jagdambe 17
more competitive pressures and the transfer of factors of production, leading to productivity gains from trade. In the early 1990s, India introduced a series of economic reforms to open up the economy and liberalize trade. That was expected to change the composition of export baskets and reflect India’s comparative advantages in the global market. Further, ‘a country’s comparative advantage in international trade may be influenced by differential rates of change in accumulation of production factors or due to the increased trade integration of other countries’ (Batra & Khan, 2005). However, the agriculture sector has been excluded from these major economic reforms even though it has been playing a vital role in India’s economic development in terms of providing employment and food and earning foreign exchange. Keeping this issue in mind, the present study attempts to examine the comparative advantages of India’s agricultural sector with respect to the world.
This article is organized as follows: the first section gives an overview of the Indian agricultural trade, second section presents a brief review of existing litera-ture, third section discusses the data and methodology, fourth section presents the results of the study and the last section summarizes and concludes.
Overview of Indian Agricultural Trade
Agriculture is one of the main pillars of Indian economy and provides livelihood to more than 54 per cent of the rural workforce (GoI, 2011) and raw materials to indus-tries. Further, balance of trade in agriculture has remained consistently favourable over the years. Despite its falling share in gross domestic product (GDP)—from 54.66 per cent in 1950–1951 to 15.01 per cent in 2015–2016 (GoI, 2013)—it still contributed around 11.87 per cent of the total export earnings in 2015.
In the last decade, the Indian agricultural sector has shown an outstanding improvement in the volume of trade with the world, which has increased from US$ 8.35 billion in 2000 to US$ 55.53 billion in 2015. It can be observed from Table 1 that the value of agricultural exports has increased from US$ 5.26 billion
Table 1. Trends of Agriculture Trade (US$ Billion)
Year ExportAgri. ImportAgri. Agri. Trade Balance Total National Export Total National Import Total National Trade Balance % Share of Agri. Export to Total National Export % Share of Agri. Import to Total National Import 2000 5.26 3.09 2.17 36.10 45.18 –9.08 14.80 6.84 2005 6.56 4.57 1.99 65.92 84.08 –18.16 10.26 5.87 2010 16.04 9.48 6.56 169.23 265.80 –96.57 9.46 3.56 2015 35.86 19.68 16.18 301.92 453.51 –151.59 11.86 4.39
Source: Author’s calculation based on WITS database.
18 Foreign Trade Review 54(1) to US$ 35.86 billion over the study period. The imports also increased from US$ 3.09 billion to US$ 19.68 billion during the same period.
Table 1 reveals that India’s agricultural trade balance remained in favour of India but the total national trade balance was negative and unfavourable for India during the study period. It implies that Indian agriculture has a very important role in reducing the total national balance of payments deficit. Additionally, percent-age share of agricultural exports and imports in total national exports and imports has increased over the period 2000–2015. The percentage share of agricultural exports to total national exports decreased during 2000–2015 and afterwards, it gradually increased to 11.86 per cent in 2015. Percentage share of imports to total national imports also found the same pattern.
RCA: An Overview
Within international trade literature, two prominent theories on comparative advantages are—the Ricardian theory, and the Heckscher and Ohlin (H–O) theory. Ricardo (1817) stated that absolute production cost difference rather than comparative cost difference is the reason for international trade. However, the H–O theory discussed about difference in factor prices across countries as a reason for international trade.
Balassa (1965) first empirically calculated Revealed Comparative Advantage (RCA) index using post-trade data and modified it over the years, 1977, 1979 and 1986. The index does not determine the sources of comparative advantage rather it tries to identify whether a country has RCA or not. The RCA index has been widely used across the studies (Andrew, 1996; Batra & Khan, 2005; Ferto & Hubbard, 2002; Yeats, 1985).
Balance, Forstner and Murray (1987) provided a simple theoretical relation-ship between the theoretical notion of comparative advantage and the practical measurement of comparative advantage that we obtain practically. The following flow chart shows the relationship:
EC→ CA→TPC→RCA.
The economic conditions (EC) vary across countries and determine the tional pattern of comparative advantage (CA) that relies on the pattern of interna-tional trade, production and consumption (TPC) that is used to calculate the actual measure of RCA Index. The RCA indices, that have been suggested in order to identify the underlying pattern of CA, are constructed from TPC and possibly other post-trade variables (Sanidas & Shin, 2011, pp. 1–57).
Ferto and Hubbard (2002) used modified RCA index developed by Vollrath (1991) namely the relative trade advantage, the logarithm of the relative export advantage and revealed competitiveness. They found that in spite of changes in the agricultural scene of Hungary, the pattern of RCA remained stable.
Oduro and Offei (2014) used four RCA indices and a consistency test for RCA indices to investigate Ghana’s RCA in agro-processed products. The consistency result showed that the four indices of RCA are less consistent as cardinal and
Jagdambe 19
ordinal measure but relatively fairly consistent as a dichotomous measure. This implies that RCA measures are useful indicators in determining whether Ghana has a comparative advantage or disadvantage in agro-processed products. Ufuk (2011) evaluated recent proposed additive measure of RCA index as alterna-tive to Balassa (1965) index to assess their applicability by means of their consist-ency across the dimension.
Data and Methodology
This article is based on export and import data of World Integrated Trade Solution (WITS),1 for period of 20 years from 1996 to 2015. For this analysis, HS chapters
01–4 on agriculture sector covering 149 products at four-digit level were used and grouped2 into four categories (Table 2).
The study used widely accepted tool in international trade literature to analyse the comparative advantage, developed by Balassa (1965), known as RCA index that can be expressed as following:
RCA1
ij = (Xij/Xt) / (Xwj/Xwt) (1) where,
RCA1
ij = revealed comparative advantage for country i in product j.
Xij = value of country i’s export of product j; Xt = value of country i’s total agriculture exports; Xwj = value of world export of product j;
Xwt = value of world total agriculture exports;
The RCA index value ranges between zero (0) and positive infinity (+∞)3.
Vollrath (1991) proposed following three alternative measures of RCA: 1. Relative Trade Advantage (RTA) index—expressed as the difference
between Revealed Export Advantage (RXA) and Revealed Import Advantage (RMA).
RCA2
ij = RTAij = RXAij – RMAij (2)
Table 2. Commodity Classification
Categories Number of Products
Live animal products 26
Vegetable products 58
Animal or vegetable fat products 16
Prepared foodstuff products 49
Total 149
20 Foreign Trade Review 54(1) where,
RXA = (Xij/Xt) / (Xwj/Xwt), RMA = (Mij/Mt)/ (Mwj/Mwt) RCA2 = second measure of revealed advantage
M = imports, and X = exports;
2. Logarithmic transformation of the RCA1
RCA3 = ln (RXA
ij) (3)
RCA3 = third measure of revealed advantage
3. Revealed Competitiveness (RC)—expressed as the difference between logarithms of relative export advantage and relative import advantage.
RCA4 = RC = ln (RXA1
ij) – ln (RMAij) (4)
RCA4 = the fourth measure of revealed comparative advantage
A positive value of RTA, ln (RCA) and RC indicates comparative advantage, whereas a negative value indicates comparative disadvantage.
This article employed all the four RCA indices (aforementioned equations 1 to 4) to estimate India’s RCA in agricultural products. Study has conducted consistency tests for RCA indices as cardinal measures, ordinal measures and dichotomous measures proposed by Balance at el. (1987).4
The study used various measures to check the stability of these indices. The first indicator of stability in RCA is the coefficient of variation and the second is the correlation between the index in a time period t and the index in subsequent time periods. Using 2000 as a base year, the correlation coefficient for four indices is calculated for 2005, 2010 and 2015 for India.
Empirical Findings
1. RCA of Agricultural Products
a. Live animal products: The study of four RCA indices estimated for live animal products over the period 2000–2015 found that out of 26 live animal products only 7 commodities have RCA. Table 1a appen-dix presents the average value of four RCA indices and their coeffi-cient of variation5.
b. Vegetable products: The RCA values for some products were stable over the study period, whereas some others showed increasing and decreasing trends. Among them, 21 commodities have strong RCA in exports in all four indices.
c. Animal or vegetable fat products: In this category only two com-modities have shown RCA in all four indices. Groundnut; oil and its fractions; fixed vegetable fats and oils and their fractions; and animal or vegetable fats and oils had comparative advantage over the study period. Overall, the average value was negative over the years implying its comparative advantage.
Jagdambe 21
d. Prepared foodstuff products: In this category, 9 commodities have revealed comparative advantage in exports. Those are the products which revealed comparative advantages on all four indices except for the year 2005.
2. Consistency Test of RCA
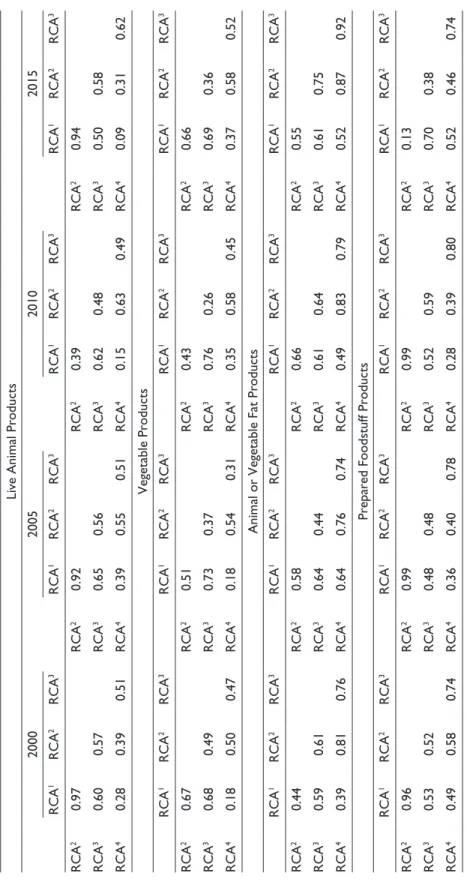
a. Cardinality Test: Cardinality test of RCAs will show the degree of comparative advantage. The correlation coefficient was used to exam-ine the consistency of cardinal measure. The estimated results of con-sistency test of cardinality of the four indices from 2000–2015 are shown in Table 3. The critical cut-off point to indicate consistency is > 0.70.
For live animal products, consistency test found that only 3 out of 24 paired indices (0.70), or 12.5 per cent, showed a high level of correlation. In case of vegetable products, it found that high level of correlation in only 2 out of 24 paired indices. For products like animal or vegetable fat, it found that 9 out of 24 paired indices, or 37.50 per cent, showed a high level of correlation. In case of prepared foodstuff products, it found that 8 out of 24 paired indices, or 33.33 per cent, showed a high level of correlation. The results showed that only one of the six possible parings (RCA1 and RCA2) found to have
a high level of correlation. The results obtained for all the four indices are not consistent as a cardinal measure of comparative advantage. Earlier studies had found similar results (Andhale & Kannan, 2015; Ferto & Hubbard, 2002).
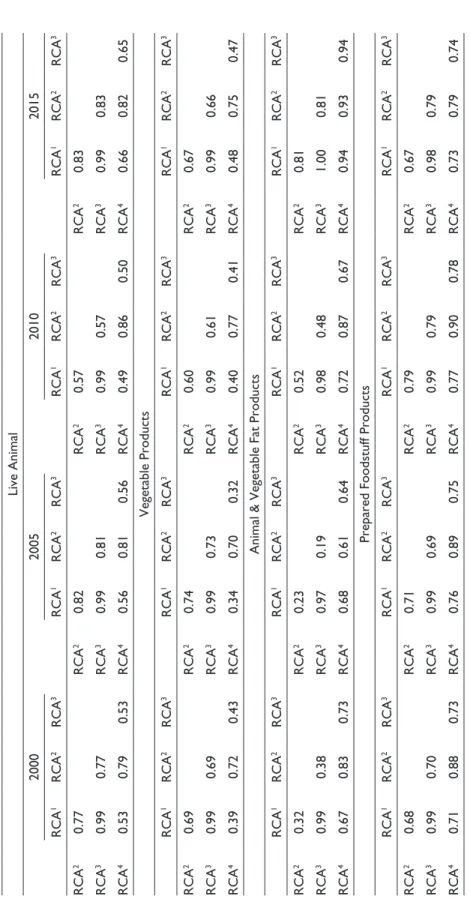
b. Ordinality Test: Ordinal test is based on rank correlation coefficient between each paring of four indices. Table 4 presents the results of ordinality test for four product groups which shows that: (a) for live animal products 14 out of 24 parings found a high correlation (> 0.70), which works out to 58.33 per cent (b) for vegetable products, it showed high correlation for only nine paired indices (c) animal or vegetable fat products, 13 out of 24 parings, or 54.17 per cent, showed a high level of correlation and (d) for prepared foodstuff products, 21 out of 24 parings, or 87.5 per cent, had a high level of correlation. These results support the ordinal interpretation of RCA index and shows that products may rank on the basis of comparative advantage. This result also supports the study done by Andhale and Kannan (2015).
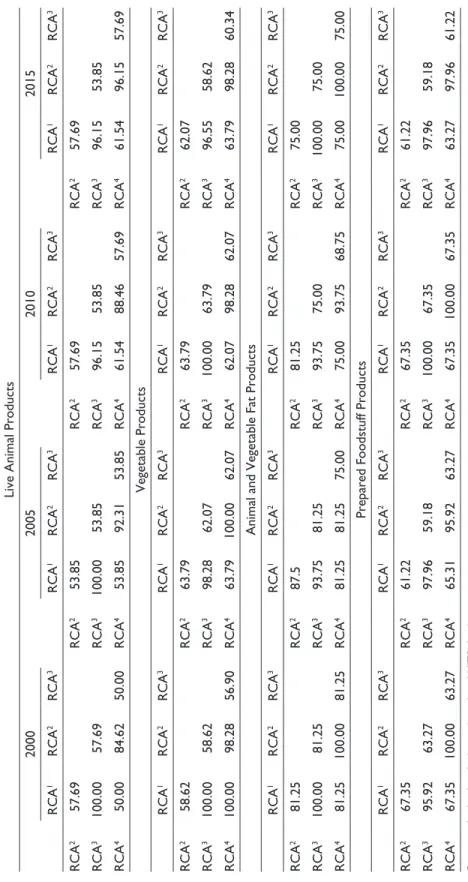
c. Dichotomous Test: This test is based on the share of product groups in which both of the paired indices show comparative advantage or dis-advantage. Table 5 presents the result of the dichotomous test, which showed that for live animal and vegetable products, 8 and 9 out of 24 parings, or 33.33 per cent and 37.50 per cent, had a high level of correlation among the paired indices, respectively; for animal or vegetable fat products, 23 out of 24 parings, or 95.83 per cent, showed a very high level of correlation among the paired indices; and for prepared foodstuff products, 8 out of 24 parings, or 33.33 per cent, showed a
Table 3.
Cardinal Test
Live Animal Products
2000 2005 2010 2015 RCA 1 RCA 2 RCA 3 RCA 1 RCA 2 RCA 3 RCA 1 RCA 2 RCA 3 RCA 1 RCA 2 RCA 3 RCA 2 0.97 RCA 2 0.92 RCA 2 0.39 RCA 2 0.94 RCA 3 0.60 0.57 RCA 3 0.65 0.56 RCA 3 0.62 0.48 RCA 3 0.50 0.58 RCA 4 0.28 0.39 0.51 RCA 4 0.39 0.55 0.51 RCA 4 0.15 0.63 0.49 RCA 4 0.09 0.31 0.62 Vegetable Products RCA 1 RCA 2 RCA 3 RCA 1 RCA 2 RCA 3 RCA 1 RCA 2 RCA 3 RCA 1 RCA 2 RCA 3 RCA 2 0.67 RCA 2 0.51 RCA 2 0.43 RCA 2 0.66 RCA 3 0.68 0.49 RCA 3 0.73 0.37 RCA 3 0.76 0.26 RCA 3 0.69 0.36 RCA 4 0.18 0.50 0.47 RCA 4 0.18 0.54 0.31 RCA 4 0.35 0.58 0.45 RCA 4 0.37 0.58 0.52
Animal or Vegetable Fat Products
RCA 1 RCA 2 RCA 3 RCA 1 RCA 2 RCA 3 RCA 1 RCA 2 RCA 3 RCA 1 RCA 2 RCA 3 RCA 2 0.44 RCA 2 0.58 RCA 2 0.66 RCA 2 0.55 RCA 3 0.59 0.61 RCA 3 0.64 0.44 RCA 3 0.61 0.64 RCA 3 0.61 0.75 RCA 4 0.39 0.81 0.76 RCA 4 0.64 0.76 0.74 RCA 4 0.49 0.83 0.79 RCA 4 0.52 0.87 0.92
Prepared Foodstuff Products
RCA 1 RCA 2 RCA 3 RCA 1 RCA 2 RCA 3 RCA 1 RCA 2 RCA 3 RCA 1 RCA 2 RCA 3 RCA 2 0.96 RCA 2 0.99 RCA 2 0.99 RCA 2 0.13 RCA 3 0.53 0.52 RCA 3 0.48 0.48 RCA 3 0.52 0.59 RCA 3 0.70 0.38 RCA 4 0.49 0.58 0.74 RCA 4 0.36 0.40 0.78 RCA 4 0.28 0.39 0.80 RCA 4 0.52 0.46 0.74 Source:
Table 4. Ordinal Test Live Animal 2000 2005 2010 2015 RCA 1 RCA 2 RCA 3 RCA 1 RCA 2 RCA 3 RCA 1 RCA 2 RCA 3 RCA 1 RCA 2 RCA 3 RCA 2 0.77 RCA 2 0.82 RCA 2 0.57 RCA 2 0.83 RCA 3 0.99 0.77 RCA 3 0.99 0.81 RCA 3 0.99 0.57 RCA 3 0.99 0.83 RCA 4 0.53 0.79 0.53 RCA 4 0.56 0.81 0.56 RCA 4 0.49 0.86 0.50 RCA 4 0.66 0.82 0.65 Vegetable Products RCA 1 RCA 2 RCA 3 RCA 1 RCA 2 RCA 3 RCA 1 RCA 2 RCA 3 RCA 1 RCA 2 RCA 3 RCA 2 0.69 RCA 2 0.74 RCA 2 0.60 RCA 2 0.67 RCA 3 0.99 0.69 RCA 3 0.99 0.73 RCA 3 0.99 0.61 RCA 3 0.99 0.66 RCA 4 0.39 0.72 0.43 RCA 4 0.34 0.70 0.32 RCA 4 0.40 0.77 0.41 RCA 4 0.48 0.75 0.47
Animal & Vegetable Fat Products
RCA 1 RCA 2 RCA 3 RCA 1 RCA 2 RCA 3 RCA 1 RCA 2 RCA 3 RCA 1 RCA 2 RCA 3 RCA 2 0.32 RCA 2 0.23 RCA 2 0.52 RCA 2 0.81 RCA 3 0.99 0.38 RCA 3 0.97 0.19 RCA 3 0.98 0.48 RCA 3 1.00 0.81 RCA 4 0.67 0.83 0.73 RCA 4 0.68 0.61 0.64 RCA 4 0.72 0.87 0.67 RCA 4 0.94 0.93 0.94
Prepared Foodstuff Products
RCA 1 RCA 2 RCA 3 RCA 1 RCA 2 RCA 3 RCA 1 RCA 2 RCA 3 RCA 1 RCA 2 RCA 3 RCA 2 0.68 RCA 2 0.71 RCA 2 0.79 RCA 2 0.67 RCA 3 0.99 0.70 RCA 3 0.99 0.69 RCA 3 0.99 0.79 RCA 3 0.98 0.79 RCA 4 0.71 0.88 0.73 RCA 4 0.76 0.89 0.75 RCA 4 0.77 0.90 0.78 RCA 4 0.73 0.79 0.74 Source:
Table 5.
Dichotomous Test—Share of (per cent) Matching Indices
Live Animal Products
2000 2005 2010 2015 RCA 1 RCA 2 RCA 3 RCA 1 RCA 2 RCA 3 RCA 1 RCA 2 RCA 3 RCA 1 RCA 2 RCA 3 RCA 2 57.69 RCA 2 53.85 RCA 2 57.69 RCA 2 57.69 RCA 3 100.00 57.69 RCA 3 100.00 53.85 RCA 3 96.15 53.85 RCA 3 96.15 53.85 RCA 4 50.00 84.62 50.00 RCA 4 53.85 92.31 53.85 RCA 4 61.54 88.46 57.69 RCA 4 61.54 96.15 57.69 Vegetable Products RCA 1 RCA 2 RCA 3 RCA 1 RCA 2 RCA 3 RCA 1 RCA 2 RCA 3 RCA 1 RCA 2 RCA 3 RCA 2 58.62 RCA 2 63.79 RCA 2 63.79 RCA 2 62.07 RCA 3 100.00 58.62 RCA 3 98.28 62.07 RCA 3 100.00 63.79 RCA 3 96.55 58.62 RCA 4 100.00 98.28 56.90 RCA 4 63.79 100.00 62.07 RCA 4 62.07 98.28 62.07 RCA 4 63.79 98.28 60.34
Animal and Vegetable Fat Products
RCA 1 RCA 2 RCA 3 RCA 1 RCA 2 RCA 3 RCA 1 RCA 2 RCA 3 RCA 1 RCA 2 RCA 3 RCA 2 81.25 RCA 2 87.5 RCA 2 81.25 RCA 2 75.00 RCA 3 100.00 81.25 RCA 3 93.75 81.25 RCA 3 93.75 75.00 RCA 3 100.00 75.00 RCA 4 81.25 100.00 81.25 RCA 4 81.25 81.25 75.00 RCA 4 75.00 93.75 68.75 RCA 4 75.00 100.00 75.00
Prepared Foodstuff Products
RCA 1 RCA 2 RCA 3 RCA 1 RCA 2 RCA 3 RCA 1 RCA 2 RCA 3 RCA 1 RCA 2 RCA 3 RCA 2 67.35 RCA 2 61.22 RCA 2 67.35 RCA 2 61.22 RCA 3 95.92 63.27 RCA 3 97.96 59.18 RCA 3 100.00 67.35 RCA 3 97.96 59.18 RCA 4 67.35 100.00 63.27 RCA 4 65.31 95.92 63.27 RCA 4 67.35 100.00 67.35 RCA 4 63.27 97.96 61.22 Source:
Jagdambe 25
high level of correlation among the paired indices. Overall, only animal or vegetable fat products showed a very high correlation and consistency according to the dichotomous test measure.
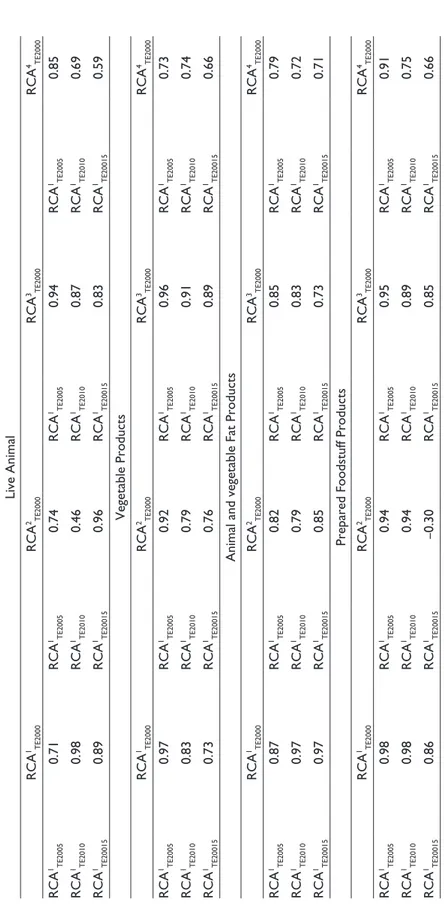
3. Stability of RCA
To check the stability of RCA indices we applied two indicators. One is the coefficient of variation (CV) and another one is the correlation between the index in a time period and the index in subsequent time periods. The coef-ficient of variation is shown in Table A1 in appendix. The results showed that for vegetable and animal or vegetable fat products, the RCA indices were fairly stable over the study years. For live animal products, the CV has increased. In contrast, for prepared foodstuff products, it has declined over the years.
The results of correlation coefficient between the index time period and the index in subsequent time periods are shown in Table 6. Using 2000 as base year, the correlation coefficient for four indices for the agriculture sector during 2000–2015 is quite high; for 42 out of 48 (12 indices × 4 years), the coefficients are greater than cut-off point (0.70). It is clear that the paired indices of RCA show a high degree of stability during the study period.
Summary and Conclusion
The article estimated the RCA index for India’s agricultural sector with respect to the world. The study used four alternative indices of RCA. It found that India has comparative advantage in export of 7 out of 26 live animal products and 21 out of 58 vegetable products. In animal or vegetable fat and prepared foodstuff products India has comparative advantage in only 2 out of 16 and 9 out of 49 products. In addition, India was losing its comparative advantage in world markets for vegetable products, animal or vegetable fat products and prepared foodstuff products during the study period. Multiple factors are contributing to the declining export of agricul-tural products and these include poor quality in terms of international norms and lack of infrastructure in labelling, packaging, marketing, storage facility, etc.
The study has conducted three alternative consistency tests for the four RCA indices. The results showed that the four indices are less consistent as cardinal and dichotomous measures but relatively consistent as ordinal measures. Overall, the ordinal measures are relatively more consistent than the other two consistency tests, at around 59.38 per cent, with the indices at greater than cut-off point (> 0.70).
Finally, results showed that the RCA indices are fairly stable for vegetable and animal or vegetable fat products. For live animal and prepared foodstuff products, it found that the value of RCA indices was unstable over the study period. Based on the results, study suggests that India should prepare global policy initiatives to promote products with comparative advantage in exports. The study also suggests that improving infrastructure facilities in labelling and packaging, raising the quality of exportable products, providing greater storage facilities and marketing agricultural products better in the world market will provide an advantage to the Indian agricultural sector.
Table 6. Stability Test Live Animal RCA 1 TE2000 RCA 2 TE2000 RCA 3 TE2000 RCA 4 TE2000 RCA 1 TE2005 0.71 RCA 1 TE2005 0.74 RCA 1 TE2005 0.94 RCA 1 TE2005 0.85 RCA 1 TE2010 0.98 RCA 1 TE2010 0.46 RCA 1 TE2010 0.87 RCA 1 TE2010 0.69 RCA 1 TE20015 0.89 RCA 1 TE20015 0.96 RCA 1 TE20015 0.83 RCA 1 TE20015 0.59 Vegetable Products RCA 1 TE2000 RCA 2 TE2000 RCA 3 TE2000 RCA 4 TE2000 RCA 1 TE2005 0.97 RCA 1 TE2005 0.92 RCA 1 TE2005 0.96 RCA 1 TE2005 0.73 RCA 1 TE2010 0.83 RCA 1 TE2010 0.79 RCA 1 TE2010 0.91 RCA 1 TE2010 0.74 RCA 1 TE20015 0.73 RCA 1 TE20015 0.76 RCA 1 TE20015 0.89 RCA 1 TE20015 0.66
Animal and vegetable Fat Products
RCA 1 TE2000 RCA 2 TE2000 RCA 3 TE2000 RCA 4 TE2000 RCA 1 TE2005 0.87 RCA 1 TE2005 0.82 RCA 1 TE2005 0.85 RCA 1 TE2005 0.79 RCA 1 TE2010 0.97 RCA 1 TE2010 0.79 RCA 1 TE2010 0.83 RCA 1 TE2010 0.72 RCA 1 TE20015 0.97 RCA 1 TE20015 0.85 RCA 1 TE20015 0.73 RCA 1 TE20015 0.71
Prepared Foodstuff Products
RCA 1 TE2000 RCA 2 TE2000 RCA 3 TE2000 RCA 4 TE2000 RCA 1 TE2005 0.98 RCA 1 TE2005 0.94 RCA 1 TE2005 0.95 RCA 1 TE2005 0.91 RCA 1 TE2010 0.98 RCA 1 TE2010 0.94 RCA 1 TE2010 0.89 RCA 1 TE2010 0.75 RCA 1 TE20015 0.86 RCA 1 TE20015 –0.30 RCA 1 TE20015 0.85 RCA 1 TE20015 0.66 Source:
Appendix
Table A1. Average RCA 2000 2005 2010 2015 RCA 1 >1 RCA 2 >0 RCA 3 >0 RCA 4 >0 RCA 1 >1 RCA 2 >0 RCA 3 >0 RCA 4 >0 RCA 1 >1 RCA 2 >0 RCA 3 >0 RCA 4 >0 RCA 1 >1 RCA 2 >0 RCA 3 >0 RCA 4 >0 Live Animal RCA 1.86 1.52 –2.06 2.66 1.63 1.22 –1.53 2.20 1.56 0.66 –1.65 1.47 1.77 0.96 –2.04 1.23 C.V 2.11 2.66 –1.46 1.24 1.82 2.69 –1.66 1.13 1.95 3.15 –1.50 1.75 2.90 2.71 –1.42 2.35 Vegetable Products RCA 3.41 1.50 –1.27 1.52 2.93 0.92 –0.77 1.64 2.50 0.29 –0.75 1.11 2.23 0.60 –0.88 0.98 C.V 1.90 4.24 –2.23 1.91 1.65 6.32 –3.01 1.72 1.48 22.40 –3.00 2.54 1.65 8.15 –2.60 2.90Animal or Vegetable Fat Products
RCA 0.87 –3.75 –2.81 –2.32 1.05 –2.08 –2.12 –1.27 0.88 –1.51 –2.49 –1.53 0.75 –1.91 –2.74 –2.21 C.V 2.89 –2.16 –0.91 –1.67 2.06 –2.65 –1.00 –2.25 2.42 –2.92 –0.97 –2.39 2.40 –2.63 –0.95 –1.77
Prepared Foodstuff Products
RCA 1.05 0.75 –2.72 0.82 1.34 0.97 –2.17 0.67 1.52 1.00 –1.87 0.67 0.63 0.24 –1.98 0.65 C.V 3.15 4.70 –0.90 4.10 3.89 5.08 –1.05 4.14 3.34 3.21 –1.21 4.00 1.69 4.09 –0.99 3.81 Source:
28 Foreign Trade Review 54(1) Declaration of Conflicting Interests
The author declared no potential conflicts of interest with respect to the research, authorship and/or publication of this article.
Funding
The author received no financial support for the research, authorship and/or publication of this article.
Notes
1. https://wits.worldbank.org/WITS/WITS/Restricted/Login.aspx 2. The study uses the HS classification for grouping of products. 3. For details, see Batra and Khan (2005), Vollrath (1991).
4. For details, see Balance (1987) and Andhale and Kannan (2015).
5. The RCA indices at four-digit level are available on request from the author.
References
Andhale, A., & Kannan, E. (2015). Analysis of India’s revealed comparative advantage in
agro-processed products.Indian Journal of Economics & Business, 14(1), 115–130.
Andrew, M. (1996). Some implication of AFTA for Thailand: A revealed comparative
advantage approach.ASEAN Economic Bulletin, 13(1), 14–38.
Balassa, B. (1965). Trade liberalization and revealed comparative advantage. Manchester
School of Economics and Social Studies, 33, 99–123.
Balance, R., Forstner, H., & Murray, T. (1987). Consistency test of alternative measure of
comparative advantage.Review of Economics and Statistics, 69(1), 157–161.
Batra, A. & Khan, Z. (2005). Revealed comparative advantage: An analysis for India and
China (ICRIER Working paper No. 168, 01–53). New Delhi: ICRIER.
Ferto, I., & Hubbard, J. (2002). Revealed comparative advantage and competitiveness
in Hungarian agro-food sectors (Discussion Paper New Series, 2002/8). Budapest: Institute of Economics, Hungarian Academy of Sciences.
GOI. (2011). Census of India, 2011. New Delhi: Census Commissioner and Registrar
General of India.
———. (2013). Agriculture statistics at a glance. New Delhi: Directorate of Economics
and Statistics, Ministry of Agriculture and Cooperation.
Oduro, A. D., & Offei, E. L. (2014). Investigating Ghana’s revealed comparative advantage
in agro-processed products. Modern Economy, 5, 384–390. Retrieved from http://
dx.doi.org/10.4236/me.2014.54037
Ricardo, D. (1817). On the principles of political economy and taxation. John Murrary,
Albemarle-Street, London, UK.
Sanidas, E., & Shin, Y. (2011). Convergence towards the revealed comparative advantage neutral point for East Asia: Similarities and differences between the three countries.
Seoul Journal of Economics, 24, 21–50.
Ufuk, B. (2011). Consistency of the proposed additive measures of revealed comparative
advantage. Economic Bulletin, 31(3), 2491–2499.
Vollrath, T. (1991). A theoretical evaluation of alternative trade intensity measures of
revealed comparative advantage.Review of World Economies, 127, 265–280.
Yeats, A. J. (1985). On the appropriate interpretation of the revealed comparative advantage
index: Implications of a methodology based on industry sector analysis.