Using Predictive Maintenance to Approach
Zero Downtime
4 Optimizing Machine Maintenance
4 Reactive Versus Predictive Maintenance
5 Predictive Modeling
6 Predictive Maintenance Use Cases
6 Transportation
6 Manufacturing and Production
7 Utilities
8 Medical Equipment
8 Data Centers and Clouds
9 Enabling Predictive Maintenance
9 SAP Predictive Analytics
With the Internet of Things, machine-to-machine
communication, and connected systems, large volumes of
high-velocity data streams are now available that capture
the behavior of machines in real time. Companies can
employ powerful new predictive analytics to perform
modeling that enables predictive maintenance for these
assets, with the goal of achieving zero downtime.
REACTIVE VERSUS PREDICTIVE MAINTENANCE
Until now, machine maintenance has been either reactive (performed when failure occurs) or based on some heuristic (such as servicing the machine every “n” hours of continuous operation). Parts that fail earlier than expected can be very expen-sive and time consuming for businesses, because the necessary tools, components, and people may not be available for immediate response – result-ing in machine downtime. But since such incidents are sporadic, it is not economically feasible for a company to stock all parts and tools and employ resources just to have them at the ready; this results in unnecessary costs. To counter this prob-lem, companies perform scheduled maintenance using either statistical concepts like mean time to failure or other engineering practices based on historical experiences. However, this approach has its own challenge: parts can be replaced or serviced too frequently, which drives up costs unnecessarily. There are also instances where machines fail before the scheduled planned maintenance due to other reasons.
With recent advances in the Internet of Things, machine-to-machine communication, and con-nected systems, it is possible to stream sensor readings from machines so their health can be monitored in real time. Due to the high velocity and volume of data being streamed, it is not humanly possible to check all sensor values. But advances in predictive analytics have made it possible to evaluate the changes in the patterns of the sensor readings and identify the chances of machine failure significantly in advance of the event. It is also possible to identify the probability of other parts failing in due course by analyzing the historical patterns of failures, so that preven-tive maintenance can be planned. Capturing the changes in patterns in the sensor feeds in real time, and using that information to predict a pos-sible failure and schedule a proactive mainte-nance strategy, is called predictive maintemainte-nance.
Optimizing Machine Maintenance
With the Internet of Things, machine-to-machine
communication, and connected systems, sensor
readings from machines can be streamed so their
health can be monitored in real time.
cost functions are, classifiers or models might completely ignore the rare event. Therefore, special attention should be given to the choice of performance metric being used in general and, more important, for cases with unbalanced classes (where one class of responses is dispro-portionately larger than the opposite class). In addition to this, there are several other com-plexities: not all parts of a machine fail with the same frequency, the type of failure can vary, and more. Because sensor data is streamed in real time, it can have missing values or garbage values as well. The frequency at which each sensor transmits data can also vary. Hence data preparation and modeling techniques are needed to help prepare the data and build predictive models to address the nature of the problem and capture the necessary information to effectively predict the failure or breakdown of the machine.
PREDICTIVE MODELING
Modeling for accurately predicting the probability of occurrences of rare events like machine fail-ures – events that occur very infrequently and are very hard to detect – requires robust algo-rithms. Rare though they are, these events are normally associated with very high costs, so efforts to predict them are necessary. There are two related aspects that make building models for predicting rare events especially difficult. First, due to the very fact that they are rare, the training data does not contain many examples of these events. Given that such events are often complex (for example, the sensor readings at the time of failure may not point to the cause of fail-ure, since the failure could have been the result of a buildup of several other events already reported as past sensor readings), it is often not easy to generalize from the few available examples. Second, depending on how predictive algorithms are configured and what underlying
Accurately predicting the probability of
occurrences of rare events like machine failures
requires robust algorithms.
Predictive Maintenance Use Cases
•For fleet owners and public transport depart-ments, it is important to have their vehicles running all the time. Predictive analytics on real-time sensor data streams combined with fleet management systems will make it possible to plan predictive maintenance for fleet vehicles while they are on the road. This will help ensure that the vehicles are maintained at whatever location they are in, avoiding significant down-time and financial losses due to breakdown.
MANUFACTURING AND PRODUCTION
In manufacturing and production industries employing massive automatic machines, the health of the machines has a significant impact on the quality of the products produced. In addi-tion, any machine downtime can lead to a delay in the production cycle and create a significant bottleneck in the entire production flow, resulting in heavy costs. The profit margins of a company can also be severely dented when machine fail-ures result in substantial downtime.
Technological advances have made it possible to collect huge volumes of sensor data and evaluate it to identify anomalies in the readings. For example:
•Predictive modeling techniques can be employed to predict the failure of a part far ahead in time and proactively replace the parts at the most convenient time in the production schedule to avoid any downtime.
•Predictive modeling can be used to identify the spare parts and the required tools that need to be stocked for minimizing downtime in manufacturing.
TRANSPORTATION
The cost for maintaining an aging fleet of com-mercial, private, or military vehicles is high, but so is the cost of repairing relatively new vehicles when they break down. There is a great benefit in both cases to reducing the probability of a failure by performing preventive repairs and extending the useful life of the vehicle. Telemetric data coupled with predictive techniques makes this possible today. Telemetric data from thousands of sensors captures the real-time status of the various parts of a vehicle, which can be analyzed for actionable insights to improve the vehicle’s safety and performance. For example:
•Vehicle manufacturers can use predictive ana-lytics on sensor data to find the key factors that influence the fuel efficiency and performance of their vehicles and thus improve the engineering design.
•Vehicle manufacturers can use sensor data in combination with geolocation to understand the patterns of vehicle failure in different regions and then strategize what services to focus on in each region, and what spares to stock up on to give their customers the best service. Geolocation can be used to indicate to a connected car driver that there are likely potential problems with the car and it should be serviced at the nearest station.
•Vehicle sellers can analyze sensor data to predict the probability of a breakdown far ahead in time and proactively reach out to their cus-tomers to perform maintenance – keeping the vehicles running and customer satisfaction high.
UTILITIES
Power company operators and distributors face significant problems due to transmission losses, meters that have been tampered with, and spikes in demand. The distribution network is spread across large regions, and the network, genera-tors, transformers, turbines, and smart meters are monitored for malfunctions. Any breakdown could result in significant revenue loss for an entire industrial sector or government. Similarly, with the significant advances in instrumentation technology, oil fields, rigs, and refineries have now become more digital. Data generated by thousands of sensors monitoring the functioning of various parts of the oilfield is streamed in real time to a centralized location. Predicting the pos-sibility of a malfunction of any piece of equip-ment is critical so that corrective action can be taken before a disaster occurs. Predictive model-ing can be employed on data that is captured in real time from the sensors connected to the distribution network, for predictive maintenance.
•During the phases of production, there are often several paths that the product goes through before it is defined as scrap. Predictive modeling can help identify the sequence of paths that result in a high probability of a part being scrapped, and bring this to light far ahead in the production cycle, resulting in significant savings.
•Testing various mechanical parts during pro-duction is critical to ensure that the machines built with them are of the best quality and have optimal performance. For example, engines built for airplanes must be tested rigorously before they can be used. During production of these engines, sensors mounted into them help monitor their hundreds of components and capture the interactions of various engine parts. Predictive modeling can be employed to identify patterns that would result in an engine failure during the production phase itself, thus allowing necessary changes to be made.
In manufacturing, any machine downtime
can delay the production cycle and create a
significant bottleneck in the entire production
flow, resulting in heavy costs.
DATA CENTERS AND CLOUDS
Data volumes are growing rapidly, and organiza-tions want to store all this data to mine informa-tion for any number of use cases in addiinforma-tion to predictive maintenance. This data is business critical and is typically stored on an elastic infra-structure in data centers. Many organizations are also now moving to the cloud because it is easy to make new services available to their clients, who benefit from the pay-per-use model. It is essential to have the data centers and cloud infrastructure up and running all the time. Unstructured data in the form of logs containing the status of various services running on the infrastructure, available in real time, can be mined for predicting the failure of various ser-vices and performing preventive maintenance to achieve zero downtime.
For example:
•Predictive maintenance on assets such as gas pipes and electrical cables used across the grid can be an efficient and effective way to keep costs down, risks low, and availability high.
•Predictive modeling can be used to identify the probability of smart meters being tampered with and to plan preventive checks and mainte-nance of those meters.
•Sensor data from smart grids can be used for optimizing the grid and for identifying potential failures in the distribution network and schedul-ing planned preventive maintenance to help ensure zero downtime.
MEDICAL EQUIPMENT
The breakdown or malfunction of certain diag-nostic and lifesaving or life-support equipment in medical and pathology labs can be catastrophic. Sensors within certain types of equipment are used to record human body responses to diag-nose critical illness so that appropriate care and medication can be administered. It is therefore critical to monitor this equipment in real time to predict the probability of malfunction or break-down and schedule preventive maintenance.
The data manager component in SAP Predictive Analytics enables the user to create ultrawide analytical data sets for a time-stamped popula-tion, and automatically extract thousands of derived features that can be used for creating robust models.
If the event describes whether the machine has failed or not, then the automated classification component in SAP Predictive Analytics can be used to identify the chances of machine failure based on the ultrawide data set generated by the data manager. On the other hand, if the event is recorded as a continuous number, then the auto-mated regression component in SAP Predictive Analytics can be used to identify the relationship of the sensor with the target. The classification and regression algorithms can identify the key influencers that have the most information to explain the behavior of the event that is being modeled. They also identify the positive, negative, and neutral impact of the range of values of each sensor involved in the event, enabling the user to have an in-depth understanding of the causes leading to the modeled event.
SAP® PREDICTIVE ANALYTICS
SAP® Predictive Analytics software has capabili-ties that make it a product of choice for building robust models for predicting rare events in the use cases just described.
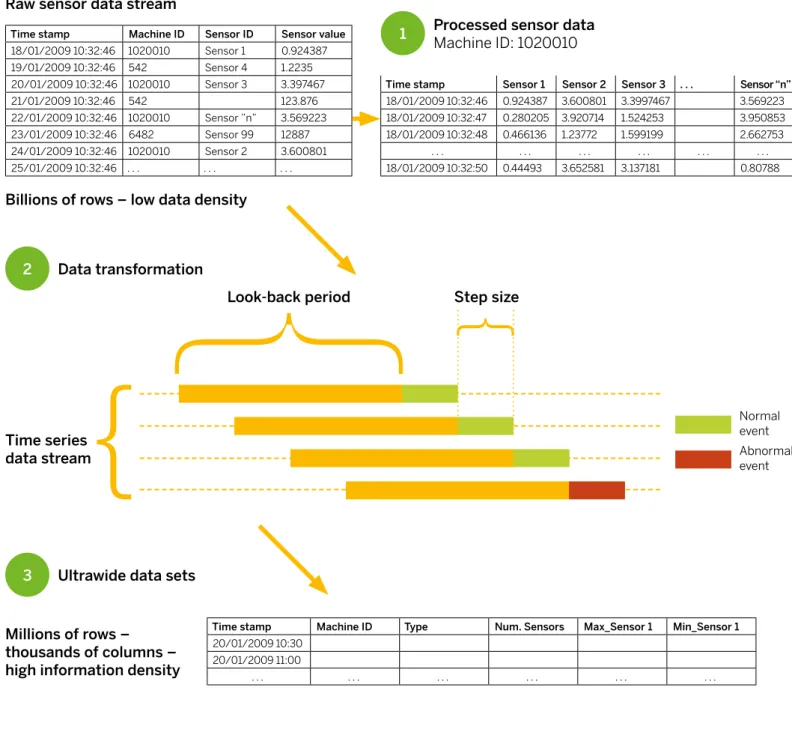
Predictive maintenance data is time series data derived from the readings from thousands of sensors streamed at high velocity at real time. Sensor readings reflect the state of the machine performance at that time. So the time series data must be transformed into a time-stamped popu-lation, and new derived features must be defined to find out what changes in the sensor readings over a period of time provide maximum informa-tion about the probability of failure of a machine. One of the several ways of modeling data is shown in Figure 1. Various statistical signatures of each sensor are captured for a specific look-back period and associated with a segment of data from the end of that period, to capture infor-mation of an event (such as machine failure) during that segment to use in building predictive models. Several such patterns can be generated at a step size equal to the forward segment size. The forward segment size defines the duration of the validity of the forward prediction – that is, if the segment size is 10 minutes, then the model built will be able to give the probability of an event occurring in the next 10 minutes.
Time stamp Machine ID Sensor ID Sensor value
18/01/2009 10:32:46 1020010 Sensor 1 0.924387 19/01/2009 10:32:46 542 Sensor 4 1.2235 20/01/2009 10:32:46 1020010 Sensor 3 3.397467 21/01/2009 10:32:46 542 123.876 22/01/2009 10:32:46 1020010 Sensor ”n” 3.569223 23/01/2009 10:32:46 6482 Sensor 99 12887 24/01/2009 10:32:46 1020010 Sensor 2 3.600801 25/01/2009 10:32:46 . . . .
Time stamp Sensor 1 Sensor 2 Sensor 3 . . . Sensor “n”
18/01/2009 10:32:46 0.924387 3.600801 3.3997467 3.569223 18/01/2009 10:32:47 0.280205 3.920714 1.524253 3.950853 18/01/2009 10:32:48 0.466136 1.23772 1.599199 2.662753
. . . . 18/01/2009 10:32:50 0.44493 3.652581 3.137181 0.80788
Time stamp Machine ID Type Num. Sensors Max_Sensor 1 Min_Sensor 1
20/01/2009 10:30 Raw sensor data stream
Billions of rows – low data density
1 Processed sensor dataMachine ID: 1020010
2 Data transformation
Time series data stream
Look-back period Step size
Normal event Abnormal event
3 Ultrawide data sets
Millions of rows – thousands of columns –
The automated clustering component enables the user to find robust numbers of clusters in the data and can be used for problems like grouping machines behaving in a similar fashion and sub-sequent anomalies in the sensor data.
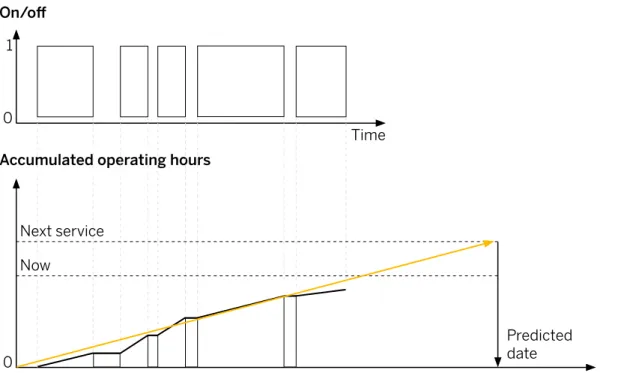
The automated time series in conjunction with an automated regression algorithm helps in prob-lems related to forecasting, such as the remain-ing time before the machine or its parts break down – in other words, the time to next mainte-nance. This is shown in Figure 2.
Figure 2: Time to Next Maintenance
0 1 On/off
Time
0
Accumulated operating hours
Predicted date Now
The models can be easily integrated into busi-ness processes and can be scheduled for auto-matic retraining if there is significant deviation in the data or in the model’s performance. The vast majority of predictive maintenance use cases can be handled with an automated approach, and the software can be easily used by a person with very little or no data science expertise. For the most complex problems, the expert analytics option in SAP Predictive Analytics provides a workbench where the automated algorithms can be com-bined with other prebuilt algorithms and with custom algorithms written using the R program-ming language.
All the automated components build several models internally and choose the most robust models based on their predictive power and predictive confidence. Predictive confidence cor-responds to the proportion of information con-tained in the target variable that the explanatory variables are able to explain – in other words, the ability of the model to explain the target. Predic-tive power is the capacity of the model to achieve the same performance when it is applied to a new data set exhibiting the same characteristics as the training data set. This is the generalization ability or robustness of the model.
LEARN MORE
SAP® Predictive Analytics software is a powerful solution designed to address several predictive modeling use cases involving high-velocity data streams that capture machine behavior in real time. To find out more about how this soft-ware can help your company use predictive maintenance to achieve zero downtime, please contact your SAP representa-tive or visit www.sap.com/predictive.
countries. Please see http://www.sap.com/corporate-en/legal/copyright/index.epx#trademark for additional trademark information and notices. Some software products marketed by SAP SE and its distributors contain proprietary software components of other software vendors.
National product specifi cations may vary.
These materials are provided by SAP SE or an SAP affi liate company for informational purposes only, without representation or warranty of any kind, and SAP SE or its affi liated companies shall not be liable for errors or omissions with respect to the materials. The only warranties for SAP SE or SAP affi liate company products and services are those that are set forth in the express warranty statements accompanying such products and services, if any. Nothing herein should be construed as constituting an additional warranty. In particular, SAP SE or its affi liated companies have no obligation to pursue any course of business
outlined in this document or any related presentation, or to develop or release any functionality mentioned therein. This document, or any related presentation, and SAP SE’s or its affi liated companies’ strategy and possible future developments, products, and/or platform directions and functionality are all subject to change and may be changed by SAP SE or its affi liated companies at any time for any reason without notice. The information in this document is not a commitment, promise, or legal obligation to deliver any material, code, or functionality. All forward-looking statements are subject to various risks and
uncertainties that could cause actual results to diff er materially from expectations. Readers are cautioned not to place undue reliance on these forward-looking statements, which speak only as of their dates, and they should not be relied upon in making purchasing decisions.