Summary
In 2013, the HSE Areas provided HPSC with quarterly immunisation uptake data for their Area and for each of the Local Health Offices (LHOs) in their Area. HPSC collated these data and quarterly reports were produced which are available on the HPSC website. The annual immunisation uptake rates presented here represent the collation of the 2013 quarterly data. The proportion of children who completed the
recommended childhood immunisation schedule by 12 months (born between 01/01/2012 and 31/12/2012) and 24 months (born between 01/01/2011 and 31/12/2011) of age in 2013 are reported.
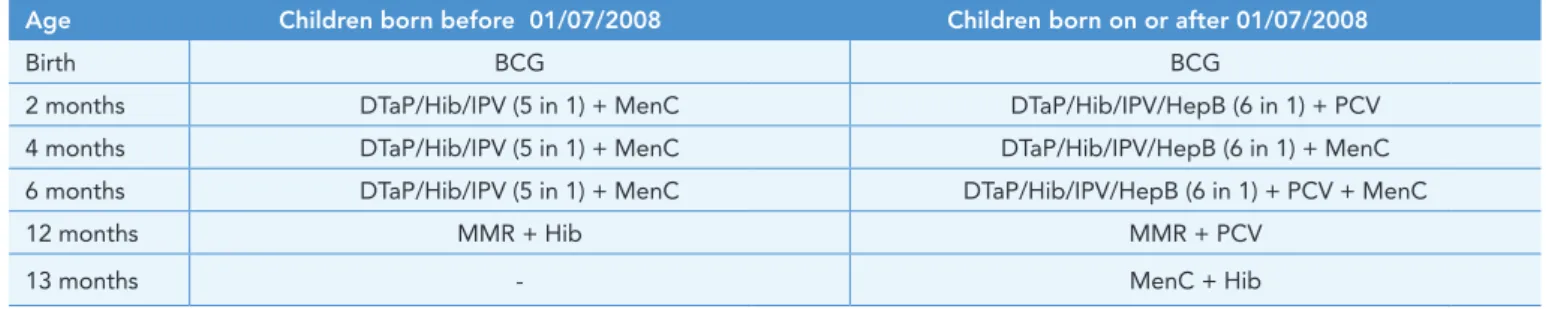
Since September 1st 2008 the new primary childhood immunisation schedule has been implemented for children born on or after July 1st 2008 (table 1). These children should receive one dose of vaccine against tuberculosis (BCG vaccine) at birth or by one month of age; three doses of vaccines against diphtheria (D3), tetanus (T3), pertussis (P3), Haemophilus influenzae type b (Hib3), polio (Polio3) and Hepatitis B (HepB3) with one dose of each given at two, four and six months of age; three doses of pneumococcal conjugate vaccine (PCV3) given at two, six and 12 months of age and three doses of meningococcal group C (MenC3) vaccine given at four, six and 13 months of age. Also at 12 months of age a dose of MMR (MMR1) is recommended and at 13 months a dose of Hib (Hibb) is recommended. Further vaccinations are recommended for older children and adults; please see www.immunisation.ie for complete information on the Irish immunisation schedule.
In children who reached 12 months of age in 2013 (born between 01/01/2012 and 31/12/2012) uptake of BCG, D3, T3, P3, Hib3, Polio3, HepB3 and two doses of PCV (PCV2) and MenC (MenC2) were measured. In children who reached 24 months of age in 2013 (born between
8.1 Immunisation uptake at 12 and 24
months of age
Summary
Among children 12 months of age in 2013 uptake of: D3,T3,P3, Hib3, Polio3,HepB3, MenC2 and PCV2 were 91%
Among children 24 months of age in 2013 uptake of: D3, T3, P3, Hib3, Polio3 and HepB3 reached or
exceeded the target of 95% D3, T3, P3 and Polio3 were 96% Hib3 and HepB3 were 95% MMR1 was 93%
PCV3 was 91% Hibb was 90% MenC3 was 87%
The childhood immunisation schedule is shown in table 1. Five GP visits are required to ensure children receive all their recommended doses of vaccine.
Table 1.Change in primary childhood immunisation schedule (introduced on September 1st 2008)
Age Children born before 01/07/2008 Children born on or after 01/07/2008
Birth BCG BCG
2 months DTaP/Hib/IPV (5 in 1) + MenC DTaP/Hib/IPV/HepB (6 in 1) + PCV 4 months DTaP/Hib/IPV (5 in 1) + MenC DTaP/Hib/IPV/HepB (6 in 1) + MenC 6 months DTaP/Hib/IPV (5 in 1) + MenC DTaP/Hib/IPV/HepB (6 in 1) + PCV + MenC
12 months MMR + Hib MMR + PCV
13 months - MenC + Hib
Please see www.immunisation.ie for complete information on the Irish childhood immunisation schedule including vaccinations for older
children and adults
BCG Bacille Calmette Guerin vaccine
DTaP Diphtheria, Tetanus and acellular Pertussis vaccine
HepB Hepatitis B vaccine
Hib Haemophilus influenzae type b vaccine
IPV Inactivated Polio Virus vaccine
MenC Meningococcal group C vaccine
MMR Measles, Mumps and Rubella vaccine
01/01/2011 and 31/12/2011) uptake of D3, T3, P3, Hib3, Polio3, HepB3, MenC3, PCV3, MMR1, Hibb, one dose of vaccine against meningococcal group C (MenCb) on or after twelve months of age and one dose of vaccine against pneumococcal conjugate vaccine (PCVb) on or after twelve months of age were measured.
The immunisation uptake rates are reported here by HSE Area and LHO. While there are 32 LHOs the immunisation uptake rates for the LHOs of North Lee and South Lee are reported as a combined figure.
Caveats to data
BCG uptake data at 12 months has been incomplete since reporting to HPSC began in Quarter 3 2003. This has occurred due to differences in implementation of a neonatal BCG programme across the HSE Areas as well as difficulties in providing these data to the HPSC where the programme was implemented. Prior to the establishment of the HSE each former health board determined their own BCG vaccination policy and some areas (Western and parts of the Southern Health Boards) stopped routine neonatal BCG vaccination but provided BCG vaccination for adolescents or high risk groups. The neonatal programme has now been routinely implemented for all neonates in most, but not all, HSE areas. Additionally more complete data on neonatal BCG vaccination is now available. However, in the HSE NE, where a neonatal programme is implemented, data is not available for reporting. In the HSE W the neonatal programme is not routinely or comprehensively implemented in all LHOs. Therefore, data provided for the HSE W reflects BCG vaccination for just a small proportion of all babies born in this area.
Data for 2013 are presented in this report and compared to 2012 data. Not all HSE Areas were able to provide data during 2012 and 2013. BCG uptake data were available for the HSE M, HSE MW, HSE NW, HSE SE, HSE S and HSE W Areas in Quarters 1-4 2012 and for all Areas except the HSE NE during 2013. The available national BCG cohort data may be around 52% of the national birth cohort in 2012 and 90% in 2013 (these figures are estimates only). In the HSE W BCG data were not available by LHO.
As uptake of MenC3 and Hibb were low since Q3 2010 and as those over 12 months need only one dose of
MenC and those aged 12-23 months need only one dose of PCV, data on MenCb (one dose of MenC on or after twelve months of age) and PCVb (one dose of PCV on or after twelve months of age) were requested in 2012 for the first time. Six HSE Areas (HSE E, M, MW, NW, SE and S) were able to provide data representing approximately 81% of the national birth cohort in 2012 and 80% in 2013 (these figures are estimates only).
Immunisation uptake rates at 12 months
National immunisation uptake rates, in children 12 months of age in 2013, were 91% for D3, T3,P3, Hib3, Polio3, HepB3, MenC2 and PCV2 (table 2). Compared with 2012, the uptake rates for D3, P3, T3, Hib3, Polio3, HepB3, MenC2 and PCV2 were unchanged.
The available 2013 BCG cohort data may be around 90% (estimate only) of the national birth cohort; based on these data BCG uptake was 86%. In contrast, the available 2012 BCG cohort data may be around 52% (estimate only) of the national birth cohort; based on these data BCG uptake in 2012 was 80%.
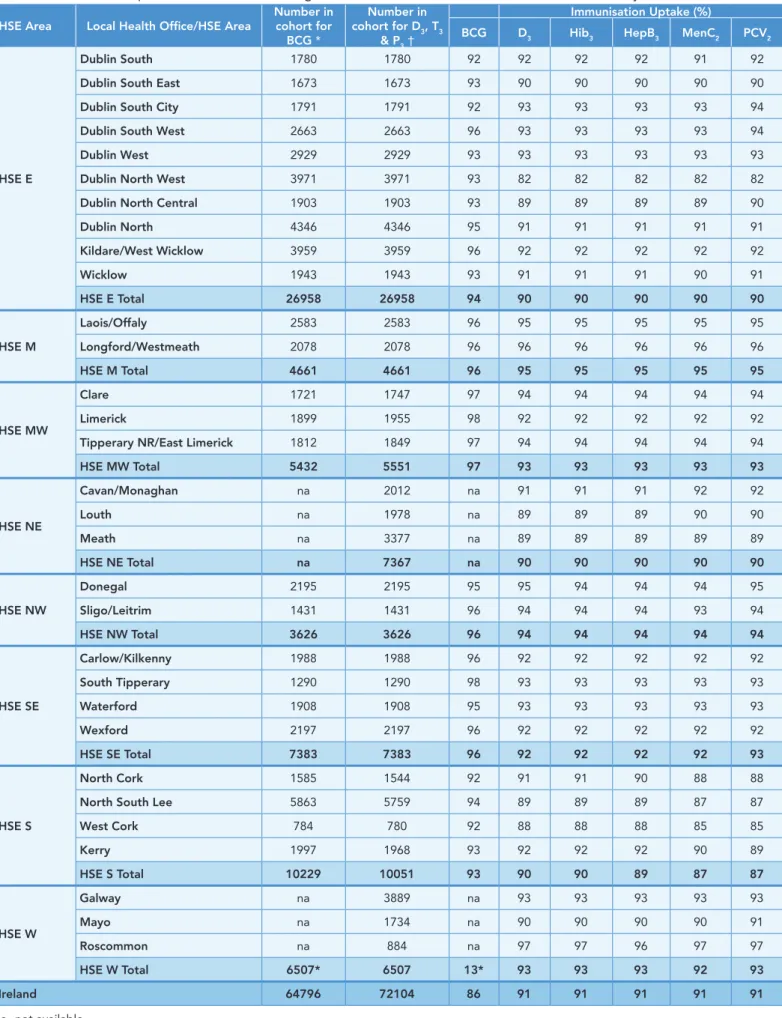
Among the HSE Areas, uptake rates for D3, T3,P3, Hib3, Polio3 and HepB3 ranged from 90% to 95% and MenC2 and PCV2 ranged from 87% to 95% (table 2). Among the LHOs, uptake rates for D3, T3, P3, Hib3, Polio3, PCV2 and MenC2 ranged from 82% to 97% and HepB3 ranged from 82% to 96% (table 3). The target uptake of 95% was reached or exceeded in Laois/Offaly, Longford/ Westmeath and Roscommon for D3, T3, P3, Hib3, Polio3, HepB3, MenC2 and PCV2 and in Donegal for D3, T3, P3, Polio3 and PCV2 (table 3). The target uptake of 95% was reached or exceeded for BCG in 14 LHOs reporting data (table 3).
Immunisation uptake rates at 24 months
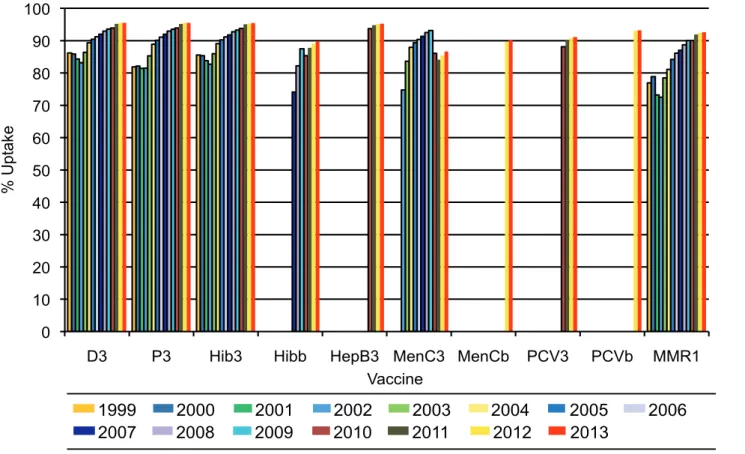
National annual immunisation uptake rates, in children 24 months of age in 2013 were 96% for D3, T3, P3 and Polio3,95% for Hib3 and HepB3, 93% for MMR1, 91% for PCV3,90% for Hibb and 87% for MenC3 (table 2). This is the third year national annual uptake rates reached the target of 95% for D3, T3, P3, Hib3, Polio3 and HepB3. Compared with 2012, the uptake rates for D3, T3, P3, Hibb, Polio3 andMMR1 increased by one percent, MenC3 increased by two percent whileHib3, HepB3 and PCV3 were unchanged(figure 1).
Table 2. Annual immunisation uptake rates (based on available data) by HSE Area for children 12 and 24 months of age in 2013 % Uptake at 12 months
Cohort born 01/01/2012 - 31/12/2012
% Uptake at 24 months Cohort born 01/01/2011 - 31/12/2011
D3 HepB3 MenC2 PCV2 BCG D3 Hib3 Hibb HepB3 MenC3 MenCb PCV3 PCVb MMR1
HSE E 90 90 90 90 94 95 95 89 95 86 89 91 93 92
HSE M 95 95 95 95 96 98 98 98 98 91 93 94 96 96
HSE MW 93 93 93 93 97 96 96 92 96 89 92 93 94 94
HSE NE 90 90 90 90 na 94 94 86 94 84 na 89 na 90
HSE NW 94 94 94 94 96 97 97 94 96 88 94 91 95 95
HSE SE 92 92 92 93 96 96 96 96 96 90 94 94 95 95
HSE S 90 89 87 87 93 96 95 83 94 84 87 90 91 92
HSE W 93 93 92 93 13 96 96 91 95 87 na 92 na 92
Ireland 91 91 91 91 86 96 95 90 95 87 90 91 93 93
Table 3. Immunisation uptake (%) at 12 months of age in 2013 (i.e. cohort born 01/01/2012-31/12/2012) by LHO and HSE Area HSE Area Local Health Office/HSE Area
Number in cohort for
BCG *
Number in cohort for D3, T3
& P3†
Immunisation Uptake (%)
BCG D3 Hib3 HepB3 MenC2 PCV2
HSE E
Dublin South 1780 1780 92 92 92 92 91 92
Dublin South East 1673 1673 93 90 90 90 90 90
Dublin South City 1791 1791 92 93 93 93 93 94
Dublin South West 2663 2663 96 93 93 93 93 94
Dublin West 2929 2929 93 93 93 93 93 93
Dublin North West 3971 3971 93 82 82 82 82 82
Dublin North Central 1903 1903 93 89 89 89 89 90
Dublin North 4346 4346 95 91 91 91 91 91
Kildare/West Wicklow 3959 3959 96 92 92 92 92 92
Wicklow 1943 1943 93 91 91 91 90 91
HSE E Total 26958 26958 94 90 90 90 90 90
HSE M
Laois/Offaly 2583 2583 96 95 95 95 95 95
Longford/Westmeath 2078 2078 96 96 96 96 96 96
HSE M Total 4661 4661 96 95 95 95 95 95
HSE MW
Clare 1721 1747 97 94 94 94 94 94
Limerick 1899 1955 98 92 92 92 92 92
Tipperary NR/East Limerick 1812 1849 97 94 94 94 94 94
HSE MW Total 5432 5551 97 93 93 93 93 93
HSE NE
Cavan/Monaghan na 2012 na 91 91 91 92 92
Louth na 1978 na 89 89 89 90 90
Meath na 3377 na 89 89 89 89 89
HSE NE Total na 7367 na 90 90 90 90 90
HSE NW
Donegal 2195 2195 95 95 94 94 94 95
Sligo/Leitrim 1431 1431 96 94 94 94 93 94
HSE NW Total 3626 3626 96 94 94 94 94 94
HSE SE
Carlow/Kilkenny 1988 1988 96 92 92 92 92 92
South Tipperary 1290 1290 98 93 93 93 93 93
Waterford 1908 1908 95 93 93 93 93 93
Wexford 2197 2197 96 92 92 92 92 92
HSE SE Total 7383 7383 96 92 92 92 92 93
HSE S
North Cork 1585 1544 92 91 91 90 88 88
North South Lee 5863 5759 94 89 89 89 87 87
West Cork 784 780 92 88 88 88 85 85
Kerry 1997 1968 93 92 92 92 90 89
HSE S Total 10229 10051 93 90 90 89 87 87
HSE W
Galway na 3889 na 93 93 93 93 93
Mayo na 1734 na 90 90 90 90 91
Roscommon na 884 na 97 97 96 97 97
HSE W Total 6507* 6507 13* 93 93 93 92 93
Ireland 64796 72104 86 91 91 91 91 91
na=not available
* HSE W BCG data were not available by LHO
†As the denominator/number in cohort varied slightly according to vaccine the most commonly used number is reported here Since T3, P3 and Polio3 uptake identical to D3 uptake only D3 uptake figures are presented
Six of the eight HSE Areas were able to provide uptake data on MenCb (one dose of MenC at ≥12 months of age) and PCVb (one dose of PCV at ≥12 months of age) in 2013. These Areas cover approximately 80% of the national birth cohort. Where data were available, national uptake was 90% for MenCb and 93% for PCVb.
Since September 1st 2008 the new primary childhood immunisation schedule has been implemented for children born on or after July 1st 2008 (table 1); children who were 24 months of age in Quarter 3 2010 were born between July 1st and September 31st 2008 and were the first children recommended the new immunisation schedule. Under the new immunisation schedule children are now recommended HepB vaccine and PCV. In addition, there is a change in timing of the MenC and Hibb vaccines (table 1). The changes to the schedule mean that three injections (6 in 1, PCV and MenC vaccines) are now recommended at six months of age and two GP visits are required on or after 12 months; the first dose of MMR and the third dose of PCV should be given at 12 months of age and at 13
months of age the third dose of MenC vaccine and Hibb should be given (table 1). MenC3 uptake was 93% in Quarter 1 2010 but declined to 80% in Quarter 3 2010 and was 82% in Quarter 4 2010 (figure 2). During 2011 and 2012, MenC3 increased from 83% in Quarters 1 and 2 2011 to 87% in Quarter 4 2012. During 2013, MenC3 uptake was 86% during Quarters 1-3 and was 88% in Quarter 4. Hibb was 87% in Quarters 1 and 2 2010 but declined to 84% in Quarters 3 and 4 2010 (figure 2). During 2011 and 2012 Hibb uptake increased from 86% in Quarter 1 2011 to 91% in Quarter 4 2012. During 2013, Hibb uptake was 89% during Quarters 1 and 2, 90% in Quarter 3 and 91% in Quarter 4. There was also low uptake of PCV3 in 2010 (combined Quarters 3 and 4 data was 88%). During 2011 and 2012, PCV3 increased from 90% during Quarters 1 and 2 2011 to 92% during Quarter 4 2012. During 2013, PCV3 uptake was 91% during Quarters 1-3 and 92% in Quarter 4.
Uptake rates among the HSE Areas, for children at 24 months of age in 2013, for D3, T3, P3, Hib3, Polio3 and HepB3 ranged from 94% to 98%, MMR1 ranged from
0 10 20 30 40 50 60 70 80 90 100
D3 P3 Hib3 Hibb HepB3 MenC3 MenCb PCV3 PCVb MMR1
% Uptake
Vaccine
1999
2000
2001
2002
2003
2004
2005
2006
2007
2008
2009
2010
2011
2012
2013
Figure 1. National annual immunisation uptake rates (based on available data) at 24 months, 1999-2013
Since T3 and Polio3 uptake identical to D3 uptake only D3 uptake figures presented.
P3 uptake could not be calculated accurately during 1999-2001 as DTaP/DT uptake was reported as a combined value for the HSE NE during 1999, Quarters 3 and
4 2000 and Quarter 1 2001 and the HSE NW in 2000 and 2001.The 2002 MenC3 figure is based on uptake rates for Quarter 3 and Quarter 4 2002 only. The 2005 MMR1 uptake figure is incomplete as the HSE E was unable to provide MMR data for Quarter 4 2005, due to technical problems with extraction of MMR1 data from
the HSE E database. The 2006 MMR1 figure includes the Quarter-1 2006 HSE E figure, which is an estimate only due to technical problems with extraction of MMR1 data from the HSE E database. The 2007 national Hibb figure is incomplete, as the HSE W data for Quarter 1 2007 and the HSE NW data for Quarter 3 2007 were
not available. The 2007 national Hibb figure also includes the HSE SE data which are an underestimate due to data extraction methods. The 2008 Hibb figure is incomplete as the HSE SE data for Q2 2008 and the HSE MW data for Quarter 3 2008 were not available. The 2008 national MenC3 figure is incomplete as the HSE E and HSE MW MenC3 data for Quarter 3 2008 were not available. The 2009 data are incomplete as the following were unavailable: the Quarter 1 2009 HSE E D3,
T3, P3 and Polio3 data for those born on the 31/03/2007; the Quarter 2 2009 HSE E Dublin North Hibb uptake data and; the Quarter 4 2009 HSE MW data, HSE E Dublin North Hibb data and HSE SE Hibb data for those given a Hib dose as part of the five in one or six in one vaccine after 12 months of age. The 2010 data are
incomplete as the following were unavailable: the Quarter 1 2010 HSE M and HSE S data and the HSE E Dublin North Hibb data; the Quarter 2 2010 HSE M data and; the Quarter 4 2010 HSE NE data. As a new childhood immunisation schedule was introduced in 2008, for those born on or after July 1st 2008, the 2010 HepB3 and PCV data at 24 months are for those born between July 1st and December 31st 2008 (i.e. Quarters 3 and 4 2010 data) only. The MenC and PCV data were
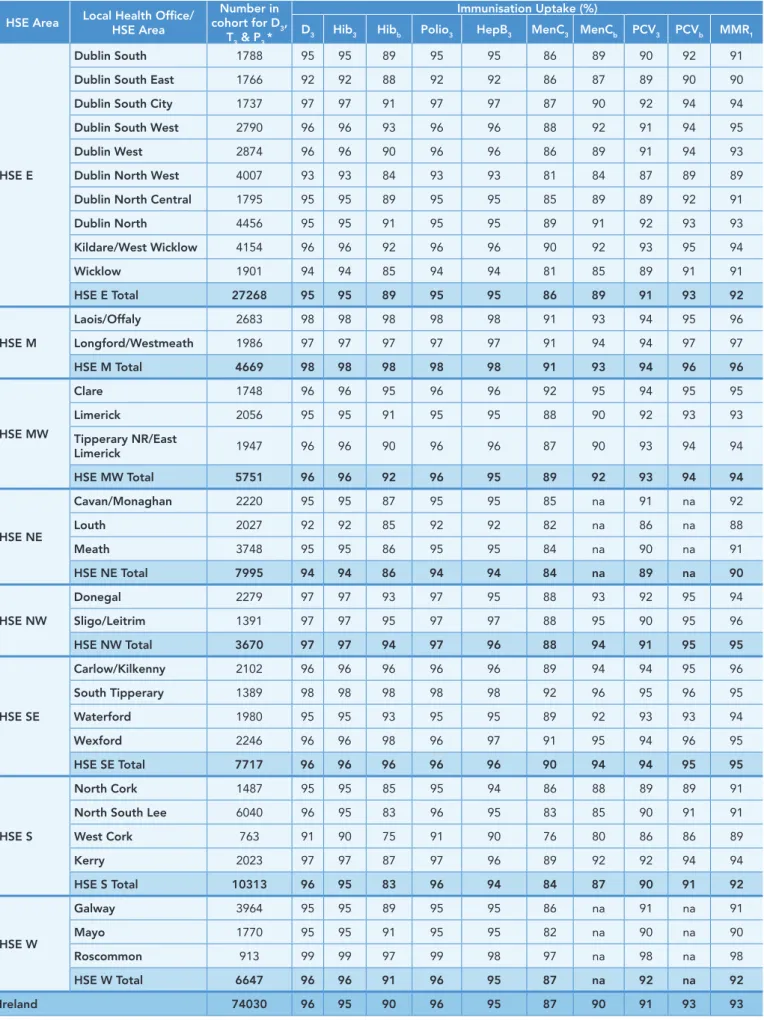
Table 4. Immunisation uptake (%) at 24 months of age in 2013 (i.e. cohort born 01/01/2011-31/12/2011) by LHO and HSE Area HSE Area Local Health Office/HSE Area cohort for DNumber in 3,
T3 & P3 *
Immunisation Uptake (%)
D3 Hib3 Hibb Polio3 HepB3 MenC3 MenCb PCV3 PCVb MMR1
HSE E
Dublin South 1788 95 95 89 95 95 86 89 90 92 91
Dublin South East 1766 92 92 88 92 92 86 87 89 90 90
Dublin South City 1737 97 97 91 97 97 87 90 92 94 94
Dublin South West 2790 96 96 93 96 96 88 92 91 94 95
Dublin West 2874 96 96 90 96 96 86 89 91 94 93
Dublin North West 4007 93 93 84 93 93 81 84 87 89 89
Dublin North Central 1795 95 95 89 95 95 85 89 89 92 91
Dublin North 4456 95 95 91 95 95 89 91 92 93 93
Kildare/West Wicklow 4154 96 96 92 96 96 90 92 93 95 94
Wicklow 1901 94 94 85 94 94 81 85 89 91 91
HSE E Total 27268 95 95 89 95 95 86 89 91 93 92
HSE M
Laois/Offaly 2683 98 98 98 98 98 91 93 94 95 96
Longford/Westmeath 1986 97 97 97 97 97 91 94 94 97 97
HSE M Total 4669 98 98 98 98 98 91 93 94 96 96
HSE MW
Clare 1748 96 96 95 96 96 92 95 94 95 95
Limerick 2056 95 95 91 95 95 88 90 92 93 93
Tipperary NR/East
Limerick 1947 96 96 90 96 96 87 90 93 94 94
HSE MW Total 5751 96 96 92 96 95 89 92 93 94 94
HSE NE
Cavan/Monaghan 2220 95 95 87 95 95 85 na 91 na 92
Louth 2027 92 92 85 92 92 82 na 86 na 88
Meath 3748 95 95 86 95 95 84 na 90 na 91
HSE NE Total 7995 94 94 86 94 94 84 na 89 na 90
HSE NW
Donegal 2279 97 97 93 97 95 88 93 92 95 94
Sligo/Leitrim 1391 97 97 95 97 97 88 95 90 95 96
HSE NW Total 3670 97 97 94 97 96 88 94 91 95 95
HSE SE
Carlow/Kilkenny 2102 96 96 96 96 96 89 94 94 95 96
South Tipperary 1389 98 98 98 98 98 92 96 95 96 95
Waterford 1980 95 95 93 95 95 89 92 93 93 94
Wexford 2246 96 96 98 96 97 91 95 94 96 95
HSE SE Total 7717 96 96 96 96 96 90 94 94 95 95
HSE S
North Cork 1487 95 95 85 95 94 86 88 89 89 91
North South Lee 6040 96 95 83 96 95 83 85 90 91 91
West Cork 763 91 90 75 91 90 76 80 86 86 89
Kerry 2023 97 97 87 97 96 89 92 92 94 94
HSE S Total 10313 96 95 83 96 94 84 87 90 91 92
HSE W
Galway 3964 95 95 89 95 95 86 na 91 na 91
Mayo 1770 95 95 91 95 95 82 na 90 na 90
Roscommon 913 99 99 97 99 98 97 na 98 na 98
HSE W Total 6647 96 96 91 96 95 87 na 92 na 92
Ireland 74030 96 95 90 96 95 87 90 91 93 93
*As the denominator/number in cohort varied slightly according to vaccine. The most commonly used number is reported here. Since T3 and P3 uptake identical to D3 uptake only D3 uptake figures are presented
Figure 2. National quarterly immunisation uptake rates at 24 months
Note scale ranges from 60-100%
P3 uptake could not be calculated accurately during 1999-2001 as DTaP/DT uptake was reported as a combined value for the HSE NE during 1999, Quarters 3 and 4 2000 and Quarter 1 2001 and the HSE NW in 2000 and 2001. The Q4 2005 MMR1 figure is based on data from seven of the eight HSE Areas. The Q1 2006 MMR1 figure includes the HSE E figure that is an estimate only. The Q1 2007, Q3 2007, Q2 2008 and Q3 2008 Hibb figures are based on data from seven of the eight HSE Areas. In Q1 2008 the HSE SE changed their Hibb data extraction method compared to previous quarters; in Q1 2008 the uptake of Hibb in the HSE SE was 83% compared to 53% in Q4 2007. The Q3 2008 MenC3 figure is based on data from six of the eight HSE Areas. The Q1 2009 HSE E D3, P3, T3, Polio3 and MMR1 uptake figures exclude those born on the 31/03/2007. The Q2 2009 HSE E Hibb uptake figures exclude uptake figures from Dublin North. The Q4 2009 figures are based on data from seven of the eight HSE Areas. The Q4 2009 Hibb figures also exclude uptake figures from Dublin North and HSE SE Hibb data for those given a Hib dose as part of the five in one or six in one vaccine after 12 months of age. The Q1 2010 figures are based on data from six of the eight HSE Areas. The Q1 2010 Hibb figures also exclude uptake figures from HSE E Dublin North. The Q2 2010 and Q4 2010 figures are based on data from seven of the eight HSE Areas. MenCb and PCVb figures are based on data form six of the eight HSE Areas.
60 65 70 75 80 85 90 95 100
Q1 1999 Q3 1999 Q1 2000 Q3 2000 Q1 2001 Q3 2001 Q1 2002 Q3 2002 Q1 2003 Q3 2003 Q1 2004 Q3 2004 Q1 2005 Q3 2005 Q1 2006 Q3 2006 Q1 2007 Q3 2007 Q1 2008 Q3 2008 Q1 2009 Q3 2009 Q1 2010 Q3 2010 Q1 20
11
Q3 20
11
Q1 2012 Q3 2012 Q1 2013 Q3 2013
% Uptake
Quarter/Year
D3 P3 Hib3 Polio3 MenC3 PCV3
HepB3 MMR1 Hibb MenCb PCVb
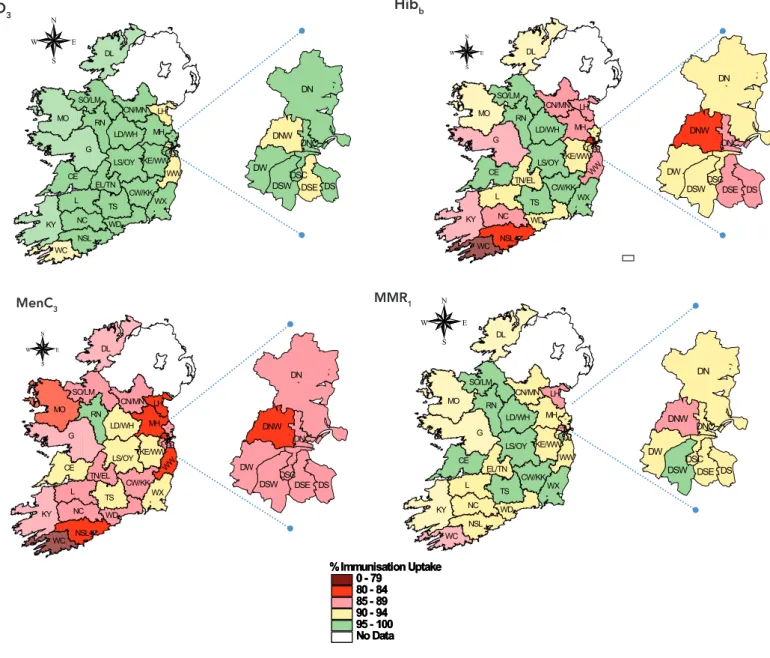
90% to 96%, PCV3 ranged from 89% to 94%, MenC3 ranged from 84% to 91% and Hibb ranged from 83-98% (table 2). Among the six Areas in a position to provide data MenCb uptake ranged from 87% to 94% and PCVb uptake ranged from 91% to 96%. The target uptake of 95% was reached or exceeded in seven HSE Areas during 2013 for D3, T3, P3, Hib3 and Polio3, in six Areasfor HepB3, in three for PCVb and MMR1 and in two for Hibb (table 2). D3, Hibb,MenC3 and MMR1 uptake rates are mapped by LHO in figure 3. Among the LHOs the uptake rates ranged from 91% to 99% for D3, T3, P3 and Polio3, 90% to 99% for Hib3, 90-98% for HepB3, 88% to 98% MMR1, 86% to 98% for PCV3, 86% to 97% for PCVb, 80% to 96% for MenCb, 76% to 97% for MenC3 and 75% to 98% for Hibb (table 4). The target uptake of 95% was reached or exceeded in 26 LHOs for D3, T3, P3, Hib3 and Polio3, in 25 LHOs for HepB3, in nine LHOs for PCVb and MMR1, in eight LHOs for Hibb, in fourLHOs for MenCb, in two LHOsfor PCV3 and in one LHO for MenC3 (table 4). Roscommon was the only LHO to reach and exceed the target of 95% for D3, T3, P3, Hib3, Polio3,HepB3, Hibb, MenC3, PCV3 and MMR1 at 24 months.
There was a large decline in MenC3 and a decline in Hibb uptake at 24 months in Quarters 3 and 4 2010
ie children who were born between July 1st and December 31st 2008 and were the first recommended the new immunisation schedule. There was a change in timing of the MenC and Hibb vaccines under the new immunisation schedule (table 1). The uptake of MenC3 (87%) in particular and Hibb (90%) in 2013 were still lower than the uptake of the other recommended vaccines. In addition, to low uptake of MenC3 and Hibb, MMR1 (93%) and PCV3 (91%) uptake in 2013 are lower than the target uptake of 95%.
In contrast in 2013, annual national uptake rates at 24 months for D3, T3, P3, Hib3, Polio3 and HepB3 reached the target rate of 95%. This is the third year national annual uptake rates reached the target of 95% for these vaccines. Seven HSE Areas reached or exceeded the target uptake of 95% for D3, T3, P3,Hib3 and Polio3 at 24 months during 2013. Roscommon reached or exceeded the target of 95% for D3, T3, P3, Hib3, Polio3, HepB3, MenC3,PCV3, Hibb and MMR1 uptake at 24 months of age.
The immunisation reports for Quarters 1 to 4 2013 are available on the HPSC website in Topics A-Z under the heading vaccination.
D3
MenC3
Hibb
MMR1
Table 5. Local Health Office (LHO) abbreviations used in this chapter
N E W S G L DL KY MO CE TS RN NC MH NSL WX LS/OY WC SO/LM WD KE/WW LD/WH LH CN/MN CW/KK TN/EL WW DN DW DNW DSWDSEDS
DNC DSC DSC DNC DSE DS DSW DNW DW DN N E W S G L DL KY MO CE TS RN NC MH NSL WX LS/OY WC SO/LM WD LD/WH LH CN/MN CW/KK WW EL/TN KE/WW DN DW DNW DSWDSEDS
DNC DSC
DN
DW DNW
DSW DSE DS DNC DSC N E W S G L DL KY MO CE TS RN NC MH NSL WX LS/OY WC SO/LM WD KE/WW LD/WH LH CN/MN CW/KK TN/EL W W DN DW DNW DSWDSEDS
DNC DSC DSC DNC DSE DS DSW DNW DW DN N E W S G L DL KY MO CE TS RN NC MH NSL WX LS/OY WC SO/LM WD LD/WH LH CN/MN CW/KK WW EL/TN KE/WW DN DW DNW DSWDSEDS
DNC DSC
DN
DW DNW
DSW DSE DS DNC DSC
No Data 95 - 100 90 - 94 85 - 89 80 - 84 0 - 79
% Immunisation Uptake % Immunisation Uptake
0 - 79 80 - 84 85 - 89 90 - 94 95 - 100 No Data No Data 95 - 100 90 - 94 85 - 89 80 - 84 0 - 79
% Immunisation Uptake
Figure 3. D3, Hibb, MenC3 and MMR1 immunisation uptake rates (%) in those 24 months of age in 2013 by Local Health Office (LHO)
LHOs in Dublin are highlighted separately for ease of viewing
North Lee and South Lee are separate LHOs, however, their combined (labelled NSL on the map) immunisation uptake rate is reported here Please see table 5 to translate LHO abbreviations
CE Clare
CN/MN Cavan/Monaghan
CW/KK Carlow/Kilkenny
DL Donegal
DN Dublin North
DNC Dublin North Central
DNW Dublin North West
DS Dublin South
DSC Dublin South City
DSE Dublin South East
DSW Dublin South West
DW Dublin West
G Galway
KE/WW Kildare/West Wicklow
KY Kerry L Limerick LD/WD Longford/Westmeath LH Louth LS/OY Laois/Offaly MH Meath MO Mayo
NC North Cork
NSL* North South Lee*
RN Roscommon
SO/LM Sligo/Leitrim
TN/EL Tipperary North /East Limerick
TS South Tipperary
WC West Cork
WD Waterford
WX Wexford
WW Wicklow
*Please note while North Lee and South Lee are two separate LHOs their combined immunisation