SMALL-UNIT WATER PURIFIERS IN U.S. ARMY SPECIAL OPERATIONS: A MULTI-ATTRIBUTE EVALUATION
Lauren A. Koban
A thesis submitted to the faculty at the University of North Carolina at Chapel Hill in partial fulfillment of the requirements for the degree of Master of Science in Environmental Sciences in the Gillings School of
Global Public Health.
Chapel Hill 2014
Approved by:
Jacqueline MacDonald Gibson Jill Stewart
ii
iii
ABSTRACT
Lauren A. Koban: Small-Unit Water Purifiers in U.S. Army Special Operations: A Multi-Attribute Evaluation
(Under the direction of Dr. Jacqueline MacDonald Gibson)
iv
TABLE OF CONTENTS
LIST OF TABLES ... vii
LIST OF FIGURES ... viii
LIST OF ABBREVIATIONS ... x
Chapters 1. INTRODUCTION ...1
Research Objective ... 3
Significance ... 4
2. BACKGROUND ...5
MADA Techniques... 6
Multi-Attribute Utility Models ... 7
SMART, SMARTS, SMARTER ... 9
Analytical Hierarchy Process (AHP) ... 10
Outranking Methods ... 12
Weighted Sum Model and Weighted Product Model (WSM, WPM) ... 13
Technique for Order Preference by Similarity (TOPSIS) ... 14
Summary of Techniques ... 15
Utility Determination Techniques ... 16
Indifference Methods (Certainty Equivalent and Probability Equivalent Techniques) ... 16
Direct Rating ... 17
Ratios ... 18
v
Method Choice ... 21
3. METHODOLOGY ... 22
Step 1: Determine Requirements ... 23
Step 2: Establish Attributes and Measures ... 25
Step 3: Identify Alternatives... 28
Step 4: Structure Value Tree ... 31
Step 5: Application of Multi-attribute Utility Theory Process ... 32
Elicitation of Individual Attribute Utilities ... 33
Elicitation of Stakeholders’ Weights ... 37
Aggregate Utility and Weight Scores of Each Alternative ... 41
4. RESULTS ... 42
Utility Scores Using Two Different Methods ... 42
Weighting Scores ... 43
Swing Weighting Method ... 43
Rank Order Centroid Weighting Method... 45
Aggregated Multi-Attribute Utility Scores... 46
5. DISCUSSION ... 48
Comparison with Previous MADA Studies ... 48
Limitations ... 49
6. CONCLUSION ... 51
APPENDIX A: INTERVIEW CONSENT FORM/ UTILITY AND WEIGHT INTERVIEW FORM... 53
APPENDIX B: UTILITY INTERVIEW FORMAT ... 54
APPENDIX C: WEIGHT INTERVIEW FORMAT ... 56
vi
APPENDIX E: AGGREGATED SYSTEM SCORES BY VOTER AND ELICITATION METHOD ... 59
APPENDIX F: AGGREGATED SCORES BY METHOD, ATTRIBUTE, AND VOTER ... 60
vii
LIST OF TABLES
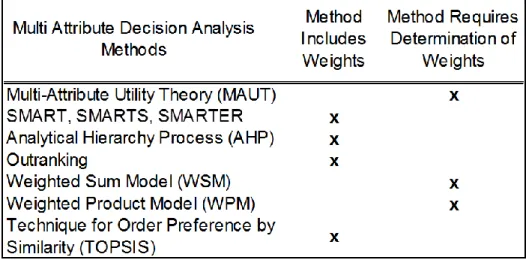
Table 1. Methods for multi-attribute decision analysis, utility and weight determination ... 7
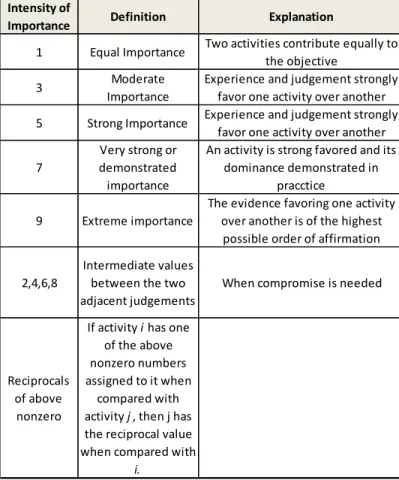
Table 2. Analytical Hierarchy Process Scale of Relative Importance according to Saaty (1980)... 11
Table 3. Utility scores for car buying scenario ... 20
Table 4 Swing weights for car buying scenario ... 21
Table 5. Stakeholder organizations in descending order from higher echelons to end users, number of representatives (in parenthesis), and abbreviations used in the text ... 23
Table 6. Requirements list for water purification systems ... 25
Table 7. Established attributes, descriptions, and measures for water system evaluations ... 27
Table 8. Manufacturers’ specifications for four water purification system alternatives... 30
Table 9. Listing of attributes and descriptions provided to stakeholders prior to the weighting interview process ... 38
Table 10. Best and worst scores for each attribute illustrating hypothetical system that performed the worst in all attributes (shaded cells) ... 39
Table 11. Utility scores using direct rating method and probability equivalent method (PEM) ... 43
Table 12. Listing of attributes and descriptions provided to stakeholders prior to the weighting interview process ... 57
Table 13. Elicited scores from stakeholders using the swing weighting method ... 58
Table 14. Elicited scores from stakeholders using the rank order centroid weighting method ... 58
viii
LIST OF FIGURES
Figure 1. Certainty equivalent reference lottery ... 17 Figure 2. Probability equivalent reference lottery ... 17 Figure 3 Decision Analysis Process for identifying a commercial-off-the-shelf water purification system ... 22 Figure 4. Requirement identification process ... 24 Figure 5. Elimination process from initial 15 attributes to final 9 attributes ... 26 Figure 6. Final value tree for the multi-attribute decision analysis of
commercial-off-the-shelf water purification systems ... 32 Figure 7. Notecards and questions used during direct rating utility elicitation for the attribute of weight ... 35 Figure 8. Probability equivalent method used to elicit utility score for the attribute of weight ... 36 Figure 9. Weights for the nine attributes important in selecting water purification technologies as elicited from seven stakeholders using the swing weighting method. ... 44 Figure 10. Weights for the nine attributes important in selecting water purification technologies as elicited from seven stakeholders using the rank ordered centroid weighting method. ... 45 Figure 11. Overall values of the alternatives for each interviewed stakeholder based on utility elicitation methods of direct rating (a,c) and probability equivalent (b,d) and weighting methods of rank order centroid (c-d) and swing (a-b). ... 46 Figure 12. Probability equivalent reference lottery ... 55 Figure 13. Swing Weighting Example from SMARTS and SMARTER: Improved Simply Methods for Multiattribute Utility Measurement (Edwards and Barron, 1994) ... 57 Figure 14. Bar chart illustrating total aggregated system scores by attribute for the probability
ix
x
LIST OF ABBREVIATIONS
3rd SFG Unites States Army 3rd Special Forces Group
AHP Analytic Hierarchy Process
ANSI American National Standards Institute
CASCOM United States Army Combined Arms Support Command
CEM Certainty Equivalent Method
CHHPPM United States Army Center for Health Promotion and Preventative Medicine
COTS Commercial-off-the-shelf
DAT Decision Analysis Team
ECBC Edgewood Chemical Biological Center
MADA Multi-attribute Decision Analysis
MAUT Multi-Attribute Utility Theory
PEM Probability Equivalent Method
PWD United States Army Petroleum and Water Department
ROC Rank Order Centroid
SMART Simple Multi-attribute Rating Technique
SMARTS SMART using Swings
SMARTER SMART Exploiting Ranks
SOF Special Operations Forces
TOPSIS Technique for Order Preference by Similarity
USAPHC United States Army Public Health Command
USASFC United States Army Special Forces Command
USASOC United States Army Special Operations Command
WPM Weighted Product Model
1
1. INTRODUCTION
According to the United States Army Combined Arms Support Command (CASCOM) Water Planning Guide, safe water is “essential not only for the sustainment of life, but critical to the combat effectiveness of a military force"(CASCOM, 2008). Within the US Armed Forces, debilitating illnesses and injuries due to medical threats have caused more casualties than battlefield injuries throughout
American history(U.S. Dept of the Army, 2002). These medical threats include waterborne diseases that are commonly transmitted through contaminated water. Therefore, achieving the ultimate objective of a military force requires soldiers to maintain a constant state of good health to maintain mission readiness. This thesis assesses alternative technologies for providing safe drinking water to United States Army Special Operations Forces (SOF) soldiers stationed in remote areas of Afghanistan in order to maintain soldiers’ health.
2
However, USAPHC research focuses on conventional Army needs, rather than specifically on the requirements of SOF units (USAPHC, 2010).
In Afghanistan, SOF units are currently engaged in village stability operations, where they are employing a "bottom-up" approach to fostering stability for the populace (Connett and Cassidy, 2011). Village stability operations are conducted by small teams in strategically important rural areas and work with the local populations. A typical embedded team ranges between eight to twelve men, including a medic responsible for field sanitation duties, which include water purification. These teams are trained to maintain a low profile and minimal footprint in their area to avoid detection. Due to the austere locations of the rural villages and the long to larger support areas of operation, internal logistics are a challenge. Consequently, SOF units need to be self-sufficient for survival and operations, requiring them to meet food, water, medical, and personal needs with little to no logistical support (Army FM 3-05, 2010).
Currently, in order to obtain drinking water, embedded teams use bottled water, village wells, or local surface water-sources, or they establish contracts with the local population. The teams purify the latter three (local) sources using commercial-off-the-shelf purification units, or construct their own on site gravity-fed sand filters. In extreme conditions, teams must boil their water or treat it in small batches by adding a coagulant and a disinfectant. These current options often are sub-optimal. The mountainous terrain in Afghanistan hinders resupply, making air drop missions of bottle water or replacement parts for off-the-shelf systems difficult due to lack of security and unpredictable weather. Additionally, some embedded units are operating in close proximity to the enemy, and maintaining their low signature profile is paramount to mission success. There are also difficulties in confirming the quality or source of locally contracted water.
3
purifiers to expand their knowledge base, and improve support to units wishing to purchase commercial-off-the-shelf purifiers. The goals of this evaluation included expanding the limited
knowledge base on small-unit water purifiers, improving support to units wishing to purchase purifiers, and assisting in future procurement and use of commercial-off-the-shelf purifiers when Army-provided water sources are not adequate (USAPHC, 2010). The evaluation focused on small-unit water purifiers to sustain 5-50 personnel requiring 30-425 gallons per day over a period of ten days to six months (CASCOM, 2008). However, this evaluation did not address the specific needs in an SOF environment. The results concluded that no single system performed optimally across all of the different performance criteria the USAPHC had identified and that as a result tradeoffs would be required to select a system. For example, systems with lower sizes and weights produce smaller volumes of water, hence requiring trade-offs between the weight and water production performance criteria.
CASCOM is currently conducting a small-unit water purifier study focused on supporting 40-45 personnel with a minimum of 160 gallons per day. Although initiated in 2012, results are not anticipated until 2015. Additionally, the target populations for this study are platoon and company size elements which are significantly larger than SOF teams. Due to the limitations in current and past research specific to the unique environment, team size, and time sensitive requirements for missions, there is a need for a SOF-specific commercial-off-the-shelf water purifier evaluation model.
Research Objective
4
Significance
Although CHPPM conducted a thorough small-unit-water purifier study in 2009, attributes specific to SOF environments were not included. The research provided in this thesis can help the SOF community not only select among currently available off-the-shelf systems but also develop a SOF-specific protocol to provide deploying units with the optimal choice for their SOF-specific location or mission. This research addresses the lack of adequate small-unit water purifier evaluations pertinent to the SOF community by establishing an evaluation model that aids in identifying the best equipment available, ensuring improved soldier sustainment on the battlefield.
5
2. BACKGROUND
Multi-attribute decision analysis (MADA) methods can help decision-makers choose among alternative options when no single option dominates all others in meeting all of the decision-maker’s objectives(Huang, Keisler, & Linkov, 2011).
MADA has been used across many disciplines; examples include public transportation projects (Site & Filippi, 2009), real estate evaluation (L. F. A. M. Gomes & Rangel, 2009), sustainable development planning (Kain & Söderberg, 2008), renewable technologies selection (Afgan & Carvalho, 2002), and NASA missions(Tavana & Hatami-Marbini, 2011).
Within environmental decision making, MADA has been used for water resources and planning (Karjalainen et al., 2013), selection of remediation techniques of contaminated sites, optimization of coastal and water resources (Linkov et al., 2006), protecting aquatic ecosystems, and forest
management and planning (Ananda & Herath, 2009).
A recent study by Huang et al. (2011) showed that the use of MADA tools in environmental decision-making has grown significantly over last two decades. Huang et al. hypothesized that this growth can be attributed to increased decision complexity as knowledge of environmental processes becomes more sophisticated and increased stakeholder demands for transparency in the environmental decision-making process (Huang et. al 2011).
6
the best-qualified officers for promotion based on military education, civilian education, physical readiness, duty performance, and potential.
The U.S. Army Corps of Engineers “Trade-Off Analysis Planning and Procedures Guidebook” describes MADA methods for use within the Army Corps of Engineers Civil Works planning process (Yoe, 2002). Most importantly, the Army also has a decision analysis team that works on chemical and
biological research at the Edgewood Chemical Biological Center, but can be consulted for other projects. The decision analysis team assisted with the 2010 Small-Unit Water Purifier Study initiated by Army Public Health Command (USAPHC) and used decision analysis methods to evaluate potential commercial-off-the-shelf systems for use by military personnel supporting medium- and large-sized units (USAPHC, 2010). Although two previous off-the-shelf purifier studies have been conducted, both failed to look at the specific requirements of an eight to twelve man team. The current CASCOM study is researching purifiers for units of 40-45 personnel, which require over four times more water production than that of an SOF team. Additionally, SOF teams operate in austere environments requiring them to set-up, maintain, and transport purifiers on their own, compared to larger units that have multiple soldiers trained to solely operate the water equipment. This research includes specific requirements to address the ease of maintenance and maneuverability for an SOF team with minimal purifier training.
MADA Techniques
7
Table 1. Methods for multi-attribute decision analysis, utility and weight determination
All MADA techniques consist of the same components: a set of alternatives, a set of attributes (meaning features of each option of importance to the decision-maker), weights for the attributes (describing the relative importance of the different attributes to the decision-maker) , and a trade-off algorithm (Yoe, 2002). One notable difference among methods is in the approach for weighting attributes (that is, for assigning relative priority to one attribute over another). As Table 1 shows, some methods have built-in algorithms for determining weights, while others require that weights be determined specifically for the decision at hand. There are other differences among methods, as well, including different protocols for eliciting inputs, modeling preferences, combining inputs and
preferences, and analyzing the results (Huang et al., 2011). With so many potential variants to MADA, Triantaphyllou (1989) noted the MADA paradox “What decision making method should be used to choose the best decision making method?” (p.303).
Multi-Attribute Utility Models
8
Keeney and Raffia (1976) developed the MAUT process based on earlier utility theory work by von Neumann and Morgenstern in 1947 (Huang et al., 2011). The MAUT approach assumes the decision-maker is rational, has perfect knowledge, and is consistent in judgment (Linkov et al., 2006).
The most common form of aggregation function assumes that the decision-maker’s preferences can be modeled with a function that is linear in each attribute. This model is expressed as:
( ) ∑ ( )
( 1 )
Where
( )
∑
In order to accurately model preferences with such an additive utility function, conditions known as “mutual utility independence” and “additive independence” must be satisfied. According to Clemen (2001), “An attribute
Y
is considered utility independent of attributeX
if preferences foruncertain choices involving different levels of
Y
are independent of the value of
X”
(p. 648).
Additive independence is a similar but stricter condition requiring that preferences among alternatives hold even when the outcome of a decision is uncertain (in other words, levels of each attribute are not9
Although using an additive utility function requires conformance with mutual utility and additive independence conditions, Clemen (2001) notes “in extremely complicated situations with many
attributes, the additive model may be a useful rough-cut approximation” (p. 539).
SMART, SMARTS, SMARTER
The Simple Multi-attribute Rating Technique (SMART) was presented by Edwards in 1977 to provide a direct assessment method that was easier than the indifference methods required by Keeney and Raiffa’s (1976) approach to deriving MAUT functions. SMART eliminated judgment of preferences or hypothetical indifference between entities, making it easier to teach and use (Edwards, 1977). The method consists of two stages: first attributes are ranked based on importance of the best performance. Next, attributes are scored based on their importance compared to the worst attribute, which is scored a 10. All scores are then normalized to one (M. Gomes, Alberto, Rangel, & Leal, 2011). A criticism of SMART is that it does not consider the range of the each attribute (Edwards & Barron, 1994).
Edwards and Barron (1994) corrected the lack of range by proposing SMARTS (SMART using Swings), which added a hypothetical alternative based on the worst level of each attribute used as a comparison or benchmark. The swing is the changing of an attribute score from its worst value to its best (0 to 100). For example, in a car buying scenario with three cars and four value attributes, the hypothetical benchmark would be a fourth option that scored a 0 in all attributes. Once all attributes are chosen in the order they would be improved, the swings in attribute scores are compared against each other. This method addresses the range of each attribute but has been criticized because of the time consuming nature of the weight elicitation process was and the potential for difficulty in judgments for decision-makers inexperienced with the swing weighting method (Edwards & Barron, 1994).
10
was based on the rank order centroid (ROC) weights, developed by Barron and Barrett (1996), which are calculated by
( ) ∑(
)
( 2)
SMARTER was considered a significant improvement on SMARTS because it no longer required interviews and appealed to researchers because mailed surveys could be used. In comparison studies, Barron ((Edwards & Barron, 1994) found ROC weights to gain 98 to 99% of the utility in full weight elicitation methods and to identify the best option 74 to 87% of the time. In situations where the best option wasn’t selected, the second best option was selected by SMARTER. However, two concerns of SMARTER are the lack of insight occurs during the swing weighting process from the decision-maker since he or she cannot applying specific weights and limited research on its effectiveness in supporting decision-making (Edwards & Barron, 1994).
Analytical Hierarchy Process (AHP)
The Analytical Hierarchy Process (AHP) was developed by Saaty (1980) and is a group of approaches that uses a hierarchical model and pairwise comparisons to determine the importance of one attribute over another. This method establishes a hierarchy of objectives, attributes, sub
attributes, and alternatives. Pairwise comparisons made by asking “How important is attribute Ai relative
to Aj?” are used to assess the relative importance of attributes using a number scale of 1 to 9 f (Table 2)
11
Comparison values are organized in a matrix, and matrix algebra is used to determine weights as the elements in the eigenvector associated with the maximum eigenvector of the matrix.
Pairwise comparisons are then conducted between alternatives on each attribute using the same scale in Table 2. Performance scores for each alternative are calculated the same way as the weights across each attribute using the question “How important is system A relative to system B? “. Once weights and performance scores are calculated, they are combined using MAUT aggregation techniques, which provide an overall ranking for each alternative. (Fülöp, 2001; Triantaphyllou & Mann, 1995).
Table 2. Analytical Hierarchy Process Scale of Relative Importance according to Saaty (1980)
When compared to MAUT and outranking methods described below, AHP historically has been used the most in environmental decision making due to the wide availability of software packages and support for user groups (Huang et al., 2011). This process is also considered simple and flexible when
Intensity of
Importance Definition Explanation
1 Equal Importance Two activities contribute equally to the objective
3 Moderate
Importance
Experience and judgement strongly favor one activity over another 5 Strong Importance Experience and judgement strongly
favor one activity over another
7
Very strong or demonstrated importance
An activity is strong favored and its dominance demonstrated in
pracctice
9 Extreme importance
The evidence favoring one activity over another is of the highest possible order of affirmation
2,4,6,8
Intermediate values between the two adjacent judgements
When compromise is needed
Reciprocals of above
nonzero
If activity i has one of the above nonzero numbers assigned to it when
compared with activity j, then j has the reciprocal value when compared with
12
involving multiple stakeholders, and can be used with relative values for each attribute instead of actual values (Triantaphyllou & Mann, 1989). Sharma (2013) stated when dealing with multiple stakeholders, AHP provides “a useful mechanism for checking the consistency of the evaluation measures and alternative suggested by the team thus reducing bias in decision making” (p.51).
Conversely, Belton and Gear (1986) found “The limitation of the scale to 1-9 imposes unnatural restrictions on judgments” (p. 11) and proposed a revised AHP version. The revised version recommends dividing each relative value by the maximum value of the relative values instead of the earlier version ensuring the relative values of the alternatives A1, A2, A3, …, AM sum to one (Triantaphyllou & Mann,
1989). One critique of both versions of AHP is the complexity of comparisons as the number of attributes increases. Using four alternatives and nine attributes would require a decision-maker to make 198 comparisons. Additionally, without a software package, the AHP method is difficult to apply.
Dyer (1990) has also critiqued the AHP because, mathematically, it can be shown that rank reversals are possible when employing this method, meaning that a decision-maker may change his or her preference for option A over option B, if a third alternative is added. This tendency for preference reversal violates the axioms required to satisfy the Von Neumann-Morgenstern utility theorem and hence calls into question whether the method accurately reveals the preferences of a ration decision-maker. Dyer (1990) further concluded that as a result of the lack of consistency with the axioms of utility theory “the rankings provided by the [AHP] are arbitrary.” (Dyer, 1990, p. 252).
Outranking Methods
Outranking methods are based on the principle that one option may have a degree of
13
each attribute, to identify the extent of one preference over another. Preference information is then aggregated across all relevant criteria to establish the strength of evidence favoring one alternative over others (Linkov et al., 2006).
One flaw of outranking techniques is that they do not always identify the single best alternative. Outranking allows lesser performance on some attributes to be compensated for by superior
performance on other attributes, leading to the alternative that performs the highest on the most attributes being favored when it may not be the best option (Linkov et al., 2006). Although outranking methods are successful for initiating a dialogue between multiple stakeholders, they do not provide a single solution to problems; Instead they drive a deliberative process between multiple stakeholders (Huang et al., 2011). Additionally, algorithms used in outranking are complex, and are not easily understood by decision-makers (Linkov et al., 2006). Outranking techniques are best suited when attribute metrics are not easily aggregated, measurement scales vary over large ranges, and units are disproportionate or incomparable (Seager, 2004).
Weighted Sum Model and Weighted Product Model (WSM, WPM)
The Weighted Sum Model is the most commonly used approach in single dimension problems, where all units are the same (dollars, feet, seconds). With M alternatives and N attributes, the best alternative is the one that satisfies (in the maximization case):
∑
( 3 )
Where A(WSM score) = the WSM score of the best alternative aij= the actual value of the ith alternatives in the jth attribute
14
This method is one of the most widely used; however, it is difficult to apply to multi-dimensional decision making problems that involve combining different units (Triantaphyllou & Mann, 1989).
The weighted multiplication method is similar to WSM but uses a multiplicative model, where each alternative is compared to others by multiplying a number of ratios. Ratios are raised to the power of the attribute’s relative weight. To compare alternatives AK and AL, the ratio, R(AK/AL) is calculated
using the following equation:
( ) ∏( )
( 4 )
If R(AK/AL) is greater than or equal to one, the alternative in the numerator or AK is preferred
over the alternative in the denominator. This method is effective with both single and multidimensional problems and is dimensionless. Another advantage is it can also use relative values instead of actual values(Triantaphyllou & Mann, 1989). However, as the number of attributes and alternatives increase, this method becomes overly complicated for both the decision-maker and the analyst. Additionally, in Triantaphyllou and Mann’s (1989) comparison of MADA method that included the AHP, revised ASHP, WSM, and WPM, they found the revised AHP to be by far the most accurate method of the four.
Technique for Order Preference by Similarity (TOPSIS)
15
the negative ideal distance and the sum distance of the ideal and negative ideal for each alternative (Huang et al., 2011).
Two benefits identified by Huang et al. (2011) are that the only judgments needed are for the weights, and smoother tradeoffs are established due to the non-linear relationship between single dimension scores and distance ratios. However, compared to other MADA techniques, there are limited studies published using the TOPSIS method, with only five published articles in the fields of strategy and manufacturing identified in Huang et al.’s (2011) analysis of multi-attribute decision analysis. One limitation of TOPSIS is the need for complete or deterministic values, which are difficult to obtain in real world problems. Because of limited deterministic data, recent research has extended the TOPSIS method to address decision making problems with fuzzy data with positive results (Jahanshahloo, Lotfi, & Izadikhah, 2006).
Summary of Techniques
The selection of an MADA technique depends on multiple factors, including the scope of the problem, number of alternatives, number of attributes, nature of the attribute, and involvement of stakeholders. Numerous comparisons between the different MADA techniques have been conducted through the years. In an analysis of MADA used in environmental sciences over an eight year period, Huang et. al. (2011) concluded that regardless of the method, recommendations from decision-makers did not vary significantly.
16
maximization of expected utility, which guarantees to results in a choice that reflects the best option as would be viewed by a rational decision-maker (Clemen, 2001). Although Saaty established axioms for the AHP in 1986, his axioms are criticized for a lack of a testable description of behavior (Dyer, 1990).
Although many MADA techniques have been used when involving stakeholders, the MAUT approach was the selected method for this research due to its strong axiomatic foundation.
Utility Determination Techniques
In order to evaluate each alternative on each attribute, utility functions must be established to accurately portray a decision-maker’s preferences. These functions translate quantitative or qualitative data for each alternative into quantitative scores on the same scale, so that attributes can be compared directly. The following methods can be used to establish utilities:
a. Indifference Methods b. Direct Rating
c. Proportional scores
Indifference Methods (Certainty Equivalent and Probability Equivalent Techniques)
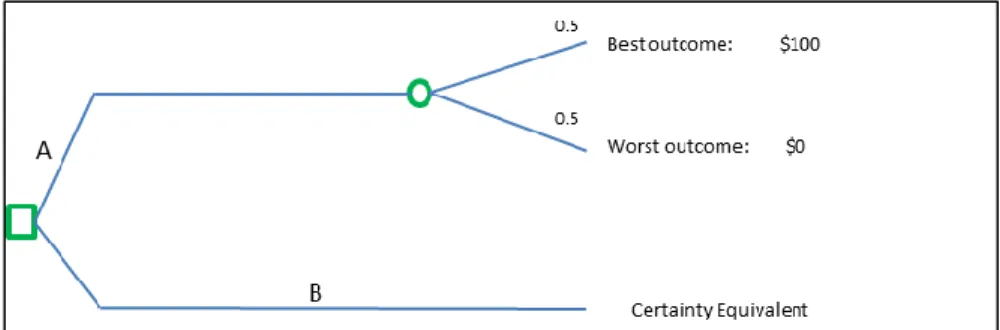
Indifference methods incorporate risk attitudes and consist of adjusting pairs of options until a decision-maker is indifferent between options. Two indifference techniques include the certainty equivalent (CE) and the probability-equivalent (PE) methods. Both methods involve a reference lottery and varying outcomes until a decision-maker is indifferent between the gamble and certain outcome. The certainty method provides a lottery between a gamble and a guaranteed return, such as the lottery illustrated in Figure 1.
17
Figure 1. Certainty equivalent reference lottery
Similar to the previous method, the probability equivalent method also uses a reference lottery, but this time the probability is directly assessed between the lottery of best and worst outcomes and another given alternative. For example, using the same gamble values as above, and a guaranteed $65, a decision-maker would be given the options shown in the top branch of Figure 2 (winning $100 with a probability p and losing $100 with a probability of 1-p).
The decision-maker adjusts the probability of winning between the best and worst until indifference is met between the lottery (option A) and $65 (option B), establishing the probability equivalent (Clemen, 2001).
Figure 2. Probability equivalent reference lottery
Direct Rating
18
preference. Consistency checks are conducted by comparing alternatives against each other to ensure alternatives are ranked properly between anchors. For example, in a car buying scenario with red, blue, green, and yellow cars, a decision-maker prefers a red car the most and the blue car the least.
Therefore, using the values of 0-100, he assigns scores of 100 to the most desirable option (red car) and 0 points to his least desirable option (blue car) making the red car and blue car his anchor points. In this scenario, the decision-maker would rank the yellow and green cars between the two anchor points. A consistency check would confirm that if the voter preferred yellow to green, then the yellow car should have a higher score than the green car.
Ratios
Ratios are another method to transform qualitative data into quantitative values. Instead of using the best and worst options as anchors in direct rating, this method establishes values using ratio comparisons. For example, in the above car buying scenario, if the decision-maker decides that a yellow car is twice as nice as a blue car, and that red is three times as nice as blue, then using scale of 0 to 100, 90 points are assigned to the red car, 60 points to the yellow car, and 30 points to the blue car (Clemen, 2001). Then, the resulting scores are scaled between 0 and 100, so that the red car is assigned a score of 100, the blue a score of 0, and the yellow car a score that is half-way between zero and 100 (i.e. 50).
Weighting Techniques
Weighting reflects the relative importance of attributes according to the decision-maker. This step enables decision-makers to create tradeoffs between attributes. Weights can be ordinal or cardinal. Ordinal values focus only on the numerical order, where cardinal weights address the order and
magnitude between values (Ananda & Herath, 2009).
19
Hence, in addition to choosing an MADA technique, for these latter three MADA approaches a method for choosing weights must also be selected. Weights can be elicited through the following processes:
a. Rank Weights b. Fixed Point Scoring c. Swing Weights d. Tradeoff Weights
Rank Weights
This is the simplest concept and only requires decision-makers to rank attributes against each other in order of importance. Scales of 1 to 10 or 1 to 100 are commonly used. To calculate weights, ordinal rankings are reversed to determine importance points, so the most desirable attribute has the highest score and the least desirable attribute has the lower score. Weights for each attribute are calculated as the percentage of total scores for all attributes using equation 5. Although easy for the decision-maker to understand, this method does not force the decision-maker to make explicit tradeoffs between attributes or consider the range of scores between attributes (Von Winterfeldt, 1986).
∑
( 5 )
Where
Fixed Point Scoring
20
to understand; however, the decision-makers sometimes have difficulties with making tradeoffs between attributes (Yoe, 2002).
Swing Weighting
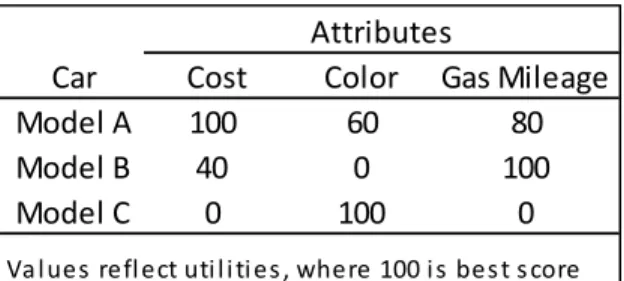
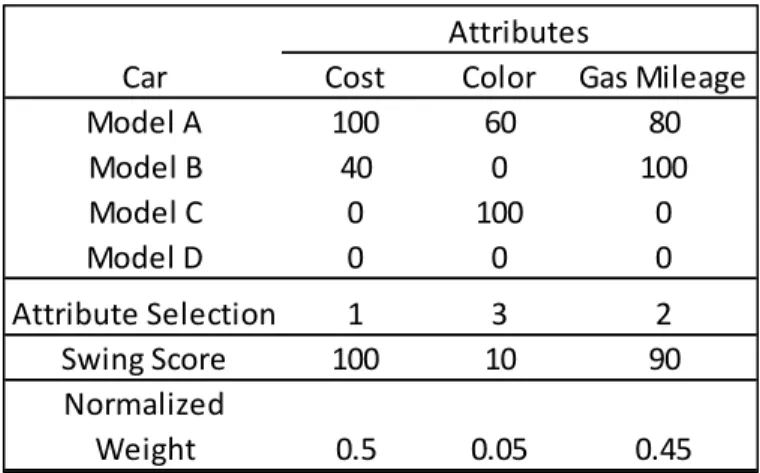
Swing weighting, published by Von Winterfeldt (1977) and Edwards (1986), is a three step process. The first step involves ranking the order of importance of the attributes based on the swing from the worst to the best level. This can be done using a hypothetical comparison that is considered the worst in all attributes. For example, consider choosing a car from a set of three models shown in Table 3, where the attributes of interest are cost, color, and gas mileage (indicated in Table 3 with utility scores).
Table 3. Utility scores for car buying scenario
To assess the order of importance of the attributes, the decision-maker is provided with a scenario in which he is required to purchase a fourth car model that scored a zero in all attributes. Then, the decision maker is asked which attribute he would select for improvement from worst to best, if he were allowed to improve only one of the attributes. If he chose cost, then he would be asked again which attribute he would choose, beyond cost. The line of questioning is continued until all attributes are selected. Attribute selection is shown in Table 4.
The second step is to elicit the relative value of the decision-maker of improving from the worst to the best outcome on each attribute, in comparison to swinging from the worst to best on other attributes. For example, suppose the decision-maker thought that swinging from 0-100 on gas mileage is 90% as valuable as swinging from worst to best on cost (the most important attribute). Then, the
Car Cost Color Gas Mileage
Model A 100 60 80
Model B 40 0 100
Model C 0 100 0
Attributes
21
decision-maker would assign a value of 90 to the gas mileage attribute. This question is again repeated with color. If the decision-maker cared little about color, in comparison to cost, he may score the color swing as having a value of 10. The final step is normalizing the scores to establish the weights (Table 4) (Edwards & Barron, 1994). The weights are normalized by summing all the swing scores and then dividing the swing score for each attribute by this sum.
Table 4 Swing weights for car buying scenario
Method Choice
The MADA technique selection is based on the type of decision, number of attributes, availability of a software support tool, and the number of stakeholders involved in a decision. Depending on the method selected, there may be additional decisions based on how to elicit utilities and weights.
Based on the multiple numbers of stakeholders involved in the small unit water purifier
acquisition process and number of attributes with dissimilar measures, the multi-attribute utility theory was selected. Although initially only swing weighting was selected to elicit weights, the rank order centroid (ROC) method was also employed. Both techniques were selected based on ease of understanding and limited time burden for interviewees.
Car Cost Color Gas Mileage
Model A 100 60 80
Model B 40 0 100
Model C 0 100 0
Model D 0 0 0
Attribute Selection 1 3 2
Swing Score 100 10 90
Normalized
Weight 0.5 0.05 0.45
22
3. METHODOLOGY
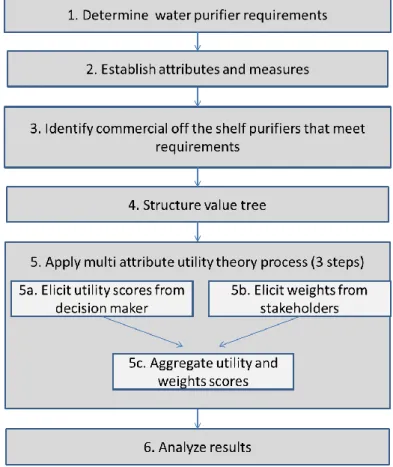
The goal of this research is to identify the best commercial-off-the-shelf water purification system for use in the SOF environment using stakeholder input. This section describes the method to obtain stakeholder feedback and apply it using the multi-attribute utility theory. This research follows the decision analysis process steps outlined in Figure 3.
Figure 3 Decision Analysis Process for identifying a commercial-off-the-shelf water purification system
23
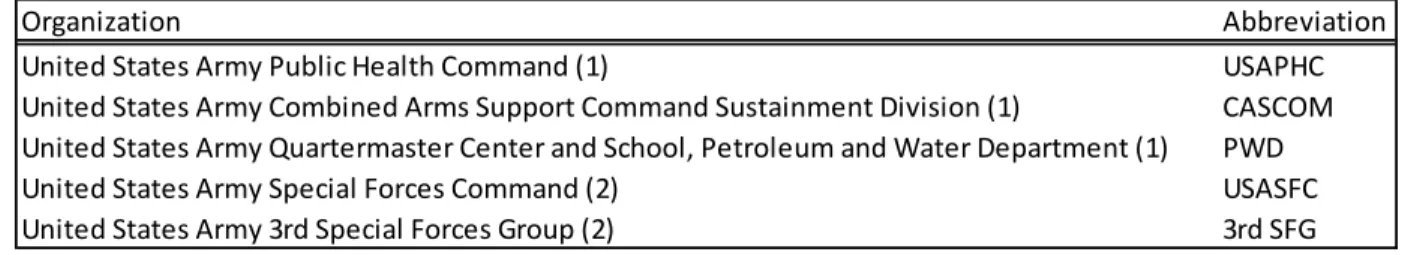
were selected based on their participation in previous small unit water purifier studies conducted by United States Army Public Health Command. The third stakeholder works within the Quartermaster Center and School’s Petroleum and Water Department and has over twenty years of experience in the Army as a water treatment specialist with multiple deployments, while the last four from USASFC and 3rd SFG are active duty or retired soldiers serving within the Army’s Medical Service Corps Preventive Medicine branch.
Table 5. Stakeholder organizations in descending order from higher echelons to end users, number of representatives (in parenthesis), and abbreviations used in the text
Step 1: Determine Requirements
This research was initiated by the United States Army Special Operations Command (USASOC) Surgeon’s Office, which recognized the lack of water purification devices specific to the SOF
environment and the need for an evaluation process for commercial-off-the-shelf systems. Therefore, the USASOC Surgeon’s Office was contacted for system requirements feedback due to its medical oversight role in preventing waterborne disease and ensuring adequate field water supplies within the SOF environment (U.S. Dept of the Army, 2010). Prior to starting any interviews or contacting vendors, the UNC Intuitional Review Board (IRB # 13-3054) approved all research methods.
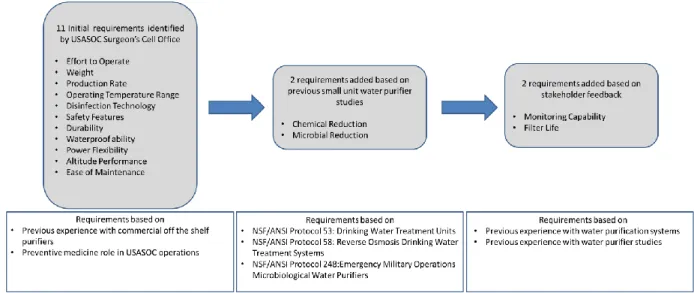
Through email conversations, members of the surgeon’s section provided an initial list of eleven requirements based on their preventive medicine role and experience using commercial-off-the-shelf purifiers in the SOF environment. To these requirements were added two requirements used in the 2010 water purification system study initiated by Army Public Health Command: meeting microbial and chemical reduction standards. These standards are outlined in the following three regulations: the NSF
Organization Abbreviation
United States Army Public Health Command (1) USAPHC
United States Army Combined Arms Support Command Sustainment Division (1) CASCOM
United States Army Quartermaster Center and School, Petroleum and Water Department (1) PWD
United States Army Special Forces Command (2) USASFC
24
International (NSF) / American National Standards Institute (ANSI) Protocol 248: Emergency Military Operations Microbiological Water Purifiers, NSF/ANSI Protocols 53: Drinking Water Treatment Units and NSF/ANSI Protocol 58: Reverse Osmosis Drinking Water Treatment Systems Overview. Although an important attribute to address, cost was not included in this research as an attribute due to an inability to obtain accurate quotes for the systems. Therefore, cost will not be addressed as an attribute and a cost benefit analysis will not be included in this research.
Using this initial list of thirteen requirements, phone interviews were conducted with the stakeholders listed in Table 5 to confirm or add additional requirements based on their personal experiences with water purification systems or previous water purifier studies. Based on this feedback, two more requirements were added: system filters must have the ability to treat enough water in the first 72 hours and the ability for the system to provide visual and audible warning if it fails to operate properly and water quality might be comprised. Because of the concern of filter life, the need for 30 days of accessories was added to the weight requirement. The process of identifying requirements is outlined in Figure 4 with the revised requirements listed in Table 6.
25
Table 6. Requirements list for water purification systems
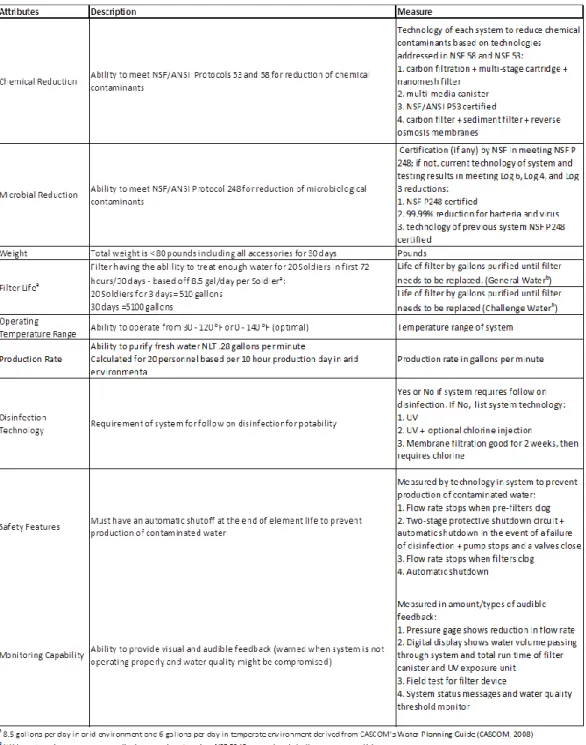
Step 2: Establish Attributes and Measures
Attributes and measures were determined in a similar process to the requirements using feedback from the stakeholders listed in Table 5. Fifteen initial attributes were developed to assess and score the performance of each alternative against the requirements outlined in Table 6, but this list of
Requirements
Must be operable by end user with minimal training (no more than 4 hours of instruction)
Weight of system plus 30 days of accessories must be less than one to two man lift requirements (87/174 pounds)
Must be able to deliver 72 hours of all required potable water (minimum) without resupply
Must be able to operate from 30 – 120 ⁰ Fahrenheit with 0 - 140 ⁰ Fahrenheit (optimal)
Must operate from 0 - 10,000 feet above mean sea level
Must be able to survive a drop of 3 feet onto a flat concrete surface without impairing functionality
Must not require follow-on disinfection for potablity
Must be maintainable by the end user without major vendor support (i.e. the end user can change filters, components, circuit boards, etc)
Must be waterproof to 66 feet (can be in a specialized container) for full immersion for delivery via maritime platform
Must operate on multiple power sources (50/ 60 Hz, 110 - 240V, power either via external port, generator, battery, or solar power) and have sufficient battery power to operate for 4 hours without external power supply at full production
Should have an automatic shutoff at the end of element life to prevent production of contaminated water
Must meet NSF Protocol 248 for reduction of microbiological contaminants Must meet NSF/ANSI Protocols 53 and 58 for reduction of chemical contaminants
Should provide visual and audible feedback when system is not operating properly and water quality might be compromised
Filter having the ability to treat enough water for 20 Soldiers in first 72 hours/30 days - based off 8.5 gal/day per Soldiera:
20 Soldiers for 3 days= 510 gallons 30 days =5100 gallons
a
26
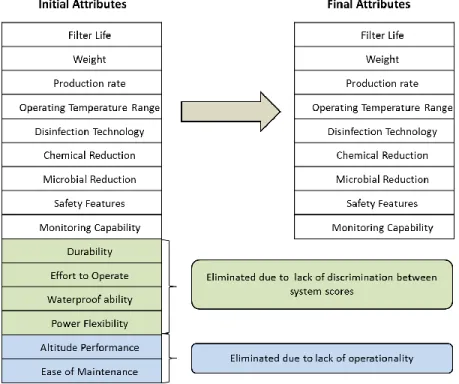
attributes was shortened to nine based on the inability of four attributes to discriminate among the four water treatment systems and the two attributes lacking viable scoring measures (Figure 5).
Figure 5. Elimination process from initial 15 attributes to final 9 attributes
27
28
Step 3: Identify Alternatives
Three alternatives (Aspen 1800 BC™, Seldon Waterbox™, Global Water LS3 Village System™) for this model were predetermined by senior leaders within the United States Special Operations Command Surgeon Cell based on current systems in use and preliminary market research. However, after
conducting an initial review of system specifications, insufficient performance data was available on the Global Water alternative, so it was removed.
In an effort to produce more varied results, we identified three additional systems through online market research. Alternatives were selected based on the ability to meet as many of the requirements listed in Table 6 as possible. Additionally, system selection was based on the ease of acquisition for future laboratory testing to validate system capabilities.
Two of these alternatives, the SLMCO FBS 180™ and SLMCO FBS 400™, were identified based on the high performance of a similar system, SLMCO 5.0™, from the same manufacturer in previous small unit water purifier studies (USAPHC, 2010). Although both FBS systems met requirements, only the SLMCO FBS 180 was evaluated based on its smaller size, as well as to reduce redundancies of having two systems from the same manufacturer. The third system, the Nephros MSU Ultra filter Water
Purification System™ configured with an Aquamira DIVVY50™ water pump, was identified based on recommendations from the Combined Arms Support Command (CASCOM) small unit water purifier study (USAPHC, 2010). Although this system is being evaluated for CASCOM’s current purifier study to support a larger number of soldiers (up to 50), its small size and technology also met requirements for this study.
The resulting four alternatives evaluated in this study were the Aspen 1800 BC™, Selden Waterbox™, SLMCO FBS 180™, and the Nephros MSU Ultra filter™ configured with an Aquamira
29
Table 8. Manufacturers’ specifications for four water purification system alternatives
Sources: http://seldonwater.com/product/waterbox-max/, http://www.aspenwater.com/id3.html, http://www.slmcopurewatersystems.com/man-portable-units/, http://www.nephros.com/military-water/, U.S. Army Public Health Command (USAPHC), Materiel Systems Directorate, CASCOM, Fort Lee, VA
Objectives Description Measures
Seldon Waterbox™ Aspen 1800 BC™
Nephros MSU Ultra filter™ with
Aquamira DIVVY50™ Configuration SLMCO FBS 180™
Chemical Reduction Ability to meet NSF/ANSI Protocols 53 and 58 for reduction of chemical contaminants
Certification (if any) by NSF in meeting NSF P53/58; if not, current technology of each system to reduce chemical contaminants based on technologies addressed in NSF 58 and NSF 53
• Multi-stage Cartridge and Carbon Filtration •2 Pre-filters (carbon core with nanomesh) • Main nanomesh filter
•Two stage filtration
• Multi-media water canister • NSF/ANSI P53 certified filter
•Sediment filters • carbon filters • NSF P53/58 certified reverse osmosis membranes
Microbial Reduction
Ability to meet NSF/ANSI Protocol 248 for reduction of microbiological contaminants: Bacteria - Escherichia coli, Raoultella terrigena, or Bacillus atrophaeus (spore form),
Certification (if any) by NSF in meeting NSF P248; if not, current technology of system and testing results in meeting Log 6, Log 4, and Log 3 reductions
Passed NSF P248 Protocol - 1 Mar 2013 99.99% reduction for bacteria and virus Techology of previous system (UF- 40) NSF P248 certified Techology of previous system (SLMCO 5.0) NSF P248 certified Weight Total weight is < 80 pounds including all accessories for initial operation - 30 days (does not include weight of storage tanks for 30 days) Pounds (including weight of accessories for 30 days) 76 pounds 118 pounds 75 pounds 82 pounds
Life of filter by gallons purified until filter needs to be replaced. (General Waterb
)
• Prefilter: 3,963 gallons
• Nanomesh filter: 7,926 gallons 9,000 galllons 26,420 gallons 13,209 gallons
Life of filter by gallons purified until filter needs to be replaced (Challenge Waterb)
• Prefilter:264 gallons
• Nanomesh filter: 2,641 gallons 7,500 gallons 2,642 gallons 5,040 gallons
Temperature Range Ability to operate from 30 - 120 ⁰F or 0 - 140 ⁰F (optimal) Temperature range of system 41 ⁰F -100.4 ⁰F -4 ⁰F - 122 ⁰F -22 ⁰F - 158 ⁰F 4 ⁰F - 110 ⁰F Production Rate
Ability to purify fresh water NLT .28 gallons per minute (to meet 170 gallons/day daily requirement for 20 soldiers) Calculated for 20 soldiers based per 10 hour production day in arid environmenta
Production rate in gallons per minute .6 gallons per minute/360 gallons per day 1.25 gallons per minut/750 gallons per day 1.95 gallons per minute/1,170 gallons per day .14 gallons per minute/ 200 gallons per dayc
Disinfection Technology Must not require follow-on disinfection for potability Requirement of follow-on disinfection Yes, requires disinfection No, Ultraviolet (UV) disinfection No, Membrane filtration; recommend chlorine for storage > 2 weeks
No, Ultraviolet (UV) with optional chlorine injection
Safety Features Must have an automatic shutoff at the end of element life to prevent production of contaminated water
List technology in system to prevent production of contaminated water
Flow rate stops completely when pre filters clog
• Two-stage protective shutdown circuit • Automatic shutdown in the event of a failure in the disinfecting process • Pump stops and valves close
Flow rate stops when filter clogs Automatic shutdown
Monitoring Ability to provide visual and audible feedback (warned when system is not
operating properly and water quality might be compromised) Amount and types of audible feedback Pressure gage shows reduction in flow rate
Digital display shows: •water volume passing through the system • total run time of the filter canister and UV exposure unit.
Field integrity test (FIT) for filter devices; can test membrane at anytime
• System status messages • Water quality threshold monitor
a 8.5 gallons per day in arid environment and 6 gallons per day in temperate environment derived from CASCOM's Water Planning Guide (CASCOM, 2008) b General and challenge water qualities as defined by NSF P248
c This system is designed to run for 24 hours without stopping; values are based on 24 hour production day.
Small-Unit Water Purification System Specification Sheet: All Systems
Filter Life
Filter having the ablility to treat enough water for 20 Soldiers in first 72 hours/30 days - based off 8.5 gal/day per Soldiera: 20 Soldiers for 3 days= 510 gallons 30 days =5100 gallons
Aspen 1800 BC
Selden Waterbox Nephros MSU Ultra filterTMwith Aquamira SLMCO FBS 180
31
Step 4: Structure Value Tree
Once the requirements, attributes, and alternatives were identified, a value tree was structured that addressed the overall goal of this research. According to the Army’s Technical Bulletin on Sanitary Control and Surveillance of Field Water supplies, one of the many roles of a preventive medicine officer in the Army is to ensure the “security, adequacy, and quality of field water supplies” (Technical Bulletin Med 577, Sanitary Control and Surveillance, 2010, p. 107). Therefore, when constructing the model for the small unit water purifier decision, the objectives of security, adequacy, and quality, were used to frame the value tree. Security encompasses the features of a system to safely treat water and provide an indication of compromised water quality. Adequacy addresses the system’s ability to meet the demands in the SOF environment including operating in extreme temperatures, and being light enough for one soldier to transport. The objective of quality ensures that a water purification system is able to treat water to a safe level and not provide a health threat to soldiers.
The nine attributes were based on the initial requirements, feedback from the stakeholders (Table 5) collected through telephone and email conversations, and previous water purifier study reports. Initially, 15 attributes based on the 15 requirements identified in the previous section were established. Two attributes, altitude performance and ease of maintenance did not have enough data from manufacturers on the systems to establish measures. Those attributes were eliminated based on a lack of operationality, or the inability of attributes to be well-defined and viable for working and scoring (Keeney & Raiffa, 1976). During the first round of utility interviews, four additional attributes were eliminated due to a lack of discrimination because of similar features among all four systems, making it too difficult to compare the systems. The attribute elimination process is illustrated in Figure5.
32
Figure 6.Final value tree for the multi-attribute decision analysis of commercial-off-the-shelf water purification systems
Step 5: Application of Multi-attribute Utility Theory Process
The linear additive model was chosen to represent decision-maker preferences because as Clemen and Reilly (2001) note “evidence has shown that the additive model is reasonable for most situations under conditions of certainty” (p.599). The following steps proposed by Von Winterfeldt (1986) were followed to apply the MAUT procedures:
1. Evaluate each alternative separately on each attribute to determine utility scores 2. From each decision-maker, elicit weights of the attributes
3. For each decision-maker, use the resulting multi-attribute function to compute the overall utility of each system using the linear additive model (Equation 1):
( ) ∑ ( )
33 Where
( )
∑
Each alternative was scored on each attribute using manufacturer’s specifications provided through market research and phone calls with vendors. Although manufacturers’ specifications have not been verified by independent lab testing, the focus of this research is on the model and assumes values are accurate. The United States Army Tank Automotive Research, Development and Engineering Center conducts testing on water purification systems, however the four alternatives selected were either not tested or have been modified since their last test. The current Combined Arms Support Command water purification study also includes some alternatives from this study, but due to funding, testing has been postponed until fiscal year 2015. Once the laboratory testing of the alternatives is completed, the MAUT model developed in this research can be updated.
Elicitation of Individual Attribute Utilities
Utilities for each attribute were elicited by one expert using two methods: the direct rating method and the probability equivalent method. Only one person was interviewed to elicit utilities for all attributes based on his experiences working in the SOF environment, multiple deployments to
34
were established for each attribute in order to transform qualitative data into quantitative data. The utility elicitation interview consent form and questions are listed in Appendices B and C.
Both utility elicitation methods were conducted during the same two-hour interview period. Before the interview, the interviewee was provided an operational scenario document that was developed to reduce bias by identifying a particular case where a purifier would be used (Box 1).
Box 1. Operational Scenario for Use of Small Unit Water Purifier
1 Portability: During operation, the purifier would be stationary; however, based on mission
requirements, the system needs to be portable when not in use. Platforms to transport the system may include mounting on a vehicle or trailer, or via sling load from a helicopter. Lifting the system onto the transportation platform will be done by soldiers. According to the Military Standard 1472-G, a two person lift should not exceed 174 pounds, and limits a one person lift to 87 pounds when placing the item on a surface not greater than 3 feet above the floor (Department of Defense Design Criteria Standard Human Engineering, 2012)(Bray, Rae Olmsted, Williams, Sanchez, & Hartzell, 2006).
2 Water Quality: Water sources within villages can include existing wells, contracted delivery of local
water, or surface water. Water quality is assumed questionable, making it essential to remove all hazardous toxins to include microbial and chemical contaminants in order to prevent any detriment to the overall health of SOF personnel.
3 Daily Water Requirement: The minimum potable water requirement per soldier per day was
approximately 8.5 gallons (32 Liters) and included considerations for drinking, personal hygiene, field feeding, heat injury treatment, vehicle maintenance, and medical treatment. Based on a VSO team of eight to twelve men, the daily demand from a water purifier ranges between 68 and 102 gallons (258 to 387L) (CASCOM, 2008).
4 Length of Mission: Village stability operations (VSO) usually range from 30 days to six months. The
water purification system is assumed to be the only source of potable water with limited resupply of system components. Therefore each system and accessories must adequately provide all water requirements for initial 30 days of mission with resupply anticipated for the remaining five months.
5 Durability: Based on the climate of the operational environment, the water purification system must be
durable enough to withstand extremely high or low temperatures, as well as rough handling or transport via multiple platforms such as air, water, or vehicle.
6 End User: Based on the small size of a VSO team, each member of the team may be required to set up,
operate, or monitor the SUWP at any given time, regardless of his knowledge of water purification processes. Prior to deployment, training opportunities may be limited based off time and resources, making the ease of system use important. During missions, knowing when to shut down if water quality or system is compromised is essential for all team members.
7 Location: VSO teams are usually embedded within rural communities. Based on location of larger
35
The direct rating process consisted of showing the interviewee one notecard for each of the four alternatives’ performance on specific attributes. Figure 7 shows the notecards and questions used to determine the utility score for the attribute of weight. Systems were randomly labeled, and the expert had to first rank the four options from best to worst. Once cards were lined up from best to worst, the expert then scored the systems using the best and worst systems as the anchors. The best system was given a score of 100, and the worst system was scored 0. After the worst system was scored, the intermediate two systems were scored between the anchor scores.
Figure 7. Notecards and questions used during direct rating utility elicitation for the attribute of weight
After the initial scoring process, a consistency check was conducted to ensure all intermediate values were accurately scored. The consistency check was a series of questions confirming the
36
1. Read back and confirm each system scores and rankings with interviewee.
2. Ask the expert “You rated system B halfway between system C and D. Is this correct?” (this is to confirm the difference in points accurately portray expert’s preference)
3. Ask the expert “Given a new system that weighs 90 pounds, where would you rank and score it?” (this is to confirm it would be ranked between the systems A and C above)
This process was performed for all nine attributes. One attribute, filter life, required two rounds of scoring to address both general and challenge water. The scores were then averaged to provide only one score for the filter life attribute per alternative.
The probability equivalent method (PEM) interview was conducted after a short break. In this method, the expert was given a choice of either a lottery between the highest and lowest scoring system in each attribute, or the intermediate system (Figure 8).
Figure 8. Probability equivalent method used to elicit utility score for the attribute of weight
37 Elicitation of Stakeholders’ Weights
Weighing was conducted to identify the range of importance for each attribute. Prior to any weighting interviews, the same operational scenario (Box 1) provided during the utility interviews was also provided for the weight interviews. This was to reduce the chance of stakeholders weighting attributes based on general importance instead of a specific situation. Weights were established using two different methods, SMARTS and SMARTER. The same experts in Table 4 were interviewed based on their knowledge and expertise in their respective disciplines and organizations.
Interviews were conducted over a five week period and were either conducted in person or over the phone depending on location of voters. Similar to the utility elicitation method, the order of
attributes was randomized for each interview. Prior to starting the interviews, Edwards and Barron’s 1994 swing weighting example of purchasing a car (Appendix C) was used to explain the swing weighting process to the stakeholders (Edwards & Barron, 1994).
38
Table 9. Listing of attributes and descriptions provided to stakeholders prior to the weighting interview process
The first step in the interview was to ask the respondents to rank each attribute compared to a hypothetical system that had the worst score in every attribute. This was illustrated using an excel spreadsheet that listed the worst scores and the best scores for each attribute. The worst scores were shaded to construct the hypothetical system (Table 10).
Attribute Description
Chemical Reduction Aequate technology to meet NSF/ANSI Protocols 53 and 58 for reduction of chemical contaminants
Microbial Reduction Ability to meet NSF/ANSI Protocol 248 for
reduction of microbiological contaminants
Weight Total weight is < 80 pounds including all accessories for initial operation through 30 days
Filter Life
Filter has ablilty to treat enough water for 20 Soldiers in first 72 hours/30 days - based off 8.5 gal/day per Soldier: 170 gal/day/arid envir with 20 Soldiers for 3 days= 510 gallons (1931L); 30 days =5100 gallons( 19310L)
Temperature Range Ability to operate from from 30 - 120⁰ F or 0 - 140 ⁰F
(optimal)
Disinfection Technology Must not require follow-on disinfection for
potability
Safety Features Have an automatic shutoff at the end of element life to prevent production of contaminated water.
Monitoring Ability to provide visual and audible monitoring feedback
Production Rate
39
Table 10. Best and worst scores for each attribute illustrating hypothetical system that performed the worst in all attributes (shaded cells)
Respondents were asked the following questions:
Given the above hypothetical system (shaded cells) that has the worst score in every attribute (highlights scores), if you could only choose one attribute to improve from worst to best , which one would it be (rank #1)? What is the next attribute you would improve from worst to best (rank #2)? Continue until all attributes are ranked from 1-9 (benchmark will rank 10th)
After the first step, interviewee’s responses were read back to them to confirm their rankings. If at any point they wished to change their respsonse, they were given the chance. They were also asked to explain their reasoning on why they ranked attributes in the order they chose. Once the stakeholders confirmed their rankings were accurate, they moved onto the next step. If at any point during the process a stakeholder was confused, he was able to stop and ask questions to confirm his understanding of the process. The second step of the interview involved rating attributes. Stakeholders were asked to complete the following:
Rate your hypothetical system 0 and your top attribute 100. Based off the swing in each attribute from worst to best, rate each attribute against the top ranked attribute swing from step one. Rate other attributes between 0 and 100. Rating corresponds with % of value by changing each attribute.
Ex. Rating attribute 50 means improving attribute ranked from worst to best is worth 50% value from improving the #1 choice. Comments: You may rate attributes the same if you feel the swings in attributes are equal when compared to the #1 attribute swing.
Attribute Worst Scores Best Scores
Weight 118 pounds 75 pounds
Safety Features (Auto shutdown) Flow rate stops when filter is clogged
Two-stage protective shutdown circuit, automatically shuts down in the event of a failure in the disinfecting process, pump stops and a valve will close, stopping any more water from passing through the system.
Production Rate .14 gallons per minute/ 200 gallons per day 1.95 gallons per minute/1,170 gallons per day Operating Temperature 41 ⁰F -100.4 ⁰F -22 ⁰F - 158 ⁰F
Monitoring Pressure gage shows reduction in flow rate Field integrity test (FIT) for filter devices; can test membrane at anytime
Microbial Reduction 99.99% reduction for bacteria and virus. No independent
lab testing conducted. Passed NSF P248 Protocol - 1 Mar 2013 Filter Life (measured by number
of liters until filter change)
General water: 7,926 gallons Challenge water: 2,641
General water: 26,410 gal Challenge water:7,396 gal
Disinfection Technology Does not hav UV, Requires disinfection UV with optional chlorine injection
Chemical Reduction
• Multi-stage Cartridge and Carbon Filtration •2 Pre-filters (carbon core with nanomesh) • Main nanomesh filter
System meets NSF/ANSI 53 Standard for Health Effects
40
The more indifferent you are between the worst/best score, the lower the rating would be. A higher rating signals a higher perceived significance of the attribute swing from low to high.
Similar to the previous step, once all scores were provided, scores were read back to the
interviewee to confirm his ratings. Comparisons between scored attributes were made to ensure ratings accurately reflected the stakeholder’s preferences. A consistency check was conducted using similar questions from the utility interviews previously listed. Once all ratings were confirmed, the interview was complete. The final step of normalizing the scores did not require stakeholder feedback. The weight interview format is listed in Appendix C.
Initially, only the SMARTS method was to be used, however, after piloting the interview, respondents found the swings in SMART difficult to understand. The interview format was revised to reduce confusion by providing Edwards and Barron’s (1994) car purchasing example and the rank order centroid method (ROC) was implemented during data analysis. Because stakeholders ranked attributes in the first step of swing weighting, these rankings were used to calculate ROC scores. This additional step did not add any time to the interview and provided a consistency check on the responses, which were consistent between methods without any additional follow up required.
Throughout the decision making process, several steps were taken to reduce any
41
chance of general importance weights before starting utility and weight interviews. During the utility interviews, index cards were utilized to simplify the process and help the voter visualize his options. The order of the attributes was randomized for each interview, and a consistency check was conducted by asking for voter explanations and confirming his responses. Each time an inconsistency was identified, the voter was asked to reconsider his response, which resulted in modified results.
Aggregate Utility and Weight Scores of Each Alternative
After obtaining utility and weight measurement scores, they were aggregated using the linear additive model (Equation 1).
( ) ( ) ∑ ( )
( 1 )
where
( )
( )
Inserting individual attribute utility functions for the attributes defined in Table 7 into Equation 1 yields:
( ) ( ) ( )
( ) ( ) ( )
( ) ( )
( ) ( )