Research Article
Determination of Cobalt in Seawater Using Neutron
Activation Analysis after Preconcentration by Adsorption
onto
𝛾
-MnO
2
Nanomaterial
Van-Phuc Dinh
,
1Ngoc-Chung Le,
2Ngoc-Tuan Nguyen,
3Quang-Thien Tran,
3Van-Dong Nguyen,
4Anh-Tuyen Luu,
5N. Quang Hung,
6Tran Duy Tap,
4and Thien-Hoang Ho
11Dong Nai University, 4 Le Quy Don, Tan Hiep Ward, Bien Hoa City, Dong Nai Province, Vietnam 2Dalat University, Dalat City, Lam Dong Province, Vietnam
3Nuclear Research Institute, Dalat City, Lam Dong Province, Vietnam
4University of Science, Vietnam National University, Ho Chi Minh City, Vietnam
5Center for Nuclear Techniques, Vietnam Atomic Energy Institute, Ho Chi Minh City, Vietnam
6Institute of Fundamental and Applied Sciences, Duy Tan University, 3 Quang Trung, Da Nang City, Vietnam
Correspondence should be addressed to Van-Phuc Dinh; [email protected]
Received 14 September 2017; Revised 4 January 2018; Accepted 28 January 2018; Published 22 February 2018
Academic Editor: Jean-Marie Nedelec
Copyright © 2018 Van-Phuc Dinh et al. This is an open access article distributed under the Creative Commons Attribution License, which permits unrestricted use, distribution, and reproduction in any medium, provided the original work is properly cited.
The𝛾-MnO2nanomaterial has been used to adsorb cobalt in the seawater at Phan Thiet City, Binh Thuan Province, Vietnam. Its concentration is determined by using the neutron activation analysis (NAA) method at the Dalat nuclear research reactor. Factors affecting the uptake of cobalt on the𝛾-MnO2material such as the pH, adsorption time, and initial cobalt(II) concentration are investigated. The irradiated experiment data are calculated using the K0-Dalat program. The results obtained show that the trace dissolved cobalt in Phan Thiet seawater is found equal to 0.25±0.04𝜇g/L (𝑛 = 5,𝑃 = 95%) with the adsorption efficiency being higher than 95% (𝑛 = 4,𝑃 = 95%).
1. Introduction
Cobalt is an essential micronutrient and the central metal cofactor in the Vitamin B12 [1]. It can be found in the biological and environmental samples, such as fish, egg, milk, green vegetable, and seawater. In seawater, dissolved cobalt (DCo) exists mainly as a cobalt(II) ion in chloro-carbonate complexes [2] and bound to organic ligands [3]. Although the concentration of DCo in seawater is rather low, it can affect the growth rate of coccolithophorids and cyanobacteria, some metabolic processes, the phytoplankton community structure, and the carbon flux at the atmosphere-ocean interface [4]. In addition, the concentration of DCo in seawater, which can vary differently depending on the human activities at different ocean regions such as dust, mineral
activity, and industry, can lead to the unpredictable effects on environment and food resources. Therefore, determination of the DCo concentration in seawater has recently become an important topic for interdisciplinary researches including physics, chemistry, and environment. However, it is difficult to determine directly the total DCo in seawater by the most commonly used instrumental analytical methods due to their limited sensitivity and/or matrix effects. Therefore, the separation of cobalt from the sample matrices as well as the preconcentration of cobalt is crucial for the accurate and efficient determinations of cobalt at the ultratrace levels in seawater. Various methods in addition to the modern instrumental methods have been used to enrich the level of cobalt in seawater, such as the coprecipitation [2], liquid-liquid phase extraction [5], and solid phase extraction [6, 7].
Neutron activation analysis (NAA) is a sensitive and spe-cial method for determining simultaneously a large number of elements [8]. One of the advantages of the NAA method over the common spectrometric methods is that it allows us to directly analyze the samples in original forms without the use of dissolution steps that may cause the sample dilution and contamination. Within the NAA, the preconcentration of the trace elements from the aqueous samples such as seawater absorbed on solid materials is usually preferred among the other methods. However, a drawback of this method is that it is not able to analyze the water samples since the radiolysis of water itself may cause a release of radiogas or even an explosion out of the container [9]. Hence, the adsorption used to preconcentrate the elements from the water onto the solid phase is a promising method for the detection of trace elements in seawater as well as in other solutions. Some adsorbents have been used for these preconcentration steps such as the magnesium oxide [9], charcoal [10–14], and aluminium and iron(III) oxides [15]. However, the use of nanooxide as an adsorbent material for the retention of trace elements from seawater before being determined by the NAA method has still been limited so far.
In fact, the nanomaterials, which have their own physic-ochemical properties and therefore differ from the nonnano-materials, have been applied to a variety of areas. Among the nanomaterials, the manganese oxides with various types of crystalline structures, such as𝛼-,𝛽-, 𝛾- MnO2, have been extensively studied owing to their structural varieties and excellent chemical characteristics. As a result, they have been applied to different areas such as batteries, molecular sieves, catalysts, and adsorbents [16, 17]. However, the use of 𝛾 -MnO2nanomaterial as a solid phase for the preconcentration of cobalt from seawater has still been rarely studied.
In the present work, the𝛾-MnO2nanomaterial is used as a preconcentration agent to extract cobalt from the seawater collected at Hon Rom Beach, Phan Thiet City, Binh Thuan Province, Vietnam, before applying the NAA method to determine its concentration. Furthermore, factors affecting the adsorption capacity of this nanomaterial such as the pH, adsorption time, and initial cobalt concentration are also investigated within the present work.
2. Experimental Method
2.1. Reagents and Materials. The cobalt(II) ion is used as an adsorbate. A 1000 mg/L standard stock solution containing each set of cobalt(II) ions is prepared by dissolving the Co(NO3)2 (Merck, pa) in the double-distilled water. The HNO3 (Merck, pa) and NaOH (Merck, pa) are then used to adjust the pH of the solution. The𝛾-MnO2 nanomaterial is synthesized via the reaction between the potassium per-manganate (KMnO4) (Merck, pa) solution and the ethanol (C2H5OH) (Merck, pa) at the room temperature as reported previously in [17, 18]. A 300 ml potassium permanganate (KMnO4) saturated solution is gradually placed into a 300 ml of the mixture between the ethanol (C2H5OH) and the distilled water, which is then strongly agitated during 8 h. The obtained solid precipitate is dried at 100∘C in 12 h. After that
Figure 1: Hon Rom Beach, Phan Thiet City, Binh Thuan Province, Vietnam, where the seawater samples are collected.
it is cleaned several times by using the distilled water in order to get the𝛾-MnO2products.
Seawater, collected from the Hon Rom Beach, Phan Thiet City, Binh Thuan Province, Vietnam, at the position of 10∘57N-108∘19W (see Figure 1), is filtered through 0.2𝜇m Sar-tobran 300 cartridges (Sartorius), which are later used for the DCo analyses. The samples are collected in the acid cleaned 250 mL LDPE Nalgene bottles, which are rinsed 5 times together with the samples before the collection. After that, the processes are similar to those presented in Section2of [19], except that HNO3at 0.01 M (Merck) has been used to acidify the samples within an hour instead of using ultrapure HCl as in [19].
Table 1: Isotherm equilibrium parameters calculated from different models.
Models Equations Parameters RMSE 𝜒2
Langmuir 𝑞𝑒= 𝑄max⋅ 𝐾𝐿⋅ 𝐶𝑒
1 + 𝐾𝐿⋅ 𝐶𝑒 𝑄max(mg/g): 90.91 𝐾𝐿(L/mg): 0.5430 1.999 0.2918
Freundlich 𝑞𝑒= 𝐾𝐹⋅ 𝐶𝑒1/𝑛 𝐾𝐹(Log/g): 63.82 1/n:0.0769 2.233 0.3418
Sips 𝑞𝑒= 𝑄𝑆⋅ 𝐶𝑒
𝛽𝑆
1 + 𝛼𝑠⋅ 𝐶𝑒𝛽𝑆 𝑄𝑠(mg/g): 95.00 𝛼𝑠(L/mg): 0.9810 𝛽𝑠: 0.5694 1.593 0.1751
Notations.𝑞𝑒: adsorption capacity at equilibrium (mg/g);𝐶𝑒: equilibrium concentration (mg/L);𝑄max: monolayer maximum adsorption capacity (mg/g);
𝐾𝐿: Langmuir constant;𝐾𝐹: Freundlich constant;𝑛: adsorption intensity;𝑄𝑆: the maximum adsorption capacity (mg/g);𝛼𝑠: Sips isotherm model constant
(L/mg);𝛽𝑠: Sips isotherm model exponent; RMSE: root-mean-square error(RMSE = √(1/(𝑛 − 1)) ∑𝑛𝑛=1(𝑞𝑒,meas− 𝑞𝑒,calc)2);𝜒2: nonlinear chi-square test
(𝜒2= ∑𝑛𝑛=1(𝑞𝑒,meas− 𝑞𝑒,calc)2/𝑞𝑒,calc).
2.3. Adsorption Study. A 0.1 gram of the nanomaterials is placed into a 100 mL conical flask containing 50 mL of the cobalt(II) ions. The influences of pH (2–5.5), adsorption time (10–240 min), and metal ion concentrations (40–400 mg/L) on the nanomaterials are also studied. The concentrations of cobalt(II) ions before and after the adsorption process are determined by using the atomic absorption spectroscopy method. The adsorption ability of the𝛾-MnO2nanomaterial is calculated as [27]
% Removal= (𝐶𝑜− 𝐶𝑒) × 100%
𝐶𝑜 , (1)
whereas the adsorption capacity can be obtained from the mass balance equation for the adsorbent as [27]
𝑞 = (𝐶𝑜− 𝐶𝑒) × 𝑉
𝑚 , (2)
whereqis the adsorption capacity (mg/g) at the equilibrium andCoandCeare the initial and equilibrium concentrations
(mg/L), respectively.Vis the volume (L) of the solution and
m is the mass (g) of the adsorbent used. In fact, several adsorption isotherm equations [28] have been applied in the present work in order to assess the adsorption ability of the
𝛾-MnO2 materials as well as the nature of the uptake as presented in Table 1.
2.4. Neutron Activation Analysis. A 1-gram𝛾-MnO2is added to 1.5 liters of seawater and they are mixed by magnetically stirring at the speed of 240 rpm in 120 mins. The solid is collected via the filtration process and dried at 80∘C in 24 hours. An accurate weight of the dried𝛾-MnO2 is packed and sealed in the polyethylene containers and then irradiated in the core of the Dalat nuclear research reactor with the neutron flux of 3.1012n/cm2⋅s in002010 hours. After 30 days of radioactive decay, the samples are measured during 18000 sec in order to determine the cobalt concentration. To control our experimental method, the standard-addition technique has been used by placing 1.0 gram of𝛾-MnO2with 1.5 liters of seawater, which contain 10, 15, and 20𝜇g of cobalt standard solution. The time for the added cobalt being equilibriated in seawater is 10 mins at the room temperature. The preparation, irradiation, and decaying and measuring times are kept to be the same as for the above samples.
10 20 30 40 50 60 70
Intensity (a.u.)
25 30 35 40 45 50 55 60 65 70 75 80
20
2-theta (deg.)
22.2∘
37.8∘
42.5∘
56.3∘
65.7∘
-MnO2
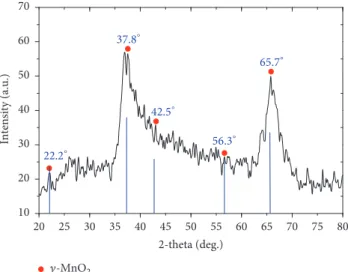
Figure 2: The XRD spectrum of the𝛾-MnO2nanomaterial.
2.5. Gamma Activity Measurement. In order to measure the activated samples, we employ the calibrated gamma-ray spectrometers based on the HPGe detectors (ORTEC, GMX-30190 model) with the acquisition software provided by CANBERRA Genie-2K. The K0-Dalat program [29, 30] is applied to calculate the elemental concentrations, the uncer-tainties, and the detection limits.
3. Results and Discussion
3.1. Characterization of the𝛾-MnO2Nanomaterial. Shown in
Figure 2 are the XRD patterns of the𝛾-MnO2nanostructure. As can be seen in this Figure 2, some specific peaks are developed at the different angles 2𝜃equal to 22.2∘, 37.8∘, 42.5∘, 56.3∘, and 65.7∘. These peaks are certainly associated with the orthorhombic structure of the𝛾-MnO2material (JCPDS card number 82-2169).
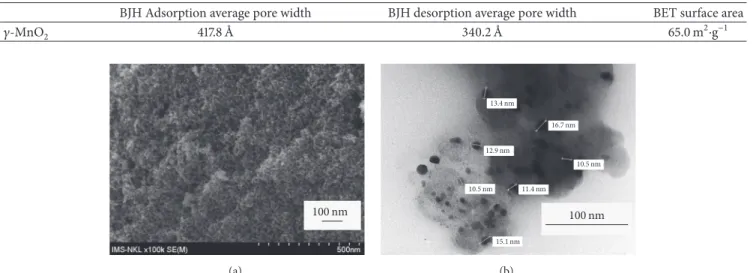
Figure 3 presents the SEM (a) and TEM (b) images of
𝛾-MnO2. These figures clearly show a porous surface, which includes many nanospheres with diameters from 10 nm to 80 nm. These results indicate that the 𝛾-MnO2 nanomaterial might offer more adsorption sites for the adsorbates.
Table 2: The BET and BJH analytical results.
BJH Adsorption average pore width BJH desorption average pore width BET surface area
𝛾-MnO2 417.8 ˚A 340.2 ˚A 65.0 m2⋅g−1
100nm
(a)
13.4nm
16.7nm
12.9nm
10.5nm
10.5nm 11.4nm
15.1nm
100nm
(b)
Figure 3: SEM (a) and TEM (b) images of the𝛾-MnO2nanomaterial.
seen that the surface area of𝛾-MnO2is about 65 m2/g with a pore size smaller than 500 ˚A and larger than 20 ˚A, which corresponds to the size of the mesoporous materials [32].
3.2. Factors Affecting the Adsorption of Cobalt. The pH is one of the essential factors, which affects the adsorption of the cobalt(II) ion onto the𝛾-MnO2nanomaterials. As can be seen in Figure 4(a), at the low pH values, the uptake of cobalt(II) ion on the material surfaces decreases because of two main reasons. The first reason is due to the charge of the material surface, which is positive and is not favorable for the uptake of Co(II) cation [33–38]. The second reason is that there is a competition between the H+ and Co2+ ions [37, 38]. At the high pH values, the adsorption of cobalt(II) ion reaches a plateau due to the formation of different types of cobalt(II) such as Co(OH)+ and Co(OH)2, which inhibit the adsorption of Co2+ ions on𝛾-MnO2 [39]. Therefore, a range of pH values has been chosen from 2.0 to 5.5 in order to achieve the optimum adsorption of cobalt. As a result, the maximum adsorption is obtained at pH ≥ 4.0 with an approximate removal of 98.8% at the initial cobalt concentration of 150 mg/L.
The effects of pH and contact time on the adsorption of Co(II) onto the𝛾-MnO2nanomaterial are shown in Figures 4(a) and 4(b), respectively. These figures show that the adsorption increases with increasing both the pH and the contact time and reaches the equilibrium after 120 mins at the pH value of 4 despite different initial cobalt concentrations. Hence, 120 mins of adsorption time has been chosen for adsorbing cobalt from the seawater samples. Moreover, it can be seen also from these figures that the higher the initial concentration of Co(II) is, the lower the adsorption rate of Co(II) onto the𝛾-MnO2nanomaterial is achieved. This result can be explained by the saturation of the binding-sites of the nanomaterial when the concentration is increasing.
3.3. Adsorption Isotherm Studies. Figure 5 shows the plots of the Langmuir, Freundlich, and Sips nonlinear isotherm
models, whose parameters are given in Table 1. It is known that the Langmuir model assumes the uptake of cobalt(II) on the𝛾-MnO2 nanomaterial to be monolayer adsorption. On the other hand, the Freundlich model is based on the assumption that the adsorption of cobalt(II) ions should be with multilayers and there is an interaction between the adsorbate and absorbent. However, both of models above are restricted by the solute concentrations. Therefore, the Sips equation, which combines the Langmuir and Freundlich models, has been proposed in order to describe well the uptake of cobalt(II) onto the𝛾-MnO2nanomaterial. By com-paring the results obtained from the root-mean-square error (RMSE) with the corresponding𝜒2 values, it is found that the Sips model offers the best fit to experimental data as this model has the smallest RMSE and𝜒2values among the other two Langmuir and Freundlich models. The monolayer adsorption and adsorption capacities calculated from the Langmuir and Sips models are 90.91 mg/g and 95.00 mg/g, respectively. These results indicate that the𝛾-MnO2 nanoma-terial can be used as an adsorbent to extract and concentrate the cobalt ions from the water samples.
0 1 2 3 4 5 6 7 0 20 40 60 80 100 % removal pH 300mg/L 150mg/L (a) 60 80 100 % removal 150mg/L 170mg/L 220mg/L
50 100 150 200 250 300
0
Time (mins)
(b)
Figure 4: Effects of pH (a) and contact time (b) on the adsorption of Co(II) onto the𝛾-MnO2nanomaterial at different initial concentrations of cobalt.
0 30 60 90 120 150
60 70 80 90 100 Experiment Langmuir Freundlich Sips qe (m g/g)
Ce(mg/L)
Figure 5: Plots of the adsorption capacity at the equilibrium
q𝑒 versus the equilibrium concentration C𝑒 obtained within the Langmuir, Freundlich, and Sips nonlinear isotherm models.
make some particulate materials and/or dissolved organic ligands depending on the complexation kinetics and time for which the added cobalt can be exposed to the seawater. How-ever, this effect, which might cause the change of the analyti-cal results, is considered to be relatively small since the dissol-ubility of the solution used in the present study (10–20𝜇g/L) is rather high and the seawater samples before being ana-lyzed are carefully filtered and acidified as described in Section 2.1.
3.5. Comparison with Other Studies. Table 5 presents the content of cobalt in seawater at some areas in the world determined by the same and/or different methods. It is found that the concentration of DCo in the surface seawater at
0 20 40 60 80 100 Energy (keV) Zn-65 Co-60 Co-60 0 200 400 600 800 1000 1200 Co u n ts Co u n ts
500 1000 1500 2000
0
Energy (keV)
1100 1150 1200 1250 1300 1350
1332.5keV
1173.2keV
1115keV
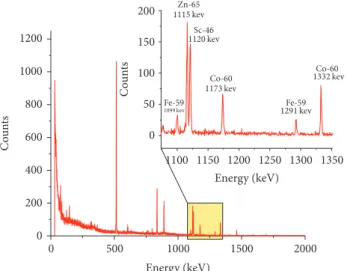
Figure 6: Gamma-ray spectrum of the 𝛾-MnO2 nanomaterial before the adsorption of elements in the seawater.
0 500 1000 1500 2000
0 50 100 150 200 Energy (keV) Sc-46 Zn-65 Co-60 Co-60 Fe-59 Fe-59 C o un ts 0 200 400 600 800 1000 1200 C o un ts Energy (keV)
1100 1150 1200 1250 1300 1350
1291kev 1099kev 1173kev 1332kev 1115kev 1120kev
Table 3: Analytical results for cobalt in seawater.
Element Co(II) added
(𝜇g/L) Found (𝜇g/L) SD Recovery (%)
Cobalt
0 0.25 ± 0.05(𝑛 = 5,𝑃 = 0.95) 0.04
10 10.1 ± 1.16(𝑛 = 4,𝑃 = 0.95) 0.73 98.80 15 14.8 ± 1.08(𝑛 = 4,𝑃 = 0.95) 0.68 96.93 20 21.1 ± 2.77(𝑛 = 4,𝑃 = 0.95) 1.74 104.00
SD: standard deviation.
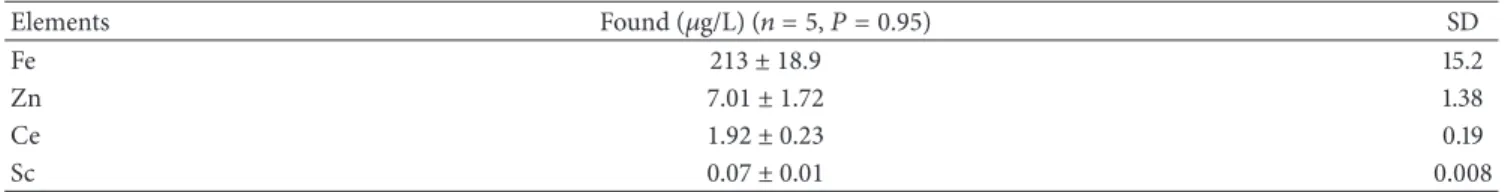
Table 4: Elements found in seawater by using the NAA method.
Elements Found (𝜇g/L) (𝑛 = 5,𝑃 = 0.95) SD
Fe 213 ± 18.9 15.2
Zn 7.01 ± 1.72 1.38
Ce 1.92 ± 0.23 0.19
Sc 0.07 ± 0.01 0.008
SD: standard deviation.
Table 5: Content of cobalt in the seawater at some areas in the world obtained within the same and/or different analytical methods. Here GFAAS and SF-ICP-MS stand for graphite furnace atomic absorption and sector field inductively coupled plasma mass spectrometers, respectively.
Area DCo (𝜇g/L) Analytical methods Ref.
Mediterranean Sea 0.02 SF-ICP-MS [19]
Bosphorus 4.28 GFAAS [20]
South East Atlantic 0.30⋅10−3–3.48⋅10−3 Flow-Injection Analysis (FIA) and chemiluminescence [21] Crozet Islands, Southern Ocean 1.42⋅10−3–2.89⋅10−3 ICP-MS [22] Western Atlantic Ocean 0.83⋅10−3–5.85⋅10−3 Chemiluminescence [23] North Atlantic gyre, Atlantic Ocean 1.38⋅10−3 FIA with chemiluminescence [24] South Atlantic gyre, Atlantic Ocean 3.25⋅10−3 FIA with chemiluminescence [24] Angola Gyre, Atlantic Ocean 0.71⋅10−3–9.74⋅10−3 Ultrahigh resolution mass spectrometry [25]
Binh Thuan, Vietnam 0.25 NAA This study
Binh Thuan coast, Vietnam, obtained within the present work is 0.25𝜇g/L. This amount is higher than the results obtained from some different locations in the world such as Mediterranean Sea [19], South East Atlantic [21], Crozet Islands, Southern Ocean [22], Western Atlantic Ocean [23], North and South Atlantic gyre of Atlantic Ocean [24], and Angola Gyre of Atlantic Ocean [25], except the Bosphorus area [21] (see Table 5). The reason is that the seawater samples used in the present analysis are collected from the beach, which is located near the residential area that might cause the increase in the level of cobalt.
4. Conclusions
The neutron activation analysis method at the Dalat nuclear reactor (Vietnam) has been used to determine the concen-tration of dissolved cobalt in the seawater at Phan Thiet City, Binh Thuan Province, Vietnam, after the preconcen-tration by adsorption onto the𝛾-MnO2 nanomaterial. The concentration of dissolved cobalt in the surface seawater is found to be 0.25± 0.04𝜇g/L (𝑛 = 5, 𝑃 = 0.95) with the
approximate recovery of 96.93%–104% (𝑛 = 4,𝑃 = 0.95). In addition, some elements and their concentrations have been newly determined, namely, Fe (212𝜇g/L), Zn (7.01𝜇g/L), Ce (1.92𝜇g/L), and Sc (0.07𝜇g/L). All the results obtained show that the 𝛾-MnO2 nanomaterial can indeed be used as an adsorbent to preconcentrate the trace elements from the water samples before being determined by the neutron activation analysis method.
Conflicts of Interest
The authors declare that there are no conflicts of interest regarding the publication of this paper.
References
[2] Q. Zhang, H. Minami, S. Inoue, and I. Atsuya, “Determination of ultra-trace amounts of cobalt in seawater by graphite fur-nace atomic absorption spectrometry after pre-concentration with Ni/8-quinolinol/1-nitroso-2-naphthol complex,”Analytica Chimica Acta, vol. 407, no. 1-2, pp. 147–153, 2000.
[3] J. Bown, M. Boye, and D. M. Nelson, “New insights on the role of organic speciation in the biogeochemical cycle of dissolved cobalt in the southeastern Atlantic and the Southern Ocean,”
Biogeosciences, vol. 9, no. 7, pp. 2719–2736, 2012.
[4] C. E. Thur´oczy, M. Boye, and R. Losno, “Dissolution of cobalt and zinc from natural and anthropogenic dusts in seawater,”
Biogeosciences, vol. 7, no. 6, pp. 1927–1936, 2010.
[5] M. R. Jamali, B. Soleimani, R. Rahnama, and S. H. A. Rahimi, “Development of an in situ solvent formation microextraction and preconcentration method based on ionic liquids for the determination of trace cobalt (II) in water samples by flame atomic absorption spectrometry,”Arabian Journal of Chemistry, vol. 10, pp. S321–S327, 2017.
[6] Y. Wang, X. Ke, X. Zhou, J. Li, and J. Ma, “Graphene for separation and preconcentration of trace amounts of cobalt in water samples prior to flame atomic absorption spectrometry,”
Journal of Saudi Chemical Society, vol. 20, pp. S145–S152, 2016. [7] S. Hirata, Y. Hashimoto, M. Aihara, and G. Vitharana Mallika,
“On-line column preconcentration for the determination of cobalt in sea water by flow-injection chemiluminescence detec-tion,”Fresenius’ Journal of Analytical Chemistry, vol. 355, no. 5-6, pp. 676–679, 1996.
[8] D. F. Schutz and K. K. Turekian, “The investigation of the geographical and vertical distribution of several trace elements in sea water using neutron activation analysis,”Geochimica et Cosmochimica Acta, vol. 29, no. 4, pp. 259–313, 1965.
[9] J. M. Lo, K. S. Lin, J. C. Wei, and J. D. Lee, “Evaluation on chemical neutron activation analysis for trace metals in sea-water using magnesium oxide as the preconcentration agent,”
Journal of Radioanalytical and Nuclear Chemistry, vol. 216, no. 1, pp. 121–124, 1997.
[10] E. H¨as¨anen and P. Manninen, “Determination of total organic chlorine and bromine in water samples by adsorption onto acti-vated carbon and neutron activation analysis,” Chemosphere, vol. 16, no. 5, pp. 969–972, 1987.
[11] Y. Sakai, T. Tomura, K. Ohshita, and S. Koshimizu, “Determi-nation of trace copper in water samples by neutron activation analysis preceded by preconcentration on activated carbon powder,”Journal of Radioanalytical and Nuclear Chemistry, vol. 230, no. 1-2, pp. 261–263, 1998.
[12] H. A. Van Der Sloot, “The determination of chromium in water samples by neutron activation analysis after preconcentration on activated carbon,”Journal of Radioanalytical Chemistry, vol. 37, no. 2, pp. 727–739, 1977.
[13] A. M. Yusof, M. M. Rahman, and A. K. H. Wood, “Speciation of some trace elements in water samples after preconcentration on activated carbon by neutron activation analysis,”Journal of Radioanalytical and Nuclear Chemistry, vol. 259, no. 3, pp. 479– 484, 2004.
[14] M. T. Valentini Ganzerli, L. Maggi, and V. Caramella Cresp, “Preconcentration and neutron activation analysis of thorium and uranium in natural waters,”Journal of Radioanalytical and Nuclear Chemistry, vol. 262, no. 1, pp. 143–146, 2004.
[15] U. Kerdpin, O. A. Arquero, R. Watanesk, and U. Sriyotha, “Manganese (II) adsorption stdudies on Aluminium oxide and Iron (III) oxide by neutron activation analysis,”Journal of the Science Society of Thailand, vol. 24, pp. 73–80, 1998.
[16] J. Li, B. Xi, Y. Zhu, Q. Li, Y. Yan, and Y. Qian, “A precursor route to synthesize mesoporous 𝛾-MnO2 microcrystals and their applications in lithium battery and water treatment,”Journal of Alloys and Compounds, vol. 509, no. 39, pp. 9542–9548, 2011. [17] N. C. Le and D. Van Phuc, “Sorption of lead (II), cobalt
(II) and copper (II) ions from aqueous solutions by𝛾-MnO2 nanostructure,”Advances in Natural Sciences: Nanoscience and Nanotechnology, vol. 6, no. 2, Article ID 025014, 2015.
[18] V. P. Dinh, N. C. Le, L. A. Tuyen, N. Q. Hung, V. D. Nguyen, and N. T. Nguyen, “Insight into adsorption mechanism of lead(II) from aqueous solution by chitosan loaded MnO2 nanoparticles,”Materials Chemistry and Physics, vol. 207, pp. 294–302, 2018.
[19] G. Dulaquais, H. Planquette, S. L’Helguen, M. J. A. Rijkenberg, and M. Boye, “The biogeochemistry of cobalt in the Mediter-ranean Sea,”Global Biogeochemical Cycles, vol. 31, no. 2, pp. 377– 399, 2017.
[20] O. G. Saglam and U. Koklu, “Atomic absorption spectrometric determination of cobalt and nickel after preconcentration by the application of chelate adsorption on amino-modified silica-gel,”
Journal of Trace and Microprobe Techniques, vol. 21, no. 2, pp. 249–257, 2003.
[21] J. Bown, M. Boye, A. Baker et al., “The biogeochemical cycle of dissolved cobalt in the Atlantic and the Southern Ocean south off the coast of South Africa,”Marine Chemistry, vol. 126, no. 1-4, pp. 193–206, 2011.
[22] M. Castrillejo, P. J. Statham, G. R. Fones, H. Planquette, F. Idrus, and K. Roberts, “Dissolved trace metals (Ni, Zn, Co, Cd, Pb, Al, and Mn) around the Crozet Islands, Southern Ocean,”Journal of Geophysical Research: Oceans, vol. 118, no. 10, pp. 5188–5201, 2013.
[23] G. Dulaquais, M. Boye, R. Middag et al., “Contrasting biogeo-chemical cycles of cobalt in the surface western Atlantic Ocean,”
Global Biogeochemical Cycles, vol. 28, no. 12, pp. 1387–1412, 2014. [24] R. U. Shelley, N. J. Wyatt, G. A. Tarran, A. P. Rees, P. J. Worsfold, and M. C. Lohan, “A tale of two gyres: Contrasting distributions of dissolved cobalt and iron in the Atlantic Ocean during an Atlantic Meridional Transect (AMT-19),”Progress in Oceanography, 2016.
[25] M. A. Saito, A. E. Noble, N. Hawco et al., “The acceleration of dissolved cobalt’s ecological stoichiometry due to biologi-cal uptake, remineralization, and scavenging in the Atlantic Ocean,”Biogeosciences, vol. 14, no. 20, pp. 4637–4662, 2017. [26] S. Brunauer, P. H. Emmett, and E. Teller, “Adsorption of gases
in multimolecular layers,” Journal of the American Chemical Society, vol. 60, no. 2, pp. 309–319, 1938.
[27] M. Rafatullah, O. Sulaiman, R. Hashim, and A. Ahmad, “Adsorption of copper (II), chromium (III), nickel (II) and lead (II) ions from aqueous solutions by meranti sawdust,”Journal of Hazardous Materials, vol. 170, no. 2-3, pp. 969–977, 2009. [28] K. Y. Foo and B. H. Hameed, “Insights into the modeling of
adsorption isotherm systems,”Chemical Engineering Journal, vol. 156, no. 1, pp. 2–10, 2010.
[29] H. M. Dung and P. D. Hien, “The application and development of k0-standardization method of neutron activation analysis at Dalat research reactor,”Journal of Radioanalytical and Nuclear Chemistry, vol. 257, no. 3, pp. 643–647, 2003.
[31] E. P. Barrett, L. G. Joyner, and P. P. Halenda, “The determination of pore volume and area distributions in porous substances. I. Computations from nitrogen isotherms,” Journal of the American Chemical Society, vol. 73, no. 1, pp. 373–380, 1951. [32] W. C. Tsai, S. Ibarra-Buscano, C. C. Kan, C. M. Futalan, M. L. P.
Dalida, and M. W. Wan, “Removal of copper, nickel, lead, and zinc using chitosan-coated montmorillonite beads in single-and multi-metal system,”Desalination and Water Treatment, vol. 57, pp. 9799–9812, 2016.
[33] A. M. Cardenas-Pe˜na, J. G. Ibanez, and R. Vasquez-Medrano, “Determination of the point of zero charge for electrocoagula-tion precipitates from an iron anode,”International Journal of Electrochemical Science, vol. 7, no. 7, pp. 6142–6153, 2012. [34] T. Mahmood, M. T. Saddique, A. Naeem, P. Westerhoff, S.
Mustafa, and A. Alum, “Comparison of different methods for the point of zero charge determination of NiO,”Industrial & Engineering Chemistry Research, vol. 50, no. 17, pp. 10017–10023, 2011.
[35] M. Gheju, I. Balcu, and G. Mosoarca, “Removal of Cr(VI) from aqueous solutions by adsorption on MnO2,”Journal of Hazardous Materials, vol. 310, pp. 270–277, 2016.
[36] M. Singh, D. N. Thanh, P. Ulbrich, N. Strnadov´a, and F. ˇStˇep´anek, “Synthesis, characterization and study of arsenate adsorption from aqueous solution by 𝛼- And𝛿-phase man-ganese dioxide nanoadsorbents,”Journal of Solid State Chem-istry, vol. 183, no. 12, pp. 2979–2986, 2010.
[37] Z. L. Zhu, H. M. Ma, R. H. Zhang, Y. X. Ge, and J. F. Zhao, “Removal of cadmium using MnO2loaded D301 resin,”Journal of Environmental Sciences, vol. 19, no. 6, pp. 652–656, 2007. [38] Y. Ren, N. Li, J. Feng et al., “Adsorption of Pb(II) and Cu(II) from
aqueous solution on magnetic porous ferrospinel MnFe2O4,”
Journal of Colloid and Interface Science, vol. 367, no. 1, pp. 415– 421, 2012.
Submit your manuscripts at
https://www.hindawi.com
Hindawi Publishing Corporation
http://www.hindawi.com Volume 2014
Inorganic Chemistry International Journal of
Hindawi Publishing Corporation
http://www.hindawi.com Volume 201
Photoenergy
Hindawi Publishing Corporation
http://www.hindawi.com Volume 2014
Carbohydrate
Chemistry
International Journal of International Journal ofHindawi Publishing Corporation
http://www.hindawi.com Volume 2014
Journal of
Chemistry
Hindawi Publishing Corporation
http://www.hindawi.com Volume 2014
Physical Chemistry
Hindawi Publishing Corporation http://www.hindawi.com
Analytical Methods in Chemistry
Journal of
Volume 2014
Bioinorganic Chemistry and Applications Hindawi Publishing Corporation
http://www.hindawi.com Volume 2014
Spectroscopy
International Journal ofHindawi Publishing Corporation
http://www.hindawi.com Volume 2014
The Scientific
World Journal
Hindawi Publishing Corporation
http://www.hindawi.com Volume 2014
Medicinal Chemistry Hindawi Publishing Corporation
http://www.hindawi.com Volume 2014
Chromatography Research International Hindawi Publishing Corporation
http://www.hindawi.com Volume 2014
Applied ChemistryJournal of Hindawi Publishing Corporation
http://www.hindawi.com Volume 2014
Hindawi Publishing Corporation
http://www.hindawi.com Volume 2014 Theoretical Chemistry Journal of
Hindawi Publishing Corporation
http://www.hindawi.com Volume 2014 Journal of
Spectroscopy
Analytical Chemistry
Hindawi Publishing Corporation
http://www.hindawi.com Volume 2014
Journal of
Hindawi Publishing Corporation
http://www.hindawi.com Volume 2014
Quantum Chemistry
Hindawi Publishing Corporation
http://www.hindawi.com Volume 2014
International
Electrochemistry
International Journal ofHindawi Publishing Corporation
http://www.hindawi.com Volume 2014
Hindawi Publishing Corporation
http://www.hindawi.com Volume 2014