Salters-Nuffield Advanced Biology Resources
Activity 1.1 Student SheetMARK’S AND PETER’S STORIES
Purpose
To provide an overview of some symptoms and treatments of cardiovascular disease (CVD) using personal accounts.
To identify some risk factors for the development of CVD.
To provide an introduction to the topic.
To practise extracting relevant information when reading text.
Procedure
The two passages below are Mark’s and Peter’s own accounts of their experiences with CVD. As you read each account, note down relevant information about:
a symptoms b diagnostic tests c treatments
d any features of each person’s lifestyle that you think might have contributed to their development of the disease.
When identifying information in this way, try to be selective and concise in the notes you make.
Mark’s story
By Mark Tolley
I’m 34 now, but 19 years ago something momentous happened that changed my life.
On 28th July 1995, I was sitting in my bedroom playing on my computer when I started to feel dizzy with a slight headache. Standing, I lost all balance and was feeling very poorly. I think I can remember trying to get downstairs and into the kitchen before fainting. People say that unconscious people can still hear. I don’t know if it’s true, but I can remember my Dad phoning for a doctor and that was it. It took five minutes from me being an average 15-year-old to being in a coma.
I was rushed to Redditch Alexandra Hospital where they did some reaction tests on me. They asked my parents questions about my lifestyle (did I smoke, take drugs, etc.?). Failing to respond to any stimulus, I was transferred in an ambulance to Coventry Walsgrave Neurological Ward. Following CT and MRI scans on my brain it was concluded that I had suffered a bleed on my brain. My parents signed the consent form for me to have an operation lasting many hours. I was given about a 30% chance of survival.
They stopped the bleed by clipping the blood vessels that had burst with metal clips, removing the excess blood with a vacuum. I was then transferred to the intensive care unit to see if I would recover. Within a couple of days I was conscious and day by day regained my sight, hearing and movement (although walking and speech were still distorted). They had shaved all my hair off!
I had a remarkably quick recovery considering the severity of the operation. I was talking again (although slurred and jumbled) within five days. By the end of the week, I was transferred back to Redditch Alexandra Hospital to continue the rest of my recovery.
There I received occupational therapy, physiotherapy, and speech and language therapy to improve my coordination, speech and strength. Within seven days I could walk aided and talk better – I was then discharged to complete my recovery at home. I was given a wheelchair and was admitted for therapy as an outpatient. The occupational therapy trained my ability to perform everyday tasks. They made me make tea, do jigsaws, etc. to improve my cognitive skills.
Salters-Nuffield Advanced Biology Resources
Safety checked, but not trialled by CLEAPSS. Users may need to adapt the risk assessment information to local circumstances.
Activity 1.1 Student Sheet
before became a challenge. My left hand compensated for the weakness and gradually I became stronger, albeit on my former weaker side!
Three weeks later I returned to Coventry Walsgrave for an angiogram, where an X-ray dye was injected into my veins to show up my blood vessels on a scan. However, this showed that there was still a bleed occurring and so I was prepared for surgery once again.
The operation was lengthy, but not an emergency. However, I was still warned of the dangers of such surgery. The operation did not leave me with much disability this time and I woke up within a day of being transferred back into the intensive care unit again. Speech and movement were regained quickly. I was discharged to outpatients within three weeks, after undergoing another angiogram, and MRI and CT scans on my brain. Embarrassingly, they had shaved only half my hair off this time!
The following Wednesday I was called back to the Coventry & Warwick Hospital where my neurosurgeon held a clinic. He said that there was still a small bleed that needed to be clipped. So I was transferred to Walsgrave for my third operation. This one not being as severe, I woke up minutes after the operation with my faculties fully intact. I could talk and walk aided. Following more scans, the next week I was discharged again to complete my recovery at home. This was now late October 1995. Things such as stair climbing became easier and I no longer required my wheelchair.
I have had no further episodes of brain haemorrhage activity apart from occasional headaches. I am on anti-convulsant tablets (phenytoin) as I am now at a much higher risk from epileptic seizures because of the surgery (although I have not had a fit since the operations). I completed physiotherapy in November 1995, by doing exercises that improved my stamina, motor skills and coordination.
Although I have never been told a full reason why I suffered my stroke, I am certain that it was due to being born with weak blood vessels in my brain that gave way after years of increasing pressure. I’m glad I was at home when it happened: I could have been swimming or walking in the countryside with nobody around!
Returning to school in November, I found reading, writing and walking a challenge. I was treated differently from other students, which I found difficult as I wanted to fit back into my normal routine. In 2001, I passed my exams, my driving test and travelled around the world. In 2004, I met my wife whom I married in 2008. We now live together with our two cats. I have held several jobs, including building computers and working in a wine merchants. I now repair and maintain computers at a Further Education College, which is a challenging but enjoyable job.
Despite my stroke being some time ago, there are many residual effects that I have to deal with, particularly my short term memory, despite my best efforts of keeping a diary (I forget to fill it in!). My mind seems to go into ‘autopilot’; simple, day-to-day actions and processes we take for granted suddenly became challenging and unpredictable. However, with some cognitive behavioural therapy I have learned to live with my limitations and find my memory loss less stressful to deal with.
With social media, getting in touch with other survivors has never been easier and I made several friends who have been through similar experiences to my own. We share our stories, advice, coping mechanisms and companionship via a forum, which helps us all live our post-stroke lives.
I felt that in the rush to get me back to school and complete my education, my emotional recovery was overlooked, which led to me struggling to deal with my thoughts and feelings about the stroke.
Needing an outlet for this frustration, I poured all my effort into my love of writing and music. I began to tell my stroke story in the form of a blog that quickly became a full-sized paperback book that I completed in the summer of 2010, called Four Minute Warning (referring to the four minutes it approximately took for me to go from a normal teenager to falling unconscious). My book has been well received, leading to several press and BBC Radio interviews and an opportunity to speak at the Annual UK Stroke Forum. Keen to further my goal of becoming a full-time author, I have begun to create a range of books about the ‘Frisson’ effect music has on the body (goosebumps, cold chills, etc.), called ‘Shiver Project’. I am hoping to one day find a publisher and see ‘Shiver Project’ become a success.
Salters-Nuffield Advanced Biology Resources
Activity 1.1 Student SheetPeter’s story
By Peter Kempson
I remember clearly the first time I held a hockey stick at school; football wasn’t on the sports programme, so it became hockey, rugby and cricket in each of the terms.
During my time at the school I developed a keen interest in all sports, representing the school in hockey and athletics. It did not distract me from my school work, but seemed to make me more attentive and kept my mind more active.
After leaving school I still maintained my sporting interest, representing Bedfordshire at hockey and taking part in the athletics team at my place of work.
In 1961, aged 23, I got the first indication of cardiovascular problems. I was told that I had high blood pressure. I didn’t really take much notice. Well, you don’t think much about that at 23, do you? My father had died at the age of 53 from a heart attack, but as he was about four stone overweight, had a passion for fatty foods and smoked 60 full-strength cigarettes a day, I didn’t compare his condition to mine.
Throughout the rest of my working life I continued to play sport, mainly hockey, and was never overweight. I must admit that I probably drank too much at times and didn’t bother too much about calories and cholesterol in food.
As I got older I found it more difficult to keep fit during the summer break between the hockey seasons and so reverted to road running. I ran my first marathon in Leeds at the age of 42 and I subsequently did another five, including two in London.
All was going well I thought, until a medical I had for a new job showed my blood pressure reading to be 240 over 140. The doctor could not believe that I was still walking around, let alone running, and sent me straight to my GP. Since then I have taken tablets for blood pressure and have also reviewed my dietary intake.
I continued running and completed the Great North Run at the age of 63. A few months later, and thinking about doing the Great North Run again, I was running eight miles a week and playing hockey, when my eight-day holiday in Ireland became three days touring and 12 days in hospital. At 2 o’clock in the morning on May 8th I woke up with a terrific pain in my chest. I was sweating profusely and looking very pale. My wife rang the hotel reception and within 10 minutes a doctor had arrived, checked me over and pronounced that I had had a heart attack. Within an hour I was in intensive care and being closely monitored. At 5 am I had a second attack and a specialist inserted a temporary pacemaker to keep my heart rate up as it was dropping below 40.
After five days in intensive care I was transferred to the general ward for recuperation. I gradually increased my walks each day and was watched by the Lifestyle Nurse while I climbed stairs. The nurse also discussed my lifestyle. Did I smoke? No. Did I eat fatty foods? Yes. Did I exercise? Yes. Was I overweight? No. Did I have a history of cardiac problems in my family? Yes! This then appeared to be the probable cause. I was told that it was possible that had I not looked after myself I might have had a heart attack much earlier in life.
After 10 days I was given a stress test, which involved running on a treadmill to determine my ability to cope with normal life. Having passed the test I was brought home by the travel insurance company, escorted by a doctor.
On returning to Huddersfield I eventually had an angiogram and was told that I needed a triple bypass operation, but that my heart might not be strong enough to take it. The specialist at Leeds General Infirmary, Mr McGoldrick, gave me a detailed analysis of the situation and the operation, but the final decision was up to me.
Salters-Nuffield Advanced Biology Resources
Safety checked, but not trialled by CLEAPSS. Users may need to adapt the risk assessment information to local circumstances.
Activity 1.1 Student Sheet
I have to say it was not pleasant, but I had decided that it was necessary and I would cope with anything that happened if it would get me back to a decent lifestyle. Well, the operation, a quadruple bypass, was a success and after eight days I was back home.
Recuperation involved plenty of walking and visits to cardiac rehabilitation. At that time I was introduced to Heartline, which is a group of people who have suffered cardiac problems, encouraging exercise and recuperation by being able to talk to others with similar experiences. I go swimming once a week and have increased my distance from two lengths at first to 40 lengths after 12 weeks.
Although I feel fit enough to resume running I think I will put it on hold for a while. I don’t think I will ever play hockey again. There again, that’s probably not a bad decision!
Peter Kempson
Salters-Nuffield Advanced Biology Resources
Activity 1.1 Teacher SheetMARK’S AND PETER’S STORIES
Purpose
To provide an overview of some symptoms and treatments of cardiovascular disease (CVD) using personal accounts.
To identify some risk factors for the development of CVD. To provide an introduction to the topic.
To practise extracting relevant information when reading text. It also gives practice of reading fairly lengthy text.
Answers
Summary of points that can be extracted from the texts:
Mark
a Symptoms: dizziness; slight headache; loss of balance; unconsciousness; ongoing effects: memory difficulties.
b Diagnostic tests: reaction tests; CT scan; MRI scan; angiogram.
c Treatments: operation to clip blood vessels in the brain; occupational therapy; physiotherapy; speech and language therapy; anti-convulsant tablets.
d Lifestyle risks: none identified.
Peter
a Symptoms: high blood pressure; pain in chest; sweating; paleness. b Diagnostic tests: heart monitor; stress test; angiogram.
c Treatments: tablets for high blood pressure; heart pacemaker; quadruple bypass surgery. d Lifestyle risks: may have drunk too much at times and had a fatty diet, but was not overweight;
Salters-Nuffield Advanced Biology Resources
Safety checked, but not trialled by CLEAPSS. Users may need to adapt the risk assessment information to local circumstances.
Activity 1.2 Student Sheet
DEMONSTRATING MASS FLOW
Purpose
To calculate rate of diffusion.
To appreciate speed of diffusion in air.
To observe mass flow.
SAFETY
Wear eye protection. Wear disposable gloves when handling the ammonia solution. The experiment must be undertaken in a fume cupboard.
See CLEAPSS Student Safety Sheet 30 for further details on safe handling of ammonia and ammonium hydroxide.
YOU NEED
● Dilute ammonium hydroxide ● Two glass tubes
● Bungs to fit glass tubes ● 16 small pieces of litmus paper ● Glass or wooden rod
● Two small pieces of cotton wool
● Forceps ● Dropping pipette ● Stopclock
● Clamp stand, boss and clamp or piece of adhesive tack
● Ruler
Procedure
1 Your teacher/lecturer will set up a glass tube with litmus paper as shown in Figure 1 and measure the distance between the pieces of litmus paper.
2 In a fume cupboard add a few drops (about six) of ammonium hydroxide solution to a small ball of cotton wool and then place it at one end of the glass tube. Seal both ends of the tube with rubber bungs. Immediately start a stopclock. Ammonia is given off by the solution and diffuses along the tube. The litmus paper changes colour from red to blue in the presence of ammonia gas.
3 Record how long it takes each piece of litmus paper to change colour.
Figure 1 Glass tube with litmus paper.
4 Using a second tube without rubber bungs, place the cotton wool with ammonium hydroxide at one end.
5 Using a large syringe, blow air gently through the tube. Observe how quickly the litmus paper changes colour when the syringe is used.
Questions
Q1 Explain how the ammonia moves along the tube with sealed ends.
Q2 Calculate the speed of diffusion along the tube and comment on your findings. Q3 Explain how each of these factors would affect the rate of diffusion:
a higher concentration of ammonium hydroxide b higher temperature
c larger molecules replacing ammonium hydroxide.
Q4 Explain what is happening in the tube without bungs and how the model is similar to mass flow in a transport system, such as the mammalian circulatory system.
rubber bung
litmus paper (red)
Salters-Nuffield Advanced Biology Resources
Activity 1.2 Teacher SheetDEMONSTRATING MASS FLOW
Purpose
To calculate rate of diffusion.
To appreciate speed of diffusion in air. To observe mass flow.
SAFETY
Ensure eye protection is worn throughout the activity. Ensure disposable gloves are worn by anyone handling the ammonia solution.
The experiment must be undertaken in a fume cupboard.
See CLEAPSS Hazcard 6 for further details on safe handling of ammonia and ammonium hydroxide.
Notes on the procedure
It is presumed that most students will have observed diffusion in practicals at KS3 or KS4. However, it is worth students completing this practical or having it demonstrated to them to highlight the difference between diffusion and mass flow.
If students take an active part in this practical they need to know, in advance, how to use a fume cupboard.
The sealed tube allows measurements to be taken to determine the speed of diffusion. The open-ended tube demonstrates mass flow of ammonium hydroxide. It is virtually impossible to measure how quickly the litmus paper changes colour.
Stapling pieces of litmus paper to wooden splints and then sliding the splint into the tube overcomes the difficulty of getting the pieces along the tube.
If teaching topics in parallel (or when teaching Topic 2), the ideas here could relate to Fick’s law (Topic 2 2.1), which states that:
Rate of diffusion
surface of thickness ratio volume to area
Surface Concentrationdifference
Answers
Q1 Molecules are continuously moving due to their kinetic energy. There are more ammonia molecules at the cotton wool end of the tube (high concentration) compared with the other end (a region of low concentration). There is a net movement of molecules due to their random movement from the region of their high concentration to the region of their low concentration. Q2 The speed of diffusion at the end of the tube away from the cotton wool is slower than near the
cotton wool. Rate of diffusion is dependent on the concentration gradient. Near the cotton wool there is a high concentration compared with the rest of the tube: this gives a steep diffusion gradient. Large numbers of ammonia molecules will be diffusing away from the cotton wool so the net movement is rapid. As the molecules diffuse away, their concentration decreases and further along the tube the diffusion gradient is less steep. As a result, the time taken for enough molecules to diffuse between the final two pieces of litmus paper and turn the last one blue will be much longer.
Q3 a Higher concentration will speed up diffusion because there is a steeper gradient.
b Higher temperature will speed up diffusion because the molecules will have more kinetic energy.
c Larger molecules would diffuse more slowly because in a vapour or gas, at a given temperature, the larger the molecule, the more slowly it moves.
Q4 The air in the tube moves through the tube and carries the ammonia with it. Blood works in the same way. The fluid is pumped around the body and carries within it substances to be
Salters-Nuffield Advanced Biology Resources
Safety checked, but not trialled by CLEAPSS. Users may need to adapt the risk assessment information to local circumstances.
Activity 1.2 Technician Sheet
DEMONSTRATING MASS FLOW
Purpose
To calculate rate of diffusion.
To appreciate speed of diffusion in air. To observe mass flow.
SAFETY
Wear eye protection and disposable gloves.
The experiment must be undertaken in a fume cupboard.
All ammonia solutions must be dispensed in a fume cupboard as the vapour, ammonia gas,
is toxic and extremely irritating to the eyes and lungs.See CLEAPSS Hazcard 6 for further
details on safe handling of ammonia and ammonium hydroxide.
Requirements per student or
group of students Notes
Eye protection, disposable gloves and access to a fume cupboard
Two glass tubes Approximately 50 cm long and 2 cm in diameter.
Two bungs to fit glass tubes The bungs should have ventilation holes through them: one to fit the syringe; the other as a vent.
Eight small pieces of red litmus paper Each piece approximately 1 cm in length. For ease of positioning in the tube the pieces of litmus paper can be stapled at intervals along a wooden splint.
Glass or wooden rod To position the litmus paper in the glass tube. Two pieces of cotton wool Approximately 1.5 1.5 cm.
Forceps
Dilute ammonium hydroxide Any concentration around 0.5 M should work well.
Large syringe Any size is fine as long as it provides a good draught of air when the plunger is pushed in.
Dropping pipette
Stopwatch/clock Two bosses, clamps and stands or
pieces of adhesive tack
Instead of using a boss and clamp, rest the tubes on the bench with a piece of adhesive tack acting as a wedge to stop them rolling off. Ruler
Notes
Figure 1 Glass tube with litmus paper (red). cotton wool
with ammonium hydroxide
litmus paper (red)
Salters-Nuffield Advanced Biology Resources
Activity 1.3 Student SheetAN IDEAL TRANSPORT MEDIUM
Purpose
To understand the importance of the dipole nature of water.
To relate the solvent properties of water to some of the functions of water in living systems.
Properties and polarity
Water is unusual because it is a liquid at room temperature whereas other small molecules are gases. This is because the water molecule is polar; the different ends of the molecule have different charges. Water is a dipole. To help you understand the dipole nature of water and how it affects water’s
properties, read the Key Biological Principles box on page 8 of the Year 1 Student Book and complete the interactive tutorial that accompanies this activity. Then complete the questions below.
Questions
Q1 Complete and annotate the diagram of water molecules in Figure 1 to explain why water is a liquid at room temperature, unlike other small molecules, such as carbon dioxide.
You should include the following words/ideas in your diagram: hydrogen bonds
polar charges on oxygen and hydrogen atoms.
Figure 1 Why water is a liquid at room temperature.
Q2 Oil and water do not mix. They remain as two separate layers, with the less dense oil floating on top of the water. Oil is non-polar; it is hydrophobic (water-repelling).
a Predict what will happen if some drops of water-soluble dye were added to a water-oil mixture.
b Then try doing it, to check if you were correct. Suggest an explanation for what you observe happening.
………
………
Salters-Nuffield Advanced Biology Resources
Safety checked, but not trialled by CLEAPSS. Users may need to adapt the risk assessment information to local circumstances.
Activity 1.3 Student Sheet
Q3 a Vitamin C is water-soluble. Vitamin A is fat-soluble. Give a possible explanation for this difference.
………
………
………
b A celebrity chef announces on his TV show that it would be better to boil a joint of meat rather than roast it. He says this is because the fat will dissolve out of the meat, making the meal lower in fat and healthier. Is he correct in his explanation of what is happening during the cooking?
Explain your answer.
………
………
………
Q4 Complete the table below, to show why water is ideal as the transport medium in blood.
Property Explanation Role in blood
The positively charged end of a water molecule is attracted to the negative ends of surrounding molecules. Hydrogen bonds form; these hold the water molecules together.
Solvent for ionic and polar substances.
Blood helps to regulate body temperature because water resists changes in
temperature.
Q5 Your young cousins are worried that the fish in their large garden pond will get too hot on very sunny days in summer. What would you say to make them realise that they do not need to worry?
………
………
Salters-Nuffield Advanced Biology Resources
Activity 1.3 Teacher SheetAN IDEAL TRANSPORT MEDIUM
Purpose
To understand the importance of the dipole nature of water.
To relate the solvent properties of water to some of the functions of water in living systems.
Notes on the procedure
Before completing the questions on the Student Sheet, students should read the Key Biological Principles box on page 8 of the Year 1 Student Book and complete the interactive tutorial that accompanies this activity.
The questions on the Student Sheet are to get students thinking about hydrogen bonding between water molecules. Note that in chemistry, students may well use the term intermolecular bonds; we have included this in the interactive tutorial; at this stage students do not need to have detailed knowledge of cohesion. This is included in Topic 4.
The interactive tutorial on water is within the Biochemistry Support section on SNAB Online. It includes material relevant to Topic 4. In Topic 1, students only have to cover those sections that support ideas about the dipole nature of water and its role as a solvent in transport. There is a small amount of information about temperature. This introduces the role of water in temperature regulation and shows that the blood also transfers energy; this is not required for examination purposes.
An additional task could be completed by students. Students are asked how many drops of water will sit on a penny. A penny will take about 27 drops of water from a fine glass pipette, with a large dome of water created before it overflows. There is no requirement to go into surface tension. The large volume able to sit on a penny can be explained by the hydrogen bonds that are holding the water molecule together. This highlights the polarity of water and hydrogen bonds between water molecules. A smear of detergent will reduce the amount of water that can sit on the penny to just a few drops. It is sufficient for students to say that the detergent prevents the formation of hydrogen bonds between the water molecules.
Magnetic water molecule models are very good for demonstrating polarity and solvent properties. They are available from Philip Harris.
Answers
Q1 Students should annotate the diagram to show the polar charges on oxygen and hydrogen atoms, and hydrogen bonds between the molecules.
Q2 The lack of mixing of oil and water in a container could be demonstrated. The water-soluble dye will only dissolve in the water component because of the dipole nature of the water molecule. This can be explained in terms of the formation of hydrogen bonds between the dye molecules and water, but not between the oil and dye.
Q3 a Vitamin C is a polar molecule. Vitamin A is not polar. Therefore hydrogen bonds will only form between Vitamin C and water, allowing it to dissolve. Vitamin A is transported in the blood bound to a protein.
Salters-Nuffield Advanced Biology Resources
Safety checked, but not trialled by CLEAPSS. Users may need to adapt the risk assessment information to local circumstances.
Activity 1.3 Teacher Sheet
Q4
Property Explanation Role in blood
Liquid at room temperature. The positively charged end of a water molecule is attracted to the negative ends of surrounding molecules. Hydrogen bonds form: these hold the water molecules together.
Blood does not change state, but remains as a liquid solvent, transporting substances around the body.
Solvent for ionic and polar substances.
The positively charged end of a water molecule is attracted to negative ends of surrounding molecules, or negative ions. The negative oxygen atoms in water attract positively charged ions or molecules.
Polar substances dissolve in water, so are transported around the body as solutes in blood.
High specific heat capacity. A large amount of energy is needed to break the hydrogen bonds between water molecules.
Blood helps to regulate body temperature because water resists changes in temperature.
Salters-Nuffield Advanced Biology Resources
Activity 1.3 Technician SheetAN IDEAL TRANSPORT MEDIUM
Purpose
To understand the importance of the dipole nature of water.
To relate the solvent properties of water to its function in living systems. The oil and water mixture may be completed as a teacher demonstration.Requirements per student or
group of students Notes
Glass measuring cylinder Large, if for teacher demonstration.
Salters-Nuffield Advanced Biology Resources
Safety checked, but not trialled by CLEAPSS. Users may need to adapt the risk assessment information to local circumstances.
Activity 1.4 Student Sheet
STRUCTURE OF THE HEART (DISSECTION)
Purpose
To revise your knowledge of the structure of the heart. To relate heart structure to function.
To locate and compare the structure of the main arteries leaving the heart with the main veins entering the heart.
To observe the coronary arteries. To develop practical dissection skills.
SAFETY
Wash your hands carefully after completing the dissection and putting all the equipment ready to be cleaned. Hands should be washed before leaving the lab.
Take care with sharp dissecting instruments.
Wear a plastic apron to protect your clothes. Long sleeved clothing should be rolled up to prevent contamination.
YOU NEED
● Heart
● Dissecting board or tray ● Dissecting instruments ● Rubber tube
● Clamp to seal blood vessel ● Access to water supply
● Plastic apron to protect your clothes
Procedure
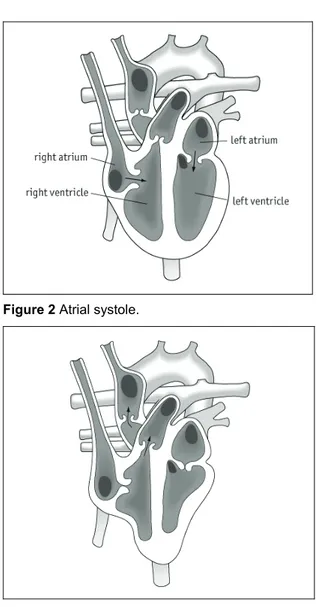
1 Before starting the dissection, use the Student Book to help you label the heart diagram in Figure 2.
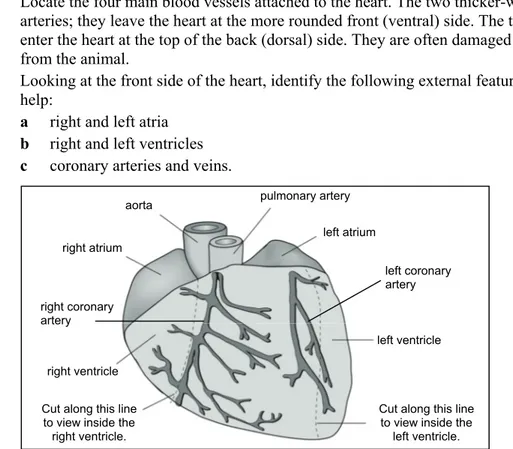
2 Locate the four main blood vessels attached to the heart. The two thicker-walled vessels are the arteries; they leave the heart at the more rounded front (ventral) side. The thinner-walled veins enter the heart at the top of the back (dorsal) side. They are often damaged on removal of the heart from the animal.
3 Looking at the front side of the heart, identify the following external features using Figure 1 to help:
a right and left atria b right and left ventricles c coronary arteries and veins.
Figure 1 Ventral (front) view of the heart. The pulmonary vein and vena cava enter the atria on the dorsal (back) side of the heart so are not visible on this diagram.
aorta
right atrium
right ventricle
Cut along this line to view inside the
right ventricle.
pulmonary artery
left atrium
left ventricle
Cut along this line to view inside the
left ventricle. left coronary artery
Salters-Nuffield Advanced Biology Resources
Activity 1.4 Student Sheet4 Draw a sketch of the heart to show the position of the atria and ventricles. Q1 Why are the right and left sides apparently on the wrong side? Q2 a Can you distinguish coronary arteries and veins?
b What are their functions?
c Make a sketch showing how they branch across the surface of the heart.
5 If the heart is undamaged you can identify which vessel is the aorta by attaching a rubber tube to a water supply and inserting it into the pulmonary vein. Only use the water supply designated for this activity. Do not attach the rubber tube directly to a tap unless told to do so. Allowing water to flow through the heart (gently!), it will emerge from the aorta. Make sure all the water flowing out of the heart either drains down the sink or is captured in a glass bowl for proper disposal. The same procedure can be used with the superior vena cava after clamping the inferior vena cava shut.
Q3 In this case from which vessel will the water emerge?
Q4 What does this tell us about the internal structure of the heart?
6 To inspect the internal structure of the heart, cut through the ventricle walls, along the lines shown in Figure 1. This is best done with a pair of sharp scissors. Be careful at this stage only to cut through the ventricle walls, leaving the walls of the atria intact.
Q5 Look carefully inside each ventricle and answer these questions: a Which ventricle has thicker walls?
b Estimate the ratio of the thickness of the two walls.
c Suggest why the ventricle walls are of different thicknesses.
Q6 Locate and carefully observe the atrioventricular valves between the atrium and ventricle on each side of the heart.
a Why is the atrioventricular valve in the right ventricle also called the tricuspid valve? b Why is the atrioventricular valve in the left ventricle also called the bicuspid valve? Q7 Locate the semilunar valves at the entrance to the aorta and pulmonary artery. Why are
these valves called semilunar?
Q8 Identify the tendons that stretch between the atrioventricular valves and the ventricle walls. a What is the function of these valves and what is the role of the tendons in their
operation?
b Work out how you can test your ideas about valves by inverting the heart and using some water.
Q9 Cut open the atria and examine their internal structure. Explain the relative difference in size between the atria and ventricles.
7 Locate the opening of the coronary vein in the wall of the right atrium.
8 Cut open the aorta and locate the opening to the coronary artery just above the semilunar valve. Q10 Examine the openings to the vena cava and pulmonary vein. Do these entry points to the
heart contain valves? If not, why not?
Q11 Describe the safety precautions you took during the practical.
Salters-Nuffield Advanced Biology Resources
Safety checked, but not trialled by CLEAPSS. Users may need to adapt the risk assessment information to local circumstances.
Activity 1.4 Student Sheet
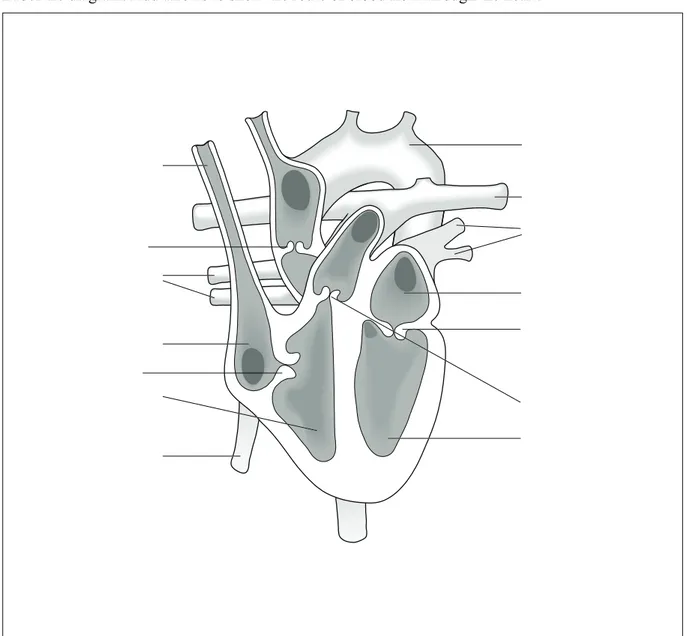
Vertical section of the heart
Label the diagram. Add arrows to show the route of blood flow through the heart.
Salters-Nuffield Advanced Biology Resources
Activity 1.4 Teacher SheetSTRUCTURE OF THE HEART (DISSECTION)
Purpose
To revise knowledge of the structure of the heart. To relate heart structure to function.
To locate and compare the structure of the main arteries leaving the heart with the main veins entering the heart.
To observe the coronary arteries. To develop practical dissection skills.
In preparation for the dissection or as an alternative, there is a simulated dissection in Activity 1.5 and a stepwise photo dissection accessible through the weblinks for both activities.
SAFETY
Hands should be washed carefully after completing the dissection and putting all the equipment ready to be cleaned. Hands should be washed before leaving the lab. Take care with sharp dissecting instruments.
Plastic aprons should be available to protect students’ clothes whilst doing a dissection.Long
sleeved clothing should be rolled up to prevent contamination. See CLEAPSS Guidance leaflets G267 and G268 for further details.
Notes on the procedure and answers
1 The diagram in the Student Book (page 9) and Figure 1 on page 2 of this sheet show the labels and blood-flow arrows needed to complete the heart diagram sheet.
2 The two arteries leave the heart at the front (ventral) side. The thinner-walled veins enter the heart at the top of the back (dorsal) side.
3 Deciding which side is the front of the heart is difficult for the student particularly if the heart is damaged. The ventral (front) side of the heart is more convex.
4 Sketch will be similar to one on the Student Sheet.
Q1 The right and left sides appear to be on the wrong side because the drawing is done as if the student is looking down on the heart inside the chest. The sides refer to the sides of the person’s/animal’s body.
Q2 a Coronary arteries and veins are very hard to distinguish as they lie alongside each other. b They supply blood to the heart muscle.
5 Running water through the heart will only be successful if it is not damaged.
Q3 If water is run into the superior vena cava it will emerge through the pulmonary artery.
Q4 The water flowing into and out of the heart through the separate vessels shows that the heart is separated into two distinct halves internally.
Q5 The left ventricle has thicker walls. They need to generate a greater force to push blood around the body.
Q6 a The valve in the right ventricle is called the tricuspid valve because it is composed of three triangular flaps.
b The valve in the left ventricle is called the bicuspid valve because it is made up of two flaps.
Salters-Nuffield Advanced Biology Resources
Safety checked, but not trialled by CLEAPSS. Users may need to adapt the risk assessment information to local circumstances.
Activity 1.4 Teacher Sheet
Q8 a The function of the atrioventricular valves is to prevent blood returning into the atria when the ventricles contract. The tendons stop the valves from inverting when blood pressure builds up in the ventricle.
b A small quantity of water poured into the heart through the artery should not run out through the veins due to the closing of the semilunar valves.
Q9 The relative difference in size between the atria and ventricles should be explained with respect to thickness of ventricle walls and their need to generate a greater force.
Q10 Valves in veins prevent any backflow that might occur. However, there are no valves at the openings to the vena cava and pulmonary vein. When the atria contract, blood is forced
downwards into the ventricles; blood is not pushed back out along the veins so there is no need for valves.
Q11 Safety precautions: washing hands; care with sharp instruments; careful and safe disposal of the heart; thorough cleaning of apparatus; disinfection of bench; washing hands at end of practical.
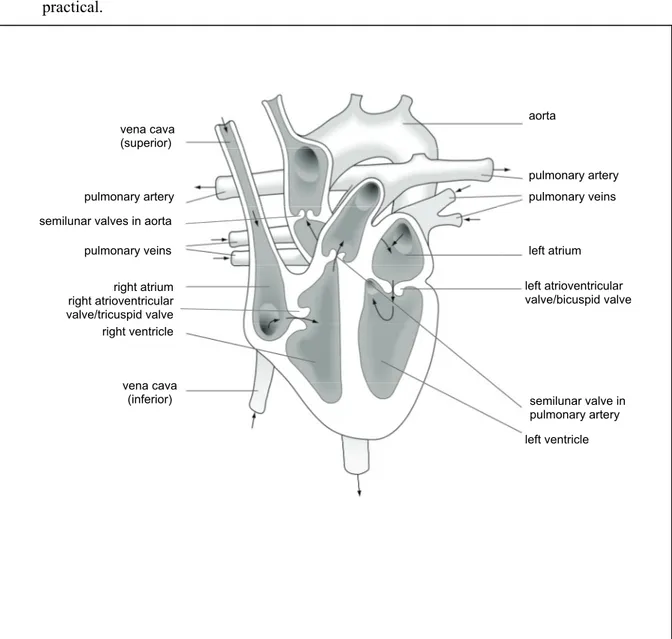
Figure 1 Vertical section of the heart showing direction of blood flow. vena cava
(superior)
pulmonary artery
pulmonary veins
right ventricle
vena cava (inferior)
aorta
pulmonary artery pulmonary veins
left atrium
left atrioventricular valve/bicuspid valve
semilunar valve in pulmonary artery
left ventricle semilunar valves in aorta
Salters-Nuffield Advanced Biology Resources
Activity 1.4 Technician SheetSTRUCTURE OF THE HEART (DISSECTION)
Purpose
To revise knowledge of the structure of the heart. To relate heart structure to function.
To locate and compare the structure of the main arteries leaving the heart with the main veins entering the heart.
To observe the coronary arteries. To develop practical dissection skills.
SAFETY
You should wash your hands after handling the hearts. Hands should be washed before leaving the lab.
Work surfaces should be disinfected after the practical with 1% Virkon™ and dissecting
instruments should be washedand autoclaved to make sure all organic matter is removed.
See CLEAPSS Guidance leaflets G267 and G268 for further details.
See CLEAPSS Guidance Notes G14 for details on laboratory water supplies.
Requirements per student or group of students
Notes
Heart A cow’s or pig’s heart is the best size for viewing detail, but use of lambs’ hearts presents the fewest religious or cultural issues. Ask the butcher to leave the heart intact otherwise he/she may cut through the wall when removing it. Ask for the hearts to be removed with as much of the blood vessels attached as possible. A ‘pluck’ (heart and lungs removed together) is best for obtaining blood vessels. Make it clear that you do not want the liver, as this should reduce the price dramatically. After using the heart in this dissection, the vessels should be kept for use in the arteries and veins activity (1.6). They can be frozen. The rest of the hearts should be wrapped in an opaque plastic bag and disposed of as normal waste.
Dissecting board or tray Enamel trays are fine; they can be lined with paper towels to make them less ‘slippy and drippy’.
Dissecting instruments Scissors (often the best for cutting open the heart), seekers and forceps.
Clamp to seal blood vessel This can be any suitable clip to hold the vein closed.
Disinfectant For cleaning benches.
1% Virkon™ can be used for general disinfection. Allow 10 minutes disinfection time. (NB: Virkon™ is not recommended for soaking metal instruments – they should be autoclaved.)
Cloth For cleaning benches.
Soap and paper towels For washing hands.
Access to a sink Ensure the laboratory water supply has backflow preventing valves (see CLEAPSS G14 for details). If not, use a large beaker of water poured through a funnel and rubber tube.
Salters-Nuffield Advanced Biology Resources
Safety checked, but not trialled by CLEAPSS. Users may need to adapt the risk assessment information to local circumstances.
Activity 1.5 Student Sheet
STRUCTURE OF THE HEART (SIMULATED
DISSECTION)
Purpose
To revise knowledge of the structure of the heart.
To relate heart structure to function.
To locate and compare the structure of the main arteries leaving the heart with the main veins entering the heart.
To observe the coronary arteries.
Procedure
Complete the activity by referring to diagrams and photographs in textbooks, and the animation that accompanies this activity. There are also some useful websites in the weblinks for this activity. 1 Draw a sketch of the external features of the heart viewed from the front (ventral) side. The two
thicker-walled vessels are the arteries; they leave the heart at the front (ventral) side. The thinner-walled veins enter the heart at the top of the back (dorsal) side. You should draw and label the following features: atria, ventricles, aorta, pulmonary artery and coronary arteries.
2 Label the vertical section diagram of the heart in Figure 1. Add arrows to show the route of blood flow through the heart.
Questions
Q1 Why are the right and left sides apparently on the wrong side? Q2 What are the functions of the coronary arteries and veins?
Q3 If water were poured into the vena cava, through which vessel would it emerge from the heart? Q4 What does this tell us about the internal structure of the heart?
Q5 Which ventricle has thicker walls?
Q6 Suggest why the walls of the left and right ventricles are of different thicknesses. Q7 Why is the atrioventricular valve in the right ventricle called the tricuspid valve and the
atrioventricular valve in the left ventricle called the bicuspid valve? Q8 What is the function of the atrioventricular valves?
Q9 Why are the valves at the entrance to the aorta and pulmonary artery called semilunar? Q10 What is the function of the tendons that connect the atrioventricular valves and the ventricle
Salters-Nuffield Advanced Biology Resources
Activity 1.5 Student SheetVertical section of the heart
Label the diagram. Add arrows to show the route of blood flow through the heart.
Salters-Nuffield Advanced Biology Resources
Safety checked, but not trialled by CLEAPSS. Users may need to adapt the risk assessment information to local circumstances.
Activity 1.5 Teacher Sheet
STRUCTURE OF THE HEART (SIMULATED
DISSECTION)
Purpose
To revise knowledge of the structure of the heart.
To relate heart structure to function.
To locate and compare the structure of the main arteries leaving the heart with the main veins entering the heart.
To observe the coronary arteries.
The simulation can be used in preparing for the real dissection or as an alternative to the dissection.
Notes on the procedure
1 The sketch should be similar to the one that appears on the Student Sheet of Activity 1.4.
2 The diagram in the Student Book (page 9) and Figure 1 in the Teacher Sheet of Activity 1.4 show the labels and blood-flow arrows needed to complete the heart diagram.
Answers
Q1 The right and left side of the heart appear to be on the wrong side because the diagram is drawn from the perspective of the person whose heart it is, not from the point of view of a spectator looking at the front of the person whose heart it is.
Q2 The coronary arteries and veins supply blood to the heart muscle.
Q3 If water is poured into the vena cava it will emerge from the pulmonary artery. Q4 The heart is separated internally into distinct halves.
Q5 The left ventricle has thicker walls.
Q6 The left ventricle walls are thicker because they need to generate a greater force to push blood around the body. The right ventricle walls only pump blood to the lungs, so the walls need to generate a relatively smaller force.
Q7 The tricuspid valve is composed of three triangular flaps. The bicuspid valve has only two flaps.
Q8 The atrioventricular valves prevent blood returning into the atria when the ventricles contract. Q9 The semilunar valves are formed of (three) half-moon-shaped flaps.
Salters-Nuffield Advanced Biology Resources
Activity 1.6 Student SheetINVESTIGATING ARTERIES AND VEINS
Purpose
To investigate how the structures of blood vessels relate to their functions.
To develop practical skills.
SAFETY
Wear eye protection and plastic aprons. Long sleeves should be rolled up to prevent contamination.
Benches should be thoroughly cleaned with 1% Virkon™ or other suitable disinfectant.
Wash your hands after handling tissue once cleaning is finished.Hands should be washed
before leaving the lab.
Place a tray under any suspended masses in case the blood vessel snaps.
Be aware of the danger of using microscopes where direct sunlight may strike the mirror.
YOU NEED
● Ring of artery and vein ● Mass carrier ● 5 × 10 g masses
● Hook
● Clamp stand, boss and clamp ● Metre rule
● Graph paper
● Prepared slide of artery and vein transverse section (T.S.)
● Prepared slide of lung or thyroid gland T.S. to show capillaries
● Microscope
● Histology book for microscope images and notes ● Drawing paper
Procedure
Before you start the practical work:
read the practical instructions carefully
identify the dependent and independent variables, and any others that might need to be controlled or taken into account
draw up a table in which to record your results. A good table of results should have:
an informative title
the first column containing the independent variable (the factor that is varied by the experimenter; in this experiment it is the mass)
the second and subsequent columns containing the dependent variables. (The value of the dependent variable depends on the value of the independent variable. In this case, the length of the ring depends on how much mass is added, so ring length is the dependent variable.)
informative column headings; each column should have a descriptive heading
units in the heading, not next to the numerical data in the table.
results recorded with appropriate precision, for example, if the ruler you are using to measure lengths in this experiment has mm divisions you can probably measure to 0.5 mm, but no less, so when recording a length of eleven millimetres you would enter 11.0 in the table; the measurement uncertainty is ±0.5 mm.
Salters-Nuffield Advanced Biology Resources
Safety checked, but not trialled by CLEAPSS. Users may need to adapt the risk assessment information to local circumstances.
Activity 1.6 Student Sheet
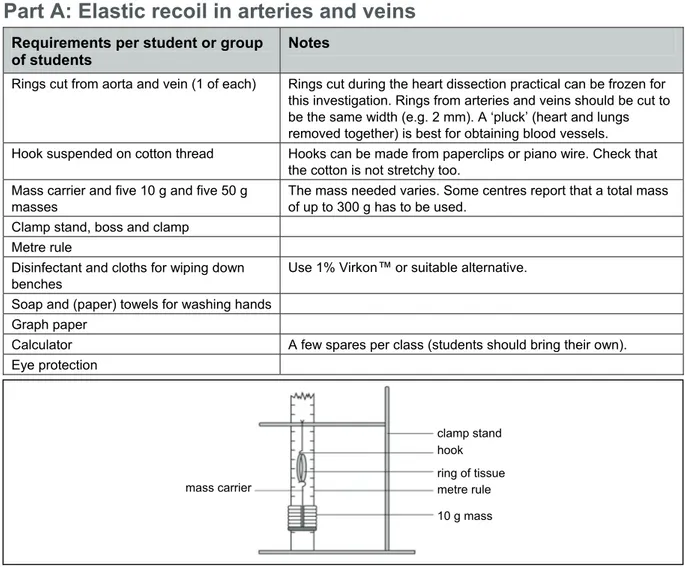
Part A: Elastic recoil in arteries and veins
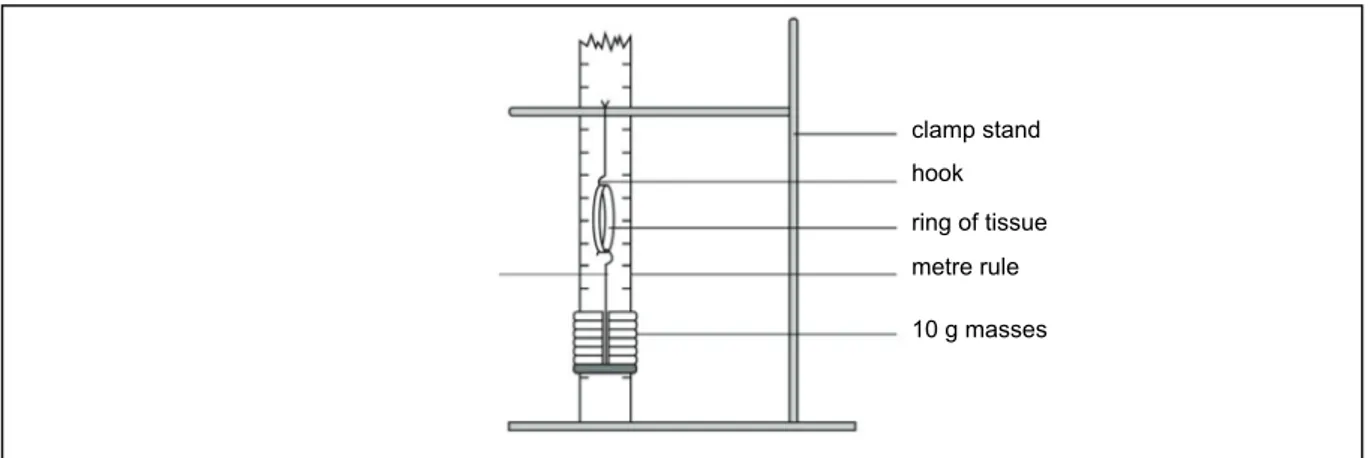
1 Suspend a ring of artery from a hook on a clamp stand. Use a metre rule to record the length of the ring once the mass carrier has been attached to the free end of the ring.
2 Attach a 10 g mass (see Figure 1) and record the length of the ring after the mass is added. 3 Remove the mass and record the length of the ring.
4 Repeat steps 2 and 3 using 20, 30, 40 and 50 g masses. Record the length with and without the masses each time.
Figure 1 Measuring the length of the ring.
Part B: Histology of blood vessels
5 Examine slides of artery and vein. Identify the three main regions of the vessel wall, and the tissues in these regions:
a external, middle and inner layers of tissue b elastic and collagen fibres
c smooth muscle.
6 Use an eyepiece graticule to measure the thickness of the walls of the artery and the vein. For more detail on how to use a microscope and how to measure using an eyepiece graticule read Practical Skills Support Sheet 8 – using a microscope and Sheet 9 – size and scale.
7 Sketch a plan of a cross-section across both vessels to show the amount and distribution of each type of tissue. See Practical Skills Support Sheet 8 for guidance on biological drawing.
8 Annotate the sketch with notes on the three regions and other features of the vessel, for example, thickness of wall, tissues in the three regions.
9 Using H.P. (high power) examine a capillary in a section of an organ, for example, lung or thyroid. Measure the average diameter of a capillary.
clamp stand
hook
ring of tissue
metre rule
Salters-Nuffield Advanced Biology Resources
Activity 1.6 Student SheetAnalysis and interpretation of data
1 Calculate percentage change in length:
% change in length =
length original
length) original length
(new
-2 Enter all your results into an appropriate table.
3 Plot two appropriate graphs, one for artery and one for vein. Remember that the most appropriate type of graph should be chosen to represent data, for example, bar chart, pie chart, histogram or line graph.
A bar chart is used when the independent variable is non-numerical or discontinuous, for example, the different stages of mitosis.
A pie chart can be used to display data that are proportions or percentages.
A histogram is used when the independent variable is numerical and the data are continuous, but classified into groups, for example, mass in kg, which is divided into classes, such as 41–50 kg, 51–60 kg, etc. There are no gaps between the bars of a histogram and the area of the bar represents the frequency.
A line graph can be used to show relationships in data that are not immediately obvious from tables. Both the dependent and independent variables are continuous. The independent variable normally goes on the x-axis.
Remember to include:
an informative title
sensible scales on each axis, if appropriate
labels on both axes
units on both axes, if appropriate
a key.
(For more detail on presenting data see Cadogan A. (ed.) (2000) Biological Nomenclature: Standard terms and expressions used in the teaching of biology, 3rd edition. London: Institute of Biology.) In this experiment plot percentage change in length against mass.
Values for adding and removing masses should be plotted on the same graph. (You could colour-code the points to show which are adding and which removing masses.)
4 Identify any trends or patterns in your data. Think about answering the following question: how do the results for artery and vein compare when looking at percentage change in length on loading, and return to the original length on unloading?
Conclusion
Bearing in mind the purpose of this practical work – to investigate how the structures of blood vessels relate to their function – state a conclusion to your work: this should summarise what you have found out. You should explain any trends or patterns in the data, supporting your ideas with evidence from the data and your biological knowledge of the structure of arteries and veins.
Evaluation
1 If you made changes to the method provided, describe them and explain the reasons for the alterations.
2 Comment on any safety issues that you had to consider when performing this experiment. 3 Describe any systematic or random errors you noticed when completing the practical work. 4 Comment on the validity of the experimental design and of your conclusion. An experimental
design is valid if the procedure used is suitable for the investigation being undertaken, measures what is supposed to be measured and allows one to answer any question being asked.
Salters-Nuffield Advanced Biology Resources
Safety checked, but not trialled by CLEAPSS. Users may need to adapt the risk assessment information to local circumstances.
Activity 1.6 Teacher Sheet
INVESTIGATING ARTERIES AND VEINS
Purpose
To investigate how the structures of blood vessels relate to their functions. To develop practical skills.
SAFETY
Ensure eye protection is worn while vessels are being stretched.
All organic material should be collected for disposal. All equipment should be cleaned thoroughly with detergent.
Benches where fresh biological material has been handled should be thoroughly cleaned with 1% Virkon™ or other suitable disinfectant.
Hands should be washed before leaving the lab.
Be aware of the danger of using microscopes where direct sunlight may strike the mirror.
Demonstrate how to insert the slide correctly onto the stage. Ramming the slide may produce glass shards.
Notes on the procedure
This activity has two parts. In Part A students stretch blood vessels to compare their elasticity. In Part B they look at the histology of blood vessels. Part B could be completed in advance of the practical work on elastic recoil so students can draw on this understanding when analysing the results of the experiment.
Part A: Elastic recoil in arteries and veins
In the procedure on the Student Sheet there is no instruction as to the cutting of the rings. It is assumed that the rings will have been cut in advance. If this is not the case students may need to be reminded that the rings of arteries and veins should be cut to the same width (about 2 mm).
If veins are not available, students could complete the investigation using an artery and then compare their results with the sample ones shown below. These results are for rings of a vein approximately 2 mm in width, so rings of artery the same length should be used to allow valid comparisons.
Length of vein/mm Mass/g
Vein 1 with mass Vein 1 without mass
0 (original length) 21
10 36 36 20 38 37 30 40 39 40 41 39 50 41 41
Part B: Histology of blood vessels
Instead of making the sketches, students could use images of blood vessels downloaded from the website, or captured themselves using video-cam. They could paste these into a word document, then label and annotate using lines and textboxes.
For help on this see the Digital Capture Tutorial in ICT Support.
Salters-Nuffield Advanced Biology Resources
Activity 1.6 Teacher SheetNotes
Analysis and interpretation of data
Students should calculate the percentage change in length and present all the results in a suitable table. The most suitable graph for this practical work is a line graph plotting percentage change in length against mass.
Students should describe any trends or patterns, with supporting data. The artery is expected to show a greater percentage increase in length than the vein. The artery should return closer to the original length than the vein.
Conclusion
Students need to explain any trends or patterns using biological knowledge, for example, ‘The artery has a greater proportion of elastic tissue in its walls, so would be expected to be more extensible and more elastic than the vein, which has a greater proportion of collagen’.
This should link structure and properties of arteries and veins with their function. Arteries are
stretched during systole. During diastole, the walls recoil, helping to smooth the flow of blood through the vessel. There is no pulse in the venous system, therefore veins do not extend and recoil as blood enters them. Contraction of skeletal muscles assists in movement of blood through veins.
Evaluation
Any changes or additions to the method provided need to be explained with an appropriate reason, for example, use of finer scale ruler to increase precision, or eye level when recording to avoid a
systematic error.
Relevant safety comments would include: hand-washing after handling tissue, disinfection of equipment and bench, care with suspended masses.
There is not really a clear question to address or hypothesis to test so assessing the validity of the experimental design should highlight this flaw. At this stage of the course one might decide to structure the write-up as a series of questions to guide students more directly to the areas of interest. Questions might be
Q1 How do the results for artery and vein compare when looking at: a percentage change in length on loading?
b return to the original length on unloading? Q2 What are the main properties of:
a elastic fibres? b collagen?
Q3 Explain any trends or patterns in the data, supporting your ideas with evidence from the data and your biological knowledge of the histology of arteries and veins.
Q4 Explain how the properties of arteries and veins that you have investigated link to the functions of arteries and veins in the body.
Q5 Comment on any safety issues that should be considered when performing this experiment. Q6 Suggest modifications to the experimental procedure that would ensure that more valid results
Salters-Nuffield Advanced Biology Resources
Safety checked, but not trialled by CLEAPSS. Users may need to adapt the risk assessment information to local circumstances.
Activity 1.6 Teacher Sheet
Answers would be:
Q1 a The artery is expected to show a greater percentage increase in length than the vein. b The artery should return closer to the original length than the vein.
Q2 a Elastic and extensible. b Inelastic and inextensible.
Q3 Describe any trend or pattern, support with data and explain using biological knowledge, for example, ‘The artery has a greater proportion of elastic tissue in its walls, so would be expected to be more extensible and more elastic than the vein, which has a greater proportion of collagen’.
Q4 Arteries are stretched during systole. During diastole, the walls recoil, helping to smooth the flow of blood through the vessel. There is no pulse in the venous system. Veins do not extend as blood enters them.
Q5 Relevant comments would include: hand-washing after handling tissue, disinfection of equipment and bench, care with suspended masses.
Salters-Nuffield Advanced Biology Resources
Activity 1.6 Technician SheetINVESTIGATING ARTERIES AND VEINS
Purpose
To investigate how the structures of blood vessels relate to their functions.
To develop practical skills.
This activity has two parts. In part A students stretch blood vessels (a piece of artery and a piece of vein) and measure how elastic they are. In part B they look at the histology of the blood vessels using a microscope.
SAFETY
Eye protection should be used in case of ‘flyback’ from bits of animal tissue when the tissue
breaks.Place a tray under the suspended masses.
You should wash your hands after handling the sections of blood vessels. Hands should be washed before leaving the lab.
Work surfaces should be disinfected after the practical with 1% Virkon™.
All apparatus should be thoroughly cleaned with detergent ensuring all organic material is completely removed.
Do not soak metal instruments in Virkon™.
Wrap all organic matter together and dispose of as normal food waste. Store in freezer/refrigerator until the day of disposal.
Ensure students are aware of the danger of using microscopes where direct sunlight may strike the mirror.
Part A: Elastic recoil in arteries and veins
Requirements per student or group
of students Notes
Rings cut from aorta and vein (1 of each) Rings cut during the heart dissection practical can be frozen for this investigation. Rings from arteries and veins should be cut to be the same width (e.g. 2 mm). A ‘pluck’ (heart and lungs removed together) is best for obtaining blood vessels. Hook suspended on cotton thread Hooks can be made from paperclips or piano wire. Check that
the cotton is not stretchy too. Mass carrier and five 10 g and five 50 g
masses
The mass needed varies. Some centres report that a total mass of up to 300 g has to be used.
Clamp stand, boss and clamp Metre rule
Disinfectant and cloths for wiping down benches
Use 1% Virkon™ or suitable alternative.
Soap and (paper) towels for washing hands Graph paper
Calculator A few spares per class (students should bring their own). Eye protection
Figure 1 Measuring the length of the ring.
hook
mass carrier
clamp stand
Salters-Nuffield Advanced Biology Resources
Safety checked, but not trialled by CLEAPSS. Users may need to adapt the risk assessment information to local circumstances.
Activity 1.6 Technician Sheet
Part B: Histology of blood vessels
Requirements per student or
group of students Notes
Prepared slides of artery and vein T.S. Prepared slides of lung or thyroid gland T.S. to show capillaries
Microscope Microscopes with high power lenses are needed. Lamp if not built into microscope
Eyepiece graticule Stage micrometer Histology book Drawing paper
Pencils
Salters-Nuffield Advanced Biology Resources
Activity 1.7 Student SheetHARVEY’S CIRCULATION EXPERIMENTS
Purpose
To demonstrate the function of valves in veins.
Perform Harvey’s experiment
In 1603, Hieronymous Fabricus (1537–1619), an Italian professor of anatomy and surgery, was the first to publish a description of the valves in veins, although he was uncertain as to their function. The English anatomist, William Harvey, one of Fabricus’s medical students, completed some simple experiments to solve the puzzle and demonstrate circulation. Harvey’s book, ‘De Motu Cordis’ (Concerning the Motion of the Heart and Blood), published in 1628, described the experiments, which you can perform for yourself or get a friend to help.
The experiments
Allow your hand to hang downwards below waist level until the veins on the back of the hand stand out.
Press hard on a vein close to your knuckle.
Keep pressing and at the same time with another finger, push along the vein towards your wrist. You will see the vein seems to disappear.
Lift the second finger and observe what happens. Sometimes you have to repeat several times pushing further up towards the wrist to see the effect that Harvey will have observed.
Now lift your first finger and see what happens.
Explain how the results of this experiment provided evidence supporting Harvey’s idea that veins contain one-way valves. You could use the questions below to help you structure your answer. Q1 What will pressing the vein close to your knuckle do to blood in the vein?
Q2 What does pushing along the length of the vein do to blood in the vein?
Q3 What did you observe happen when you removed your second finger from the vein? Q4 What can you conclude from this observation?
Q5 What happened when you lifted your first finger?
More evidence
DO NOT do this experiment yourself
Figure 1 is similar to the one in Harvey’s book. He pressed the vein at point H to block the flow from the wrist. He pushed the blood out of the vein to point O, then he tried to force the blood back along the vein; a swelling occurred at point K in the vein.
Figure 1 Illustration of Harvey’s experiment from his book on the motion of the heart and blood.
Salters-Nuffield Advanced Biology Resources
Safety checked, but not trialled by CLEAPSS. Users may need to adapt the risk assessment information to local circumstances.
Activity 1.7 Teacher Sheet
HARVEY’S CIRCULATION EXPERIMENTS
Purpose
To demonstrate the function of valves in veins.
Perform Harvey’s experiment
The simple experiment described is based on the one completed by William Harvey, which
demonstrated that veins contain one-way valves. It can be completed by students individually although working in pairs will make it easier. Boys have less subcutaneous fat so the effect is often more obvious in them.
The original Harvey diagram included a ligature around the upper arm: this use of a ligature on the arm must not be attempted by students.
An additional question could be set as outlined below. It is omitted from the Student Sheet due to space constraints and its somewhat gruesome nature.
Additional question
In another experiment operating on a live snake Harvey bound the vena cava and observed that the heart failed to fill with blood. He then bound the aorta and showed that the heart became engorged with blood as it was unable to escape.
Q7 What could Harvey conclude from these observations?
Answers
The explanation of evidence supporting Harvey’s idea that veins contain one-way valves should include the answers to the questions.
Q1 Pressing the vein close to your knuckle stops the blood flowing along the vein back towards the wrist and arm.
Q2 Pushing along the length of the vein moves blood out of that section of the vein towards the wrist.
Q3 When you removed your second finger from the vein it does not refill.
Q4 Valves in the veins allow the movement of blood in one direction; they prevent back flow of blood along the vein.
Q5 On lifting your first finger, the vein refills with blood.
More evidence
DO NOT do this experiment
Q6 The blood is stopped by a valve and it cannot go any further so the swelling occurs as the blood collects in front of the valve.
Additional question
DO NOT do this experiment