DO ELEVATION AND ASPECT PREDICT FUNCTIONAL TRAIT VALUES IN
ALPINE PLANT POPULATIONS?
Karen Bach1, Ella Abeli-Amen1, Dr. Dena Grossenbacher1 1California Polytechnic State University
Abstract
Alpine regions are among the hardest hit by global climate change, experiencing rising temperatures at a faster rate than lowland areas. Such fast rates of warming are predicted to cause rapid changes in alpine plant communities, including shifts in plant functional traits along elevation gradients. To investigate these effects within species, we examined the relationship between elevation, aspect, and functional traits of three common alpine plants in California; the shrub Holodiscus discolor var. microphyllus, the forb Calyptridium umbellatum, and the grass Trisetum spicatum. Functional traits examined included plant height, plant width, and Specific Leaf Area (SLA). These traits were measured across an elevation transect in the Sierra Nevada at multiple populations for each of the three focal species. Our findings indicate that there is no relationship between elevation, aspect, and functional trait values of alpine plants. We infer that there are other factors besides elevation and aspect that are responsible for driving
functional trait values of alpine plants, and that elevation may not be a good predictor for future population level change under a warming climate.
Introduction
Alpine regions are among the hardest hit by global climate change, with temperatures increasing at a faster rate than in lowland areas (Pepin et al., 2015). In the Sierra Nevada, a similar trend has been observed that may result in impacts to alpine ecosystems. At a weather station in Sequoia National Park, average temperature data collected at 9,200 ft has shown a temperature increase of 2 degrees Celsius over the last 30 years (Sadro et al., 2019). Several studies have investigated the consequences of this warming for alpine ecosystems. In an alpine region of Russia, Soudzilovskaia et al. (2013) showed that species functional traits can be effectively used as predictors of ecosystem responses to climate change and are able to better predict vegetation response than just simply considering species as members of fixed functional types. Similarly, in a dataset of alpine tundra regions around the world Bjorkman et al. (2018) showed a significant increase in community height with increasing temperature over a 30-year period, demonstrating that these changes to plants’ average functional trait values may result in shifts towards community characteristics currently restricted to lower elevations.
In order to better understand the impacts of climate warming on within species variation, we investigated whether elevational trends in functional traits within species could be used as predictors of species-level responses to increasing alpine temperatures. To explore this question, using elevation as a proxy for temperature, we investigate whether functional traits withinspecies are predicted by elevation. Since temperature decreases with increasing elevation, we predicted that at high elevations plants would be shorter, narrower, and have smaller SLA values (meaning greater leaf mass relative to leaf surface area) than at low elevations.
Methods
Species and study sites
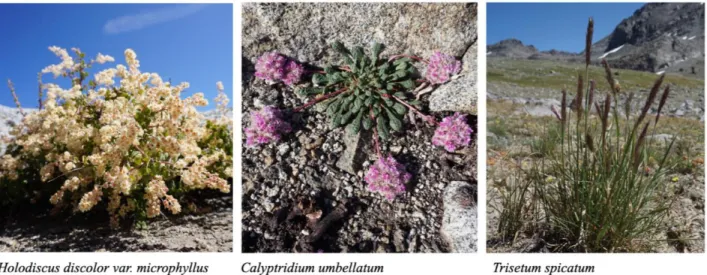
Figure 1: Selected alpine species examined in this study. Left to right: the shrub Holodiscus discolor var. microphyllus, the forb Calyptridium umbellatum, and the grass Trisetum spicatum.
Individuals were sampled within historic National Resource Inventory (NRI) plots ranging from 3,000-4,000m in elevation within Sequoia and Kings Canyon National Parks in the Sierra Nevada of California. The plots were established within the park boundaries between 1986 to 1996 and encompass a variety of habitat types from alpine meadows to talus slopes (Graber et al. 1993).
Sampling design
For each species, we aimed to collect data from three individuals within every plot. Individuals were chosen within the boundaries of the plot area, sampling an individual occurring closest to the 1) center, 2) north boundary, and 3) east boundary of the plot. To ensure that sample individuals were at similar phenological and life history stages, and to ensure a positive identification, only individuals with visible reproductive structures (flower buds, flowers, or fruits) were sampled.
Trait data
From each individual the following data was collected in the field: plant height measured in centimeters from the soil to the highest vegetative portion of the individual with sexual structures excluded; plant width in centimeters measured as the maximum width of the individual excluding sexual structures; and a new, fully expanded leaf was collected from the innermost ring of the basal rosette of each C.
umbellatum, the most distal end of a branch of H. discolor var. microphyllus, and the nearest leaf to the inflorescence of T. spicatum.
Before fully dry, the leaves were photographed next to a ruler through a transparent film into bright light to yield silhouette images that were analyzed in ImageJ to determine leaf surface area. Collected leaves were stored in coin envelopes and dried in an herbarium drier for a minimum of 24 hours. Dry leaves were weighed to an accuracy of 0.0001 grams. These measurements, surface area (𝐴) and mass (𝑚), were used to calculate the specific leaf area of each leaf (𝑆𝐿𝐴 = 𝐴 ÷ 𝑚).
Data analysis
To determine whether there were population level differences in functional traits, we used an analysis of variance (ANOVA) model with plot as a fixed effect and functional trait as a response variable (Base R package: stats). Separate models were constructed for each species (N=3) and for each of the 3 functional traits (height, width, SLA) for a total of 9 ANOVA models. Height and SLA were log transformed for each species prior to analysis.
To determine whether there was a relationship between elevation or aspect, and functional trait values within species, we used a linear mixed effects model (R package: lmer). Elevation, aspect, and their interaction were included as fixed effects, with plot included as a random effect, and the functional trait value as the response variable. As above, separate models were constructed for each species (N=3) and for each of the 3 functional traits (height, width, SLA) for a total of 9 linear mixed effect models. Height and SLA were log transformed for each species prior to analysis. Model significance was assessed using the R package: car.
Results
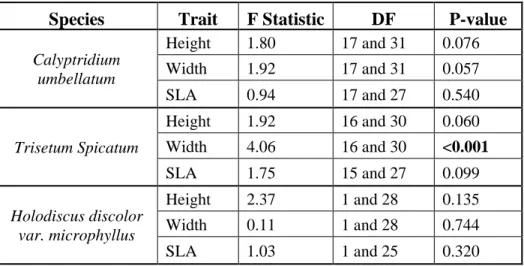
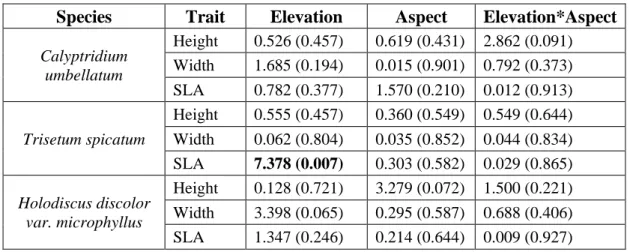
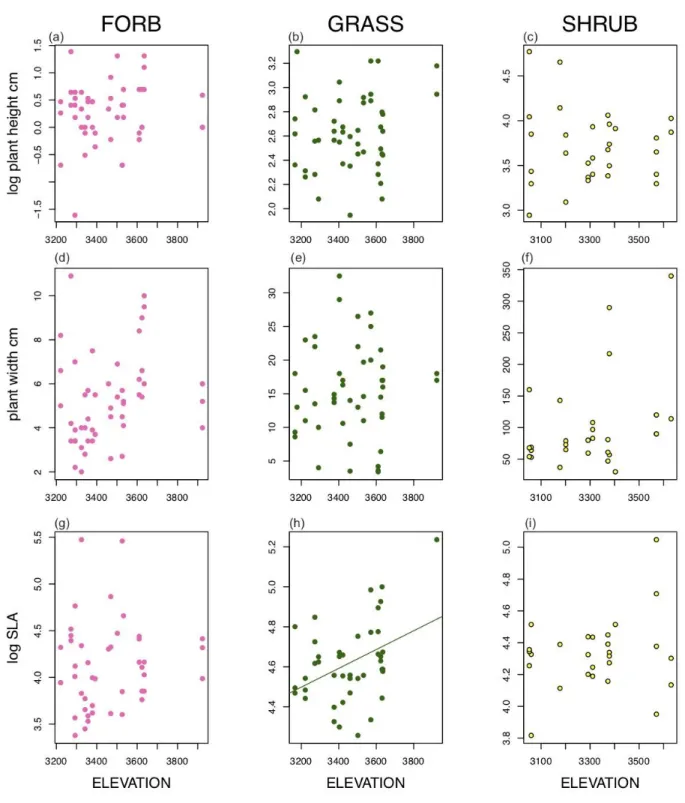
Overall, we found no significant population level variation in functional traits except for width of T. spicatum (Table 1, Figure 2). Population mean width of T. spicatum ranged from about 8 to 28cm, amounting to a threefold difference among populations. We found no significant effect of elevation, aspect, or their interaction on functional traits for any of the three species except for SLA of the grass, T. spicatum (Table 2, Figure 3, Figure 4). SLA of T. spicatum increased with increasing elevation, meaning that plants at high elevation had larger thinner leaves than at lower elevation. However, we caution that this result may be driven by a single outlier point (Figure 3h).
Table 1: ANOVA results for population level variation in mean trait values. Bolded values indicate significant results (P<0.05).
Species
Trait
F Statistic
DF
P-value
Calyptridium umbellatum
Height 1.80 17 and 31 0.076
Width 1.92 17 and 31 0.057
SLA 0.94 17 and 27 0.540
Trisetum Spicatum
Height 1.92 16 and 30 0.060
Width 4.06 16 and 30 <0.001
SLA 1.75 15 and 27 0.099
Holodiscus discolor var. microphyllus
Height 2.37 1 and 28 0.135
Width 0.11 1 and 28 0.744
Table 2: Linear mixed effects model results of whether elevation, aspect or their interaction predict functional traits. Chi-square values are reported with p-values in parentheses. Bolded values indicate significant results (P<0.05)
Species
Trait
Elevation
Aspect
Elevation*Aspect
Calyptridium umbellatum
Height 0.526 (0.457) 0.619 (0.431) 2.862 (0.091)
Width 1.685 (0.194) 0.015 (0.901) 0.792 (0.373)
SLA 0.782 (0.377) 1.570 (0.210) 0.012 (0.913)
Trisetum spicatum
Height 0.555 (0.457) 0.360 (0.549) 0.549 (0.644)
Width 0.062 (0.804) 0.035 (0.852) 0.044 (0.834) SLA 7.378 (0.007) 0.303 (0.582) 0.029 (0.865)
Holodiscus discolor var. microphyllus
Height 0.128 (0.721) 3.279 (0.072) 1.500 (0.221)
Width 3.398 (0.065) 0.295 (0.587) 0.688 (0.406)
Figure 3: Relationship between elevation and functional traits of Calyptridium umbellatum (a, d, g),
Conclusions
Overall, we found that elevation predicted functional trait values for only 1 of 9 species/trait
combinations—the grass, T. spicatum, had larger thinner leaves at higher elevations, though this result appears to be driven by a single outlier. Neither aspect nor the interaction between aspect and elevation predicted any functional trait values for the three study species. These results suggest that elevation and aspect are not consistent or widespread predictors of functional trait values. This is in contrast to pervious studies within alpine species (Soudzilovskaia et al., 2013 and Bjorkman et al., 2018). Below we lay out five potential explanations for these results.
Explanation 1: Since we were using elevation and aspect as proxies for temperature, though we did not have explicit temperature data, it is possible that there aren’t actually large enough temperature
differences along our elevation gradient to drive trait variation. Additionally, we don’t have temperature measurements to directly support our assumption that 1) temperature decreases with increasing elevation and that 2) south-facing aspects (180-360) are significantly warmer than north-facing aspects (0-180). If these assumptions are incorrect, then elevation and aspect may not be accurate proxies for temperature in this study.
Explanation 2: It is possible that other environmental factors are better indicators of temperature than elevation and aspect. For example, microhabitat variation (including exposure, shade, and proximity to water) can lead to ‘microclimate’ differences even within an elevation band, which could obscure any overall effect of elevation on functional trait values.
Explanation 3: Other environmental factors have a greater influence over these traits than temperature, elevation, and aspect. Microhabitat features such as exposure, water availability, and soil chemistry– including nutrient availability–may have a large influence over functional traits. Furthermore, biotic factors such as herbivory or fungal pathogens may shape functional trait patterns, particularly in plant size and leaf traits.
Explanation 4: High levels of within-population variation in functional traits may have reduced our ability to accurately assess population mean trait values. We only sampled 3 individuals per plot, and indeed some of the variation within plots was as much or greater than variation between plots. It is possible that this high level of within-population variation can be explained by the environmental factors mentioned in explanation 3 or appear inflated as the result of the small sample size. Along these lines, we only found significant variation in trait values between populations (plots) for only 1 of 9 species/trait
combinations—plant width in T. spicatum.
Explanation 5: It is also possible, regardless of environmental factors and even with greater within population sampling, that these traits simply don’t exhibit significant variation between populations and thus do not vary by elevation.
Given that our results contrast with previous work, follow-up studies could prove useful. Specifically, it would be useful to directly assess temperature within plots to account for factors mentioned in
References
Bjorkman, A. D., Myers-Smith, I. H., Elmendorf, S. C., Normand, S., Rüger, N., Beck, P. S., & Georges, D. (2018). Plant functional trait change across a warming tundra biome. Nature, 562(7725), 57-62.
Graber, D. M., Haultain, S. A., Fessenden, J. E. (1993). Conducting a biological survey: a case study from Sequoia and Kings Canyon National Parks. Transactions and Proceedings Series 9
Pepin, N., Bradley, R. S., Diaz, H. F., Baraër, M., Caceres, E. B., Forsythe, N., ... & Miller, J. R. (2015). Elevation-dependent warming in mountain regions of the world. Nature Climate Change, 5(5), 424-430.
Sadro, S., Melack, J. M., Sickman, J. O., Kevin Skeen, K. (2018). Climate warming response of mountain lakes affected by variations in snow. Limnology and Oceanography Letters, 4, 9-17.