QUANTIFYING THE ENVIRONMENTAL PERFORMANCE OF A STREAM HABITAT IMPROVEMENT PROJECT
A Thesis presented to
the Faculty of California Polytechnic State University, San Luis Obispo
In Partial Fulfillment of the Requirements for the Degree
Master of Forestry Sciences in Environmental Management
ii © 2018 Cody Morse
iii
COMMITTEE MEMBERSHIP
TITLE: Quantifying the Environmental Performance of a Stream Habitat Enhancement Project
AUTHOR: Cody Morse
DATE SUBMITTED: August 2018
COMMITTEE CHAIR: Yiwen Chiu, Ph.D.
Professor of Environmental Management
COMMITTEE MEMBER: Brian Dietterick, Ph.D., P.H. Director, Swanton Pacific Ranch
COMMITTEE MEMBER: Jim Robins, M.S.
iv ABSTRACT
Quantifying the Environmental Performance of a Stream Habitat Improvement Project Cody Morse
River restoration projects are being installed worldwide to rehabilitate degraded river habitat. Many of these projects focus on stream habitat improvement (SHI), and an estimated 60%of the 37,000 projects listed in the National River Restoration Science Synthesis Program focus on SHI for salmon and trout species. These projects frequently lack a sufficient monitoring program or account for the environmental costs associated with SHI. The present study used life cycle assessment (LCA) techniques and topographic effectiveness monitoring to quantify
environmental costs on the basis of geomorphic change. This methodology was a novel approach to assessing the cost-benefit relationship of SHI.
To test this methodology, two phases of the Lower Scotts Creek Floodplain and Habitat
Enhancement Project (LSCR) were used as a case study. The LSCR was a SHI project installed along the northern coast of Santa Cruz County, California, USA. A limited scope LCA was used to quantify the life cycle impacts of raw material production, materials transportation, and on-site construction. Once these baseline results were produced, a topographic monitoring program was used to quantify the topographic diversity index (TDI) in pre- and post-project conditions. The TDI percent change was used to scale the baseline LCA results, which quantified the
environmental impacts based on geomorphic change.
Phase II outperformed phase I. Phase I had greater cumulative environmental impacts and experienced a 7.7 % TDI increase from pre- to post-project conditions. Phase II had 43% less cumulative environmental impacts and experienced a 7.9% TDI increase from pre- to post-project conditions. The impacts in phase I were greater because of the amount of material excavated to create off-channel features, which were a key feature of the LSCR. A scenario analysis also was conducted within the LCA component of this study. The scenario analysis suggests that life cycle impacts could be reduced by 30%-65% by using the accelerated recruitment method in place of importing materials to build large wood complexes.
The results of this study suggest that managers may improve the environmental performance of SHI projects by: (1) using the accelerated recruitment method to introduce larger key pieces to the channel, reducing the need to import materials; (2) using nursery grown plants as opposed to excavating plants for revegetation; (3) minimizing fuel combustion in heavy equipment and haul trucks by ensuring clear access to the channel and streambank, using small engine equipment to clear access corridors during site preparation, running more fuel-efficient machinery or bio-fuel powered machinery, and by attempting to minimize haul distances by sourcing materials locally; and (4) utilizing a “franken-log” design (a ballasted LWC configuration with a rootwad fastened to the downstream end of a log) in LWCs which led to favorable TDI change. This study concluded that LCA could be a valuable tool for monitoring SHI and river restoration projects and that further research of the TDI analysis is justified.
v
ACKNOWLEDGMENTS
Many thanks to Dr. Yiwen Chiu for her patience and guidance on this project. Dr. Chiu pushed me to be a better scientist and professional. A special thank you to Brian Dietterick for getting me involved in this project and at Swanton Pacific Ranch. I acknowledge my well-spent time and invaluable collegial associations at Swanton Ranch, where I conducted this research, worked on three phases of the Lower Scotts Creek Habitat Enhancement Project and learned countless land management skills. Special thanks also to Jim Robins, who provided professional input on this project and helped to improve my writing skills. Many thanks to my mother, Cynthia Morse, for supporting my education. Special thank you to my father Kendall Morse and Laura Nolden for helping to edit this thesis document.
This work was supported by the National Institute of Food and Agriculture (Grant No. 46027), from the McIntire-Stennis Cooperative Forestry Program. This funding enabled the primary author Cody Morse to complete the requirements for a graduate degree in forestry sciences from California Polytechnic State University - San Luis Obispo. This research took place at Swanton Pacific Ranch which is owned by Cal Poly Corporation and managed by the College of
vi
TABLE OF CONTENTS
Page
LIST OF TABLES ... ix
LIST OF FIGURES ... x
ABBREVIATIONS ... xi
GLOSSARY ... xii
CHAPTER 1. INTRODUCTION ... 1
1.1 River Restoration Background ... 1
1.2 Monitoring Challenges... 4
1.3 Key Research Objective ... 5
1.4 General Approach-Modeling ... 5
1.4.1 LCA Methodology ... 5
1.4.2 Effectiveness Monitoring ... 6
2. LITERATURE REVIEW ... 7
2.1 LCA Applications in Forest Harvest and Management Scenarios... 8
2.2 LCA Applications in Hydropower and Dam Building ... 13
2.3 LCA Applications in Construction and Materials Production ... 15
2.4 Applying ISO Framework to River Restoration ... 18
3. METHODOLOGY ... 23
3.1 Quantifying Environmental Performance ... 23
3.2 Study Site ... 25
3.3 LCA Study Methodology ... 28
3.3.1 LCA Goal and Scope ... 28
3.3.2 Assumptions and Limitations ... 29
3.3.3 Life Cycle Inventory ... 30
3.3.4 Life Cycle Impact Assessment... 34
3.3.5 Key Contributor Analysis ... 35
3.4 Scenario Analysis ... 35
3.4.1 Alder Scenario ... 36
3.4.2 Plant Sourcing ... 36
3.4.3 Materials Transportation ... 36
3.5 Quantifying Environmental Performance ... 37
vii
3.5.2 DEMs ... 38
3.5.3 Topographic Diversity Index Percent Change ... 38
3.5.4 Environmental Performance ... 39
4. RESULTS ... 40
4.1 Baseline LCIA ... 40
4.2 Key Contributors to Impacts ... 41
4.2.1 Key Contributors to Impacts in Phase I ... 41
4.2.1.1 Human Health-Carcinogenics ... 41
4.2.1.2 Resource Depletion-Fossil Fuels ... 41
4.2.1.3 Ecotoxicity ... 42
4.2.1.4 Photochemical Ozone Formation ... 42
4.2.1.5 Global Warming ... 42
4.2.1.6 Acidification ... 43
4.2.1.7 Eutrophication ... 43
4.2.1.8 Human Health- Non-Carcinogenics ... 43
4.2.1.9 Respiratory Effects ... 43
4.2.1.10 Ozone Depletion ... 44
4.2.2 Key Contributors to Impacts in Phase II ... 44
4.2.2.1 Human Health-Carcinogenics ... 44
4.2.2.2 Ecotoxicity ... 44
4.2.2.3 Global Warming ... 45
4.2.2.4 Resource Depletion -Fossil Fuels ... 45
4.2.2.5 Photochemical Ozone Formation ... 45
4.2.2.6 Human Health- Non-Carcinogenics ... 45
4.2.2.7 Eutrophication ... 46
4.2.2.8 Acidification ... 46
4.2.2.9 Respiratory Effects ... 46
4.2.2.10 Ozone Depletion ... 47
4.2.3 Sensitivity Analysis ... 47
4.2.3.1 Phase I ... 47
4.2.3.2 Phase II ... 47
4.3 Scenario Analysis ... 49
4.4 TDI Change ... 51
viii
5. DISCUSSION ... 56
5.1 Life Cycle Interpretation ... 56
5.2 Maximizing Environmental Performance of SHI ... 60
5.3 LCA Model Confidence ... 63
5.4 Monitoring Requirements for the LCA Model ... 65
5.5 Data Requirements for TDI Effectiveness Monitoring ... 67
6. CONCLUSION ... 69
6.1 Addressing the Key Research Question ... 69
6.2 Recommendations for Managers ... 69
6.2.1 Accelerated Recruitment Method ... 69
6.2.2 Plant Sourcing ... 70
6.2.3 Fuels Combustion ... 70
6.2.4 Franken-log Design ... 70
6.3 Study Conclusions ... 71
6.3.1 LCA Monitoring Applicability ... 71
6.3.2 Functional Unit Applicability ... 71
6.4 Future Research ... 72
REFERENCES ... 73
APPENDIX Table A1. Summary of Selected LCA Studies ... 78
Table A2. LCA Parameter ... 81
Table A3. Phase I Sensitivity Analysis Results ... 82
Table A4. Phase I Sensitivity Analysis Results ... 82
ix
LIST OF TABLES
Table Page
1. LCI inputs and technical notes for raw material production phase of the LSCR ... 31
2. LCI inputs and technical notes for the transportation phase of the LSCR. ... 32
3. LCI inputs and technical notes for on-site construction phase of the LSCR ... 33
4. Summary of scenario analysis by restoration phase. ... 37
5. Non-normalized and normalized LCIA results for restoring one meter of stream. ... 40
6. Area (ft2) and TDI value for each elevation category in phase I and II of the LSCR. ... 52
7. The impact assessment results scaled to reflect a 1% TDI increase functional unit in both phase I and II. ... 55
8. An outline of tasks associated with LCA data collection, modeling, an incorporation with a geomorphic effectiveness monitoring program... 66
x
LIST OF FIGURES
Figure Page
Figure 1. Product system diagram for the stream habitat improvement (SHI) process with the proposed cradle-to-gate system boundaries. ... 19 Figure 2. A schematic diagram of the LCA methodology used to quantify the environmental performance of SHI projects. ... 24 Figure 3. Location of Scott's Creek and phase I and II of the Lower Scotts Creek Floodplain and Habitat Enhancement. ... 27 Figure 4 CCC Coho Salmon spawning adult estimates for Scotts creek (excerpted from NMFS, 2012). ... 28 Figure 5. Key contributors to environmental impacts in Human Health-Carcinogenics (HHC), Photochemical Ozone Formation (POF), Global Warming (GW), Acidification (AC),
xi
ABBREVIATIONS LCA Life Cycle Assessment
SHI Stream habitat improvement LWC Large Wood Complex
LSCR Lower Scotts Creek Floodplain and Habitat Enhancement Project
AS Alder Scenario
PS Plant Sourcing Scenario
MT Materials Transportation Scenario TDI Topographic Diversity Index
ISO International Organization for Standardization LCI Life Cycle Inventory
xii GLOSSARY
Life Cycle Assessment (LCA) – an environmental management technique which quantifies the environmental impacts over the life cycle of a product
Stream Habitat Improvement (SHI) – river restoration practices focused on improving stream and floodplain habitat for fish or other threatened species
Environmental Impacts – a LCA term which represents the potential impacts from the use of resources and/or the environmental consequence of releases (used interchangeably with “impacts”)
Life Cycle Inventory Analysis (LCI) – involves data collection and calculation procedure to quantify relevant inputs and outputs of a product system
Life Cycle Impact Assessment (LCIA) – evaluates the significance of potential environmental impacts using the LCI results
Impact Assessment Methodology – a tool used to in LCIA to assign emissions to various environmental impact categories
Unit Process – smallest element considered in the LCI for which input and output data are quantified
1
1. Introduction 1.1 River Restoration Background
In an ecological context, river restoration refers to a variety of practices which aim to improve key ecosystem functions, often in support of a species or community. River restoration is widely practiced across the world, especially in developed countries (Kail et al., 2007; Roni et al., 2008). In the U.S. alone, over 37,000 river restoration projects were implemented between 1990 and 2003. The annual number of projects increased from approximately 400 in 1990 to approximately 5,500 in 2003 and cost on average one billion dollars per year (Bernhardt et al., 2005). Increased river restoration in the U.S. was catalyzed in part by the listing of many Pacific salmon
populations (Oncorhynchus spp.) as threatened or endangered under the U.S. Endangered Species Act (Roni et al., 2010). An estimated 60 % of the aforementioned 37,000 projects aimed to improve habitat for salmon and trout in the Pacific Northwest and California (Bernhardt et al., 2005; Roni et al., 2010). The popularity of river restoration (Morandi et al., 2014) and the lack of information on how river restoration practices may contribute to anthropogenic pollution,
underscore the need for further study to quantify the environmental impacts of the river restoration process.
In 2010, the California Environmental Quality Act began requiring state and local agencies to conduct or support analyses which address the greenhouse gas emissions associated with a proposed project (Association of Environmental Professionals, 2010). Life cycle assessment (LCA) is a tool that can be used to address this aspect of impact analysis. LCA is an
environmental management technique which quantifies the environmental impacts over the life cycle of a product or service (ISO, 2006).
2
typically measured from the time raw materials are acquired to the end of life of a product or service. Each impact category is measuredin a way that relates the emissions to a single refence unit. For instance, global warming potential is measured using CO2 equivalence (kg CO2 eq.). During the life cycle impact assessment phase of LCA any emission which contributes to the global warming potential is converted to kg. CO2 eq. and reported in terms global warming potential. This study will focus on applying LCA, techniques to measure the environmental impacts in ten impact categories (photochemical ozone formation, acidification, global warming, eutrophication, respiratory effects, human Health-non-carcinogenics, human
health-carcinogenics, ecotoxicity, ozone depletion, and resource depletion-fossil fuels) associated with the implementation of a stream habitat improvement (SHI) project, a common type of river restoration project. Although LCA is used in a wide variety of other fields, an extensive literature review suggests that LCA has never been applied previously to a river restoration project.
LCA has been applied to manufacturing (López Gayarre et al., 2015; Gan et al., 2016a),
renewable energy production (Suwanit and Gheewala, 2011; Turney and Fthenakis, 2011; Varun et al., 2012; González-García et al., 2013b; Zhang et al., 2014), and forest product production (Dias and Arroja, 2012; Cambria and Pierangeli, 2012; González-García et al., 2013a, 2014a; Han et al., 2015), among other fields. To quantify the environmental impacts of river restoration, this study proposed using a cradle-to-gate LCA (including material sourcing, transportation, and project construction) for two phases of a SHI project, which were completed in fall of 2015 and 2016, respectively. These projects were conducted on Cal Poly’s Swanton Pacific Ranch, situated on the West coast of North America, in northern Santa Cruz County, California.
3
riparian planting, exclusion of livestock, removal of barriers to fish passage, erosion control, floodplain habitat improvements, and placing instream structures to create or improve fish habitat (Roni et al., 2010, 2014; Howson et al., 2012; Carah et al., 2014). SHI is a long-standing practice. Using instream structures to improve habitat for fish been documented as early as the 1880’s (Thompson and Stull, 2002). The popularity and historical use of SHI practices, have led to the publication of numerous manuals and books which guide managers on design and implementation (Roni et al., 2002).
In California, numerous agencies and stakeholders support SHI projects. For instance, the California Department of Fish and Wildlife published the fourth edition of the California Salmonid Stream Habitat Restoration Manual in 2010 to serve as a guide for SHI projects. This manual provides a list of basic structural materials including gabions, logs, rootwads, and boulders (Flosi et al., 2010). Often these materials are used to construct large-wood complexes (LWCs) or other engineered structures to improve habitat conditions (Gallagher et al., 2012; Carah et al., 2014). Improving habitat conditions in California is a common goal of river restoration projects because approximately 34% of perennial streams in California are classified as degraded (Swamp PSA, 2015). Sources of this degradation include hydropower, agriculture, timber harvesting, wood removal, and mining (Nehlsen et al., 1991; Carah et al., 2014). These and other activities have led to a variety of disturbances including higher degrees of
channelization, channel erosion, and excessive sediment deposits. SHI projects often aim to remediate these disturbances by introducing structures which may alter channel depth or substrate dynamics, river velocity, stream cover, high-flow refuge habitat, and processes that affect
4 1.2 Monitoring Challenges
Although abundant information exists on the design and implementation of river restoration, project monitoring has been and remains a substantial challenge (Bernhardt et al., 2005; Katz et al., 2007; Palmer et al., 2007; Rumps et al., 2007). Rumps et al., (2007) interviewed 47 project managers in the Pacific Northwest, of whom 70% reported successful projects, although, 43% were unable to provide any success criteria. Although effectiveness monitoring programs are more common today, river restoration projects continue to be implemented without adequate monitoring programs. Furthermore, many monitoring programs lack the reproducibility required to inform similar future projects (Tompkins and Kondolf, 2007). Incorporating LCA into a monitoring program would allow for a reproducible framework that could be applied to SHI projects, and on a broader scale, to all river restoration projects.
5 1.3 Key Research Objective
To address the environmental performance of SHI projects, this study sought to answer the following key research question: Can we quantify the environmental costs of river restoration based on geomorphic change? The specific goals of this research were to: (1) quantify the environmental impacts of installing a SHI project; (2) identify the key contributors to the environmental impacts from an SHI project; (3) use topographic data to quantify the environmental performance of an SHI project; (4) document how managers may use this framework to improve the environmental performance of SHI projects.
1.4 General Approach - Modeling
This study usedthe Lower Scotts Creek Stream Floodplain and Habitat Enhancement Project (LSCR) as a case study. The LSCR used LWCs (large wood complex), floodplain connections, and riparian planting to conduct SHI (Cook, 2016). This methodology coupled LCA and
topographic effectiveness monitoring to quantify the environmental performance of the LSCR, a study conducted in two phases.
1.4.1 LCA Methodology
This study quantified the environmental impacts associated with raw material production,
6 1.4.2 Effectiveness Monitoring
To assess the effectiveness of the LSCR, topographic surveys were conducted for pre- and post-project conditions in both phases I and II. These topographic surveys were used a total station (optical surveying equipment) to assess changes in the physical habitat that may have resulted from project installations, particularly from LWCs. These data were used to model the topographic diversity index (TDI), which quantified the channel complexity before and after restoration was conducted. TDIs were used to assess major changes in habitat types and to
7
2. Literature Review
River restoration encompasses a wide range of practices. It can be is broadly defined as an attempt to return river ecosystem functions to pre-disturbance conditions (Kauffman et al., 2011). Along the West Coast of the USA, most river restoration projects aim to improve habitat for threatened endangered salmonids (Bash and Ryan, 2002; Bernhardt et al., 2005). Frequently, this style of river restoration aims to increase the amount and density of downed wood in the channel, either by improving riparian conditions such that there will be a natural input of wood to the channel, or by artificially increasing instream wood densities by placing wood structures in the channel. Inputs of large wood can increase slow-water areas by creating backwaters, pools, side-channels, eddies, and floodplain access. Restoration efforts that introduce large wood aim to mimic the ecosystem services large wood provides, which can increase the amount and quality of crucial over-wintering habitats and summer low-flow habitats (Gallagher et al., 2012; Carah et al., 2014).
River restoration using large wood has occurred for decades (Thompson, 2006), especially in North America where there is a great deal of interest in restoring historic salmon fisheries (Carah et al., 2014). In fact, the California Fisheries Restoration Grant Program has spent approximately 180 million dollars on restoration activities – not limited to large wood projects – from 1981 to 2012 (Gallagher et al., 2012). In a similar period, over 37,000 river restoration projects have been implemented across the U.S. (Bernhardt et al., 2005).
8
wood structures has been examined by numerous studies (Hilderbrand et al., 1998; Roni et al., 2002, 2010, 2014; Carah et al., 2014). However, little is known about the environmental impacts associated with the river restoration process. Extensive literature review suggests that LCA techniques have never been applied to river restoration. Thus, research that quantifies the environmental impacts of the river restoration process will provide valuable information to land managers and restoration practitioners.
Beyond quantifying the environmental impacts of a singular river restoration project, LCA could serve as a repeatable part of a monitoring program. LCA is an internationally standardized process with four distinct phases including Goal and Scope, Life Cycle Inventory (LCI), Life Cycle Impact Assessment (LCIA), and Interpretation. The goal and scope phase defines the context of the study and communicates what is being studied, the study boundaries, limitations, impact categories. The LCI phase involves the data collection and initial quantifications of inputs and outputs of the product system. The LCIA phase assigns the LCI results into impact categories and calculates their magnitude. In the interpretation phase, the LCA practitioner considers the results of the LCIA and often presents the findings in the form of conclusions or recommendations (ISO, 2006). This review offers a background on how LCA techniques have been used in various fields and how the LCA methodology may be adapted to quantify the environmental impacts of a SHI project. The specific objectives are to: (1) review pertinent LCA studies in the fields of forestry, river projects, and construction and materials projects (see appendix, Table A1); (2) identify the appropriate goal and scope, life cycle inventory analysis (LCI), life cycle impact assessment (LCIA), and life cycle interpretation phases as specified in the ISO 14040:2006 document for SHI projects.
2.1 LCA Applications in Forest Harvest and Management Scenarios
9
Handler et al., 2014; Han et al., 2015). A component of each of these studies models the
environmental impacts of using heavy equipment to log, forward, and transport logs. Frequently this aspect of the process is responsible for the largest contribution to environmental impacts or is a “hotspot” within the production system (Dias and Arroja, 2012; González-García et al., 2012, 2013b, 2014b; Cambria and Pierangeli, 2012). Since heavy equipment is frequently used in the river restoration process (Carah et al., 2014), it is important to review LCA studies on forest product systems. This section summarized the goal and scope, LCI, LCIA, and interpretation phases of several LCA studies on forest products.
The goal and scope section of many forestry studies focus on the production of roundwood. Roundwood refers to a log that has been grown, harvested, processed, and delivered to the mill. Forest products studies tend to use a ‘cradle-to-gate’ methodology, considering environmental impacts associated with: site preparation, stand establishment and tending, final logging, and transportation to the mill ‘gate.’ Site preparation activities may include land clearing, herbicide treatment, road preparation and fertilizing. Stand establishment and tending activities include seedling establishment, planting, thinning, and preliminary harvesting. The final logging phase includes final cutting, yarding, and loading onto trucks- a process which can be like some river restoration activities. Last, transportation activities include the final hauling of logs to the sawmill gate (Dias and Arroja, 2012; Cambria and Pierangeli, 2012; González-García et al., 2013a, 2014b; a; Han et al., 2015).
10
units, such as one green metric tonne of forest biomass (Handler et al., 2014), growing one hectare of willows (González-García et al., 2012), or producing 1 millijoule of heat from the combustion of willow chips (González-García et al., 2013b).
During the LCI phase, these forestry studies received primary information on equipment usage and harvest processes through interviews with forest managers, land managers, and from logger surveys (González-García et al., 2012, 2013a, 2014b; Cambria and Pierangeli, 2012; Handler et al., 2014; Han et al., 2015). One such study associated with redwood production in California utilized surveys from a collection of companies which make up 90% of the redwood decking industry in Northern California (Han et al., 2015). An analysis of roundwood supply in Michigan used logger survey data mailed to 220 survey respondents to provide an accurate picture of logging across the state. These surveys provided information on harvesting and transportation strategies, ultimately leading to analysis of three equipment configurations: a) cut-to-length full processor/forwarder, (b) feller-buncher/skidder/slasher, (c) chainsaws/skidders. The study went on to examine impacts associated with the each equipment configuration scenario (Handler et al., 2014).
Secondary information is typically compiled from published technical reports and other reputable data sets. A common data set used is the Ecoinvent database (Ecoinvent, 2016), this database contains unit process associated with harvesting equipment and has been used in a variety of timber harvest studies (Dias and Arroja, 2012; González-García et al., 2012, 2013a, 2014a). Other forestry studies incorporate data from previous studies and other published data sets and national publications (Cambria and Pierangeli, 2012; Han et al., 2015).
11
TRACI impact assessment package produced by the Environmental Protection Agency (Han et al. 2015). Regardless of the impact assessment package, many studies considered global warming, eutrophication, acidification, ozone depletion, photochemical ozone formation, human toxicity, and ecotoxicity (Dias and Arroja, 2012; González-García et al., 2012, 2013a, 2014a; Cambria and Pierangeli, 2012).
In life cycle interpretation, many forestry studies documented hotspots during final harvesting. Final harvesting involved using a plethora of heavy equipment including log skidders, adapted farm tractors, and log forwarders to cut and transport logs. These types of harvesting equipment have a large fuel requirement and impart large contributions to global warming potential,
acidification, and photochemical ozone formation (Dias and Arroja, 2012; González-García et al., 2014b; a; Han et al., 2015). Beyond identifying key contributors, forestry studies tend to model several scenarios which quantify the impacts of different silvicultural techniques (Dias and Arroja, 2012; González-García et al., 2014b; a; Han et al., 2015). For instance, a study by Han et al., (2015) modeled the impacts from uneven- and even-aged timber management systems in northern California. Han et al., (2015) found that an even-aged management system which used manual-ground based harvesting outperformed its counterparts in both even-aged and uneven-aged scenarios. Another study by Dias and Arroja (2012) modeled high intensity forest
management with best practices, high intensity forest management with traditional practices, and low intensity forest management in both eucalypt and maritime pine wood production systems in Portugal. Dias and Arroja (2012) found that low-intensity management practices in maritime pine wood production systems generated the least environmental impacts per m3 of wood. Low-intensity management practices in pine wood forested outperformed its eucalypt counterpart because eucalypt forests required greater site preparation and more standing tending, had smaller dimensions, and required greater fertilizer use. Life cycle impacts tended to vary greatly
12
was the most impactful phases of production (Dias and Arroja, 2012; González-García et al., 2012, 2013a, 2014a; Cambria and Pierangeli, 2012).
Aside from the final harvest, another hotspot in forest product production was the use of fertilizers. Fertilizers were used to increase plant vigor, which led to greater environmental impacts, particularly in upstream manufacturing. The application of these fertilizers lead to greater emissions to soil and water, increasing the amount eutrophication and acidification potentials of these production systems (Dias and Arroja, 2012; González-García et al., 2012, 2013a, 2014a; Cambria and Pierangeli, 2012). Despite this, many product systems used fertilizer because it increased yield and, in some cases, resulted in a better environmental profile. A study by Gonzalez-Garcia et al. (2012) found that when fertilizers were added to long term commercial willow plantation in Sweden, the operations had a better overall environmental performance when compared to operations that did not use fertilizer. However, Gonzalez-Garcia et al. (2012) noted that when fertilizers were used the eutrophication and acidification potential increased significantly.
Reviewing LCA studies on timber harvest operations suggests that the use of heavy equipment is a common hotspot. These observations are important because the river restoration process which often requires a great deal of heavy machinery and equipment use. River restoration projects may use excavators, dump trucks, front-end loaders, and chainsaws (Scotts et al., 2014) which are used to fall trees, manipulate large materials, and excavate earth materials (Carah et al., 2014). Forest product studies reviewed here suggest that these activities can impart significant
13
substantiates an evaluation of the environmental impacts associated with the use of heavy equipment to construct and transport large materials in the river restoration processes.
2.2 LCA Applications in Hydropower and Dam Building
LCA has been used to quantify the environmental impacts from hydropower and dam building projects. These projects focus on quantifying the environmental impacts from small- and large-scale hydropower dams and small-large-scale check dams. These river installations typically involve the use of heavy equipment, which is used to construct the facilities that generate electricity or modify flow regimes. While river restoration in California does not seek to generate electricity, there are similarities between the processes, especially during the construction of small-scale dams (Suwanit and Gheewala, 2011; Varun et al., 2012; Liu et al., 2013; Kayo et al., 2014; Zhang et al., 2015).
14
During LCI, Primary data is typically gathered from members of the industry. In a study that examined mini-hydropower plants in India, primary data was gathered on site, while secondary data were gathered from the literature and Ecoinvent databases (Suwanit and Gheewala 2011). In a study by Liu et al., (2013) data were gathered by the government hydropower research
institutes. Other studies employed similar LCI techniques (Kayo et al. 2014; Varun et al. 2012; Zhang et al. 2015).
During the LCIA phase, most of these studies focused on the greenhouse gas emissions, particularly with CO2 emissions (Suwanit and Gheewala, 2011; Varun et al., 2012; Liu et al., 2013; Zhang et al., 2015). One study used the CML 2001 baseline impact assessment
methodology which quantified the impacts in abiotic depletion, acidification, global warming, freshwater aquatic ecotoxicity, human toxicity, photochemical oxidation, and fossil fuel resource depletion (Suwanit and Gheewala, 2011). Liu et al., (2013) considered NOx emissions, CO emissions, and particulate matter emissions.
In the life cycle interpretation phase, most of these studies identified an installation design which was less impactful. Two studies compared the environmental impacts of rockfill and concrete hydropower dams, both studies found suggest earth-core dams were less impactful than their concrete counterparts. This was largely due to the upstream impacts associated with producing concrete and the fact that concrete dams tended to use more concrete (Liu et al., 2013; Zhang et al., 2015). For instance, in Zhang et al. (2015) the difference was largely attributed to the material production stage, where the concrete-gravity dam emitted 46% more kg CO2 eq. than the earth-rockfill dam.
15
the remoteness of the mini-hydropower plants. Varun et al. (2012) examined different engineering designs of small hydropower schemes in India and found that the CO2 emissions depended on the head design and capacity of each project.
In a unique study by Kayo et al. (2014), the carbon footprint of simple timber check dam was compared to the carbon footprint of a simple concrete check dam. This study had broad system boundaries, which incorporated resource extraction, resource transport, manufacturing,
construction, maintenance, and disposal. This study found that the timber check dam performed better than the concrete check dam after an operation period of 22 years, especially if
reforestation occurred after the timber was harvested and used in construction. The use of forest-residue and sawmill-forest-residue as a fuel source also reduced the carbon footprint of timber check dams.
The results from these studies suggest that the more highly engineered structures tended to have greater environmental impacts. This was largely due to the upstream impacts of material production (Liu et al., 2013; Zhang et al., 2015) and in some cases the shipping distances of materials (Suwanit and Gheewala, 2011). River restoration deals with similar challenges, often materials are engineered (steel cabling, epoxy, rebar, concrete) or transported to remote locations. It is likely that these aspects of the river restoration process will also generate significant
contributions to the environmental impacts.
2.3 LCA Applications in Construction and Materials Production
16
types of earthmovers (Stripple, 2001; Barandica et al., 2013; Cook, 2016). This section also highlights a study on erosion control materials because conducting erosion control is commonly practiced in river restoration.
The goal and scope of construction and materials production varies depending on the product system. For instance, many LCA studies on road building address the environmental impacts from creating 1 km of road, with a system boundary that includes materials production, site preparation, construction, operation, maintenance, and disposal (Stripple, 2001; Barandica et al., 2013). Studies on aggregate production or use designate a given amount of aggregate as a functional unit. For instance, Gan et al., (2016) used 1 kg of aggregate as a functional unit and a system boundary which included materials extraction, processing, transport, and disposal (López Gayarre et al., 2015; Gan et al., 2016). One study examined different erosion control methods, including bio-mats, geo-nets, geo-cells and deep-rooted plants. The functional unit for this study was the erosion materials required to cover one hectare of slope. The system boundaries for this study included the production and transportation of raw materials, installation, and hydro-seeding required to install erosion control (Rocco et al. 2015).
17
During the LCIA phase, the global warming potential (kg CO2 eq.) was quantified in every construction and materials production study examined in this review (Stripple, 2001; Barandica et al., 2013; López Gayarre et al., 2015; Rocco et al., 2015; Gan et al., 2016a). Other commonly examined impact categories were acidification and eutrophication. Rocco et al. (2016) used the impact assessment categories associated with an exergy analysis, including Cumulative Exergy Demand, the Thermo-Ecological Cost, and the Cumulative Exergy Extraction from Natural Environment. Together these methodologies measured impacts associated with non-renewable fossil fuels, non-renewable nuclear energy, renewable kinetic energy, renewable solar energy, renewable potential energy, non-renewable primary energy, renewable biomass energy, renewable water resources, non-renewable metals, non-renewable minerals, and land use.
In the life cycle interpretation phase, finding varied by study topic. Gayarre et al., (2015) compared natural aggregate, recycled aggregate at a fixed plant, and recycled aggregate at a mobile plant for concrete kerbs and found that natural aggregate was a less impactful than its recycled counterparts. This difference was associated with a with the operation of a rock crusher and processing unit in recycled aggregate. Transportation was also a hotspot, and the use of local products was encouraged (Gan et al. 2015). Rocco et al. (2016) found that deep rooted plants were a much better option when compared to three more highly engineered geo-textile fabrics produced for erosion control.
18
any other method of erosion control, even straw mulch, which is also commonly used (Flosi et al., 2010).
2.4 Applying ISO Framework to River Restoration
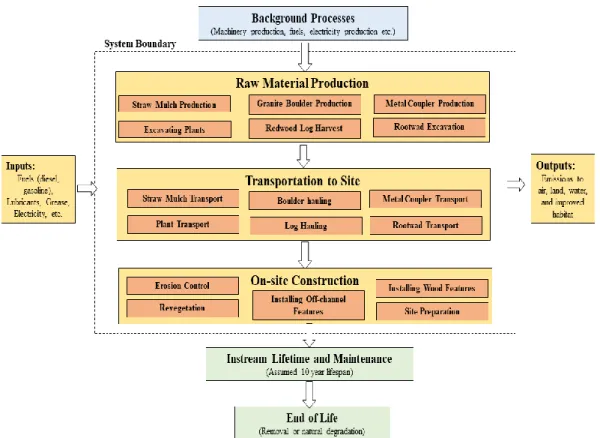
The goal of this section is to apply the ISO 14040 (2006) LCA Principles and Framework to river restoration projects, in particularly to stream habitat improvement (SHI). Applying the ISO framework to a SHI project will provide managers with the tools to evaluate their own SHI projects, or on a broader scale, to all river restoration projects. To justify the appropriate goal and scope, life cycle inventory analysis (LCI), life cycle impact assessment (LCIA), and life cycle interpretation phases, this section uses examples from the literature and adapts methods used from several key studies.
19
The raw material production phase examines the impacts associated with the collection or production of the raw materials used to conduct SHI. Raw materials may include logs, boulders, metal pieces, and other engineered materials which require some element of manufacturing (Kail et al. 2007). Studies have demonstrated that timber harvest activities and aggregate extraction have substantial environmental impacts (Dias and Arroja, 2012; Gan et al. 2016; Gayarre et al. 2015; Gonazalez-Garcia et al. 2014 Han et al. 2015).
Once these materials are harvested, mined, or produced they must be transported from the source gate to the appropriate river reach. The transportation to the site phase addresses the impacts associated with delivering raw materials and heavy equipment to the site. Some studies document substantial impacts associated with the transportation of raw materials (Gan et al. 2015; Han et al. 2015; Suwanit and Gheewala 2011), which is especially important considering the remoteness of some restorable rivers.
20
Once the materials are on-site, a certain degree of construction and manipulation must occur. The on-site construction phase addresses the impacts from site preparation, installing wood features, off-channel features, erosion control, and revegetation. These on-site activities often require the use of chainsaws and heavy equipment (Carah et al. 2014), heavy equipment operation was a frequently observed hotspot in the LCA studies (Barandica et al. 2013; Dias and Arroja, 2012; Gan et al. 2016; Gayarre et al. 2015; Stripple, 2001; Suwanit and Gheewala 2011, Zhang et al. 2015). Thus, impacts associated with heavy equipment operation are important to quantify and evaluate.
To quantify the impacts of SHI projects, this study used one meter of stream restored as a reference unit. Units of length have been used as functional units in LCA studies on roads (Stripple, 2001; Barandica et al., 2013), but units of length do not represent the true function of SHI projects. The goal of many SHI projects in California is to increase the abundance of endangered or threatened salmonids (Gallagher, 2012). The changes in fish abundance from SHI projects would be an ideal functional unit for LCA studies. However, these data may not be readily available, one study suggests that at least five years of pre- and post-installation data may be required to assess changes in fish populations (Koljonen et al., 2013). As an alternative functional unit, studies have demonstrated that stream instream structures can increase habitat complexity (Gallagher, 2012; Howson et al., 2012). A measurement of habitat complexity would provide a relatively quick approximation of one of key ecosystem functions SHI provides. In lieu of having fish abundance data this study proposes using available topographic survey data to establish a functional unit.
The LCI phase included collecting and checking all the primary data associated with each of the phases in the process flow (Figure 1). Special attention was paid to heavy equipment use because it was a frequently documented hotspot in many similar production system (Cambria and
21
20142; Gonzalez-Garcia et al. 2013; Gonzalez-Garcia 2012; Han et al. 2015). Additionally, the weights of materials and haul distances were recorded to quantify the impacts associated with transportation and raw material production (Suwanit and Gheewala, 2011). For secondary data, this study used published data sets from Ecoinvent. Ecoinvent was the most commonly used secondary data set in the studied reviewed here (González-García et al., 2013a, 2014a; McGrath et al., 2015; Rocco et al., 2015; Gan et al., 2016).
During the LCIA phase, common impact categories were global warming potential,
eutrophication, photochemical ozone formation, and acidification. To compare results from the widest range of LCA studies, a practitioner may focus on the aforementioned impact categories. This study proposes using the TRACI 2.1 impact methodology, which quantifies impacts associated with the four most commonly evaluated categories. TRACI 2.1 was created by the U.S. Environmental Protection Agency and was used in several key LCA studies in the U.S. Using TRACI will simplify the life cycle interpretation phase because allows for comparison with other similar studies.
22
very impactful. For instance, supply of aggregate has substantial impacts, particularly in upstream production processes (Gan et al. 2016; Gayarre et al. 2015). Similarly, the supply of timber logs has also shown to have substantial impacts as well (Han et al. 2015; Handle et al. 2014). SHI projects use a variety of materials to improve habitat, which include processed logs and quarried rock. The impacts associated with producing some these materials has been documented in prior studies, however, the specific approach used in river restoration has never been examined using these LCA techniques.
23 3. Methods 3.1 Quantifying Environmental Performance
24
25 3.2 Study Site
The Lower Scotts Creek Floodplain and Habitat Enhancement Project (LSCR) was installed along the lower reaches of Scotts Creek, located on the Central Coast of California along the north Coast of Santa Cruz County (Figure 3). The Scotts Creek watershed is approximately 78 km2 and is a 5th order stream network (based on LiDAR-derived drainage data). The stream originates between 500 meters and 600 meters in elevation and drains to the ocean approximately 19 kilometers north of the city of Santa Cruz (Hillard, 2015). Scotts Creek maintains the only persistent population of Central California Coast (CCC) Coho Salmon (Oncorhynchus kisutch) in the Santa Cruz Mountains Diversity Stratum. CCC Coho salmon populations within Scotts Creek have been very low (Figure 4). The degradation of habitat has been the primary cause for the decline of both CCC Coho and CCC steelhead (NMFS, 2012). Habitat loss in lower Scotts Creek was associated with a legacy of dredging, channelization, wood removal, clearing of riparian forest, and the construction of levees. The goals of the LSCR were to restore floodplain connectivity and improve salmonid habitat conditions by removing short sections of the levee, and by creating alcove habitat, off-channel pool connections, tributary connections, and LWCs.
26
increase floodplain connectivity and opportunity for refuge habitat during periods of high-flow. In the phase II, an alcove was excavated at one location for refuge habitat (Cook, 2016). The design of the project is similar in both phases, the major difference being the amount of material excavated in off-channel features. Phase I and II removed approximately 279 and 92 cubic meters or material, respectively.
The substrate size, wetted width, and depths were estimated from data collected in the field in summer 2016. The flow rates were measured at a gauging site approximately 800 meters
upstream of the study reaches. During the study period for phase I, there was only one high-flow event (< 1000 cfs). During the study period of phase II there were two high-flow events
(measuring < 1000 cfs) and two more minor flow events were recorded as well (measuring ≈ 700 and 900 cfs).
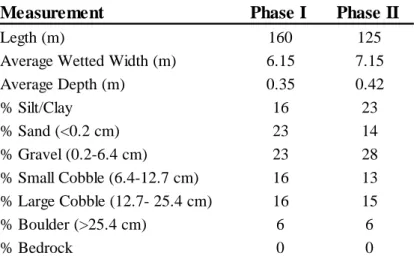
The channel substrate is made of similar alluvial substrate, dominant substrate in both reaches is mudstone, with a minor component of granitic rocks from higher in the watershed. The percent substrate and channel dimensions are also similar between both study reaches, phase II is slightly wider, deeper, and has predominantly gravel substrate, silt/clay substrate. Whereas, phase I is slightly narrower, shallow and has predominately gravel and sand substrate (Table 1).
Table 1. Selected stream measurements for Phase I and II of the LSCR.
Measurement Phase I Phase II
Legth (m) 160 125
Average Wetted Width (m) 6.15 7.15
Average Depth (m) 0.35 0.42
% Silt/Clay 16 23
% Sand (<0.2 cm) 23 14
% Gravel (0.2-6.4 cm) 23 28
% Small Cobble (6.4-12.7 cm) 16 13
% Large Cobble (12.7- 25.4 cm) 16 15
% Boulder (>25.4 cm) 6 6
27
28 3.3 LCA Study Methodology
3.3.1 LCA Goal and Scope
The goal of this LCA study is to quantify the baseline environmental impacts of phase I and II of the LSCR. The reasons for carrying out this study is to inform managers on the potential
environmental impacts of the river restoration process. The intended audience for this study will be river restoration managers, LCA practitioners, land managers, fisheries experts, hydrologists, and geomorphologists. The results of this study are to be used in comparative assertions and are intended to be disclosed to the public.
This study used a limited scope cradle-to-gate analysis which adapted an abbreviated form of the internationally accepted standards (ISO, 2006) to quantify the environmental impacts from the SHI process. The function of this system is to improve instream habitat for various fish species, specifically CCC Coho salmon. The systems boundaries were limited to the unit processes associated with raw material production, material transportation, and on-site construction associated with the SHI process. The reference unit of study was one meter of stream restored, this reference unit was later used to scale the impacts to reflect a one percent TDI increase (Figure 2). Using one percent TDI increase as the functional unit allowed the author to compare
29
the functionality of phases I and II. All of the inputs and outputs in this study were allocated to the SHI process. This study used primary data which was gathered in field during SHI
construction process and with interviews from the LSCR project manager. OpenLCA v1.7.0 (Greendelta, 2018) LCA modeling software was used along with Ecoinvent (Ecoinvent, 2016) secondary data to quantify the environmental impacts from the SHI process.
3.3.2 Assumption and Limitations
This study was designed to inform river managers, LCA practitioners, and other land
management agencies on the environmental impacts of SHI. Furthermore, the techniques used here are designed to be reproduced by river managers, who may not be familiar with LCA techniques. Due to this, data and other technicalities were kept to a minimum, to cater to those interested parties who may not be familiar with LCA.
This was a limited scope LCA study, which modeled the cradle-to-gate impacts of the SHI process. The emissions associated with instream life and end-of-life are not considered and are assumed to minimal (Dietterick, Robins, personal comm. 2017). The installations in this project were assumed to have a lifespan of ten years. Ten years was chosen as a conservative option (similar structures are designed to stay in place 25 years (Cederholm et al., 1997)) and was based off the 10-year flood recurrence interval for which the instream structures were rated to be able to withstand.
30
were substituted for similar processes. For instance, the quarrying of granite boulders was not available. The author chose to represent this process with a gravel production process which incorporated mining and other similar processes. Similarly, the logging activities were
represented using global low-intensity secondary forest management processes. This unit process was chosen because it was the closest approximation redwood forest management that is
practiced in this region of California, USA.
The life cycle impacts were the focus of this study, data on associated ecological disturbances were not collected. For example, this study did not account for the impacts associated with tree removal or the physical impacts from equipment usage. Many of these impacts were mitigated, for instance, each tree which was removed during on-site construction was replaced with three tree seedlings. This study did not account for the impacts associated with transporting crews to the job site. For critical review this study was critiqued by three thesis committee members and was presented in the form of a thesis document. The committee members included an expert in LCA, hydrology, and restoration ecology.
3.3.3 Life Cycle Inventory (LCI)
31
volume of the logs was estimated using the scribner method. The excavating of rootwads was modeled using a machine operation process. The amount of time on the excavator was estimated from field notes. Similarly, A mid-sized backhoe was used to excavate plant materials, the amount of time on the backhoe was estimated with input from landowners. The production of straw mulch was modeled using a straw production process, whose weight was estimated from field notes. The production of machinery was included in equipment operation unit processes. The key inputs to the raw material production phase were the weights of the materials, the amount of time operating equipment, and the equipment horsepower (Table 2).
The transportation to site phase of this LCA modeled the impacts associated with the trucking of raw materials and heavy equipment from the source-gate to the job site. The weights of boulder ballasts and rootwads were estimated in the field and with input from the project manager and
Table 2. LCI inputs and technical notes for raw material production phase of the LSCR.
Item Input Unit Activity
Granite Boulder 32000 lbs. Four boulders quarried
Steel Metal Coupler 8 kg Creating industrial metal fasteners
Zinc coating 250 in2 Galvanizing metal pieces
Epoxy resin, liquid 0.25 kg Used to set metal couplers
Excavating Plants 16 hrs Running a Case 580 super L, Backhoe Production
Redwood Log Harvest 7.8 m3 Logging four redwood trees
Rootwad Excavation 2 hrs Four redwood rootwads excavated from jobsite Straw Mulch Production 1080 lbs. 24 bales of straw mulch for erosion control
Item Input Unit Activity
Granite Boulder 40000 lbs. Four boulders quarried
Steel Metal Coupler 8 kg Creating industrial metal fasteners
Zinc coating 250 in2 Galvanizing metal pieces
Epoxy resin, liquid 0.25 kg Used to set metal couplers
Excavating Plants 8 hrs Running a Case 580 super L, Backhoe Production
Redwood Log Harvest 7.8 m3 Logging four redwood trees
Rootwad Excavation 2 hrs Four redwood rootwads excavated from jobsite Straw Mulch Production 540 lbs. 12 bales of straw mulch for erosion control
32
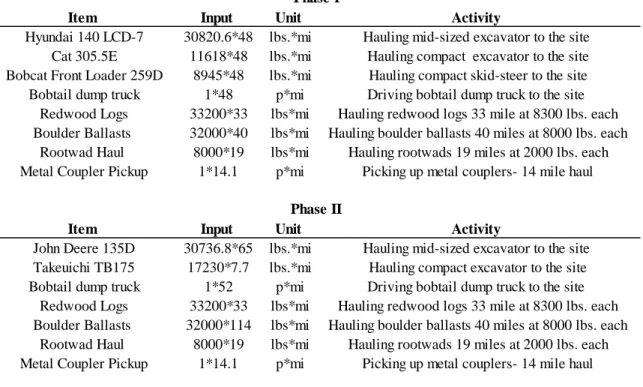
equipment operators. The weight of the redwood logs was estimated by scaling several of the logs in the LSCR and using the Scribner method. The haul distances were estimated from field notes, input from the project managers and contracting groups. Rootwads, boulders, redwood logs, and heavy equipment required large haul trucks to deliver materials. Additionally, heavy equipment transportation was considered as a key transportation process. Data in this phase was entered separately for phases I and II. The key inputs to this group was the weight of material, the type of vehicle used to deliver the material, and the transportation distance (Table 3). Additionally, the backhaul distances were modeled. This study assumed that haul trucks would return to their original departure point. Haul trucks were assumed to be empty unless they were hauling pieces of heavy equipment. Furthermore, the infrastructure maintenance, machinery manufacturing and associated upstream processes were included within the transportation unit processes.
Item Input Unit Activity
Hyundai 140 LCD-7 30820.6*48 lbs.*mi Hauling mid-sized excavator to the site Cat 305.5E 11618*48 lbs.*mi Hauling compact excavator to the site Bobcat Front Loader 259D 8945*48 lbs.*mi Hauling compact skid-steer to the site Bobtail dump truck 1*48 p*mi Driving bobtail dump truck to the site
Redwood Logs 33200*33 lbs*mi Hauling redwood logs 33 mile at 8300 lbs. each Boulder Ballasts 32000*40 lbs*mi Hauling boulder ballasts 40 miles at 8000 lbs. each
Rootwad Haul 8000*19 lbs*mi Hauling rootwads 19 miles at 2000 lbs. each Metal Coupler Pickup 1*14.1 p*mi Picking up metal couplers- 14 mile haul
Item Input Unit Activity
John Deere 135D 30736.8*65 lbs.*mi Hauling mid-sized excavator to the site Takeuichi TB175 17230*7.7 lbs.*mi Hauling compact excavator to the site Bobtail dump truck 1*52 p*mi Driving bobtail dump truck to the site
Redwood Logs 33200*33 lbs*mi Hauling redwood logs 33 mile at 8300 lbs. each Boulder Ballasts 32000*114 lbs*mi Hauling boulder ballasts 40 miles at 8000 lbs. each
Rootwad Haul 8000*19 lbs*mi Hauling rootwads 19 miles at 2000 lbs. each Metal Coupler Pickup 1*14.1 p*mi Picking up metal couplers- 14 mile haul
Phase I
Phase II
33
The on-site construction phase of this LCA modeled the impacts associated with installation of the LSCR. This study broke the construction phase into five elements including, site preparation, installing off-channel features, installing wood features, conducting erosion control, and
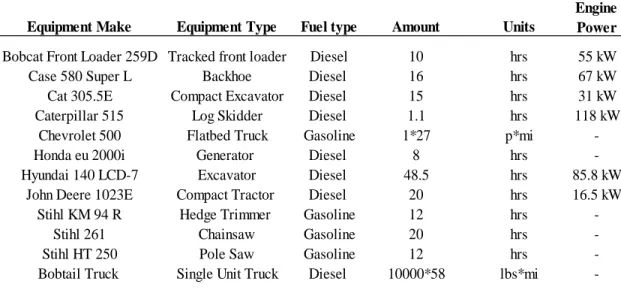
revegetating disturbed areas. A variety of equipment was used to conduct these five restoration elements. Erosion control and revegetation primarily used hand tools and small trucks to move people and materials around the site. Site preparation primarily used small-engine equipment to create access corridors for heavy equipment along riparian areas. Installing off-channel features and wood features required the use of a variety of heavy equipment including excavators, skid steers, and dump trucks. The key inputs to this group was the type of equipment, equipment horsepower, material weights, travel distances, and the number of hours spent operating each piece (Table 4 and 5). The upstream production of machinery was included in equipment operation unit processes.
Table 4. LCI inputs and technical notes for on-site construction phase I of the LSCR
Units
Bobcat Front Loader 259D Tracked front loader Diesel 10 hrs 55 kW
Case 580 Super L Backhoe Diesel 16 hrs 67 kW
Cat 305.5E Compact Excavator Diesel 15 hrs 31 kW
Caterpillar 515 Log Skidder Diesel 1.1 hrs 118 kW
Chevrolet 500 Flatbed Truck Gasoline 1*27 p*mi
-Honda eu 2000i Generator Diesel 8 hrs
-Hyundai 140 LCD-7 Excavator Diesel 48.5 hrs 85.8 kW
John Deere 1023E Compact Tractor Diesel 20 hrs 16.5 kW
Stihl KM 94 R Hedge Trimmer Gasoline 12 hrs
-Stihl 261 Chainsaw Gasoline 20 hrs
-Stihl HT 250 Pole Saw Gasoline 12 hrs
-Bobtail Truck Single Unit Truck Diesel 10000*58 lbs*mi
-Phase I
Amount
34 3.3.4 Life cycle impact assessment (LCIA)
Data were gathered in excel spreadsheets and entered into the LCA modeling software package OpenLCA 1.7.0 (Greendelta 2018) which was used to estimate the environmental impacts to air, water, and soil from the stream restoration process. Data outputted from the OpenLCA program were representative of restoring one meter of stream. The system boundaries were limited to the activities associated with raw material production, transportation to the site, and on-site construction.
The LCIA was summarized using the TRACI 2.1 (Tool for the Reduction and Assessment of Chemical and other environmental Impacts) impact assessment methodology which was developed by the US Environmental Protection Agency (Bare, 2011). The environmental impacts were grouped into ten categories including: photochemical ozone formation, acidification, global warming, eutrophication, respiratory effects, human
Health-non-carcinogenics, human health-Health-non-carcinogenics, ecotoxicity, ozone depletion, and resource depletion-fossil fuels. Each environmental impact category was calculated relative to a reference
unit photochemical ozone formation (ozone, kg O3 eq.), acidification (sulfur dioxide, kg SO2 eq.), Table 5. LCI inputs and technical notes for on-site construction phase II of the LSCR
Units
Case 580 Super L Backhoe Diesel 32 hrs 55 kW
Catepillar 515 Log Skidder Diesel 3.5 hrs 118 kW
Chevrolet 500 Flatbed Truck Gasoline 1*151 p*mi
-Honda eu 2000i Generator Diesel 20 hrs
-John Deere 135 D Excavator Diesel 36 hrs 69.4 kW
John Deere 1023E Compact Tractor Diesel 19 hrs 16.5 kW
Takeuchi TB 175 Excavator Diesel 27 hrs 48.2 kW
Stihl KM 94 R Hedge Trimmer Gasoline 14 hrs
-Stihl 261 Chainsaw Gasoline 16 hrs
-Stihl HT 250 Pole Saw Gasoline 14 hrs
-Bobtail Truck Single Unit Truck Diesel 22400*15 lbs*mi
-Phase II
Amount Equipment Make Equipment Type Fuel type
35
global warming (carbon dioxide, kg CO2 eq.), eutrophication (nitrogen, kg N eq.), respiratory effects (particulate matter > 2.5 microns, PM 2.5), ozone depletion
(trichlorofluoromethane, kg CFC-11 eq.), resource depletion- fossil fuels (MJ surplus). Human Health-non-carcinogenics and human health-carcinogenics categories were measured in units of comparative toxic units for humans (CTUh). Ecotoxicty is measured in units of comparative toxic units for the ecosystem (CTUe).
Baseline LCIA results were presented as non-normalized results and as normalized by the US 2008 (Person/Year) normalization factor. This expressed the results in relation to the amount of impacts emitted by the average US citizen in 2008. Which allowed for a comparison between impact categories and an expression of results that were more relatable to interested parties.
3.3.5 Key Contributor Analysis
The key contributors were identified for each one of the impact categories within the TRACI 2.1 impact methodology. Hotspots within each respective impact category by using a contribution tree and Sankey diagram function in OpenLCA 1.7.0 (Greendelta 2018). Furthermore, a sensitivity analysis was conducted to identify hot spots and assess which parameters were the most impactful to the model. During the sensitivity analysis baseline model parameters were decreased by 25%.
3.4 Scenario Analysis
36 3.4.1 Alder Scenario (AS 50% and AS 100%)
This scenario assumed that the LSCR would use the accelerated recruitment method. The accelerated recruitment technique involves falling red alders (Alnus rubra), which may be growing on the streambank or floodplain. Once these trees are felled they are placed unanchored into the stream to modify flow (Carah et al., 2014). This scenario compared the baseline scenario with: (1) a scenario which cut the amount of imported raw materials (i.e. logs, boulders,
rootwads, metal couplers) and excavator operating time required to install wood features by 50% (AS 50%). (2) a scenario which did not import any raw materials and cut the excavator operating time required to install wood features by 75% (AS10%) (Table 6).
3.4.2 Plant Sourcing (PS)
This scenario assumed that the plants were sourced from a nearby plant nursery and quantified the impacts from growing plants in a nearby greenhouse and transporting plants to the restoration site. The number of plants grown in the greenhouse reflect the number of plants which were used to conduct revegetation in the LSCR. Plants for the greenhouse scenario were assumed to be 20 % trees (weighing 10 lbs. each), 30 % mid-sized plants (weighing 5 lbs. each), and 50% smaller shrubs (weighing 1 lbs. each) (Table 6).
3.4.3 Materials Transportation (MT)
37 3.5 Quantifying Environmental Performance
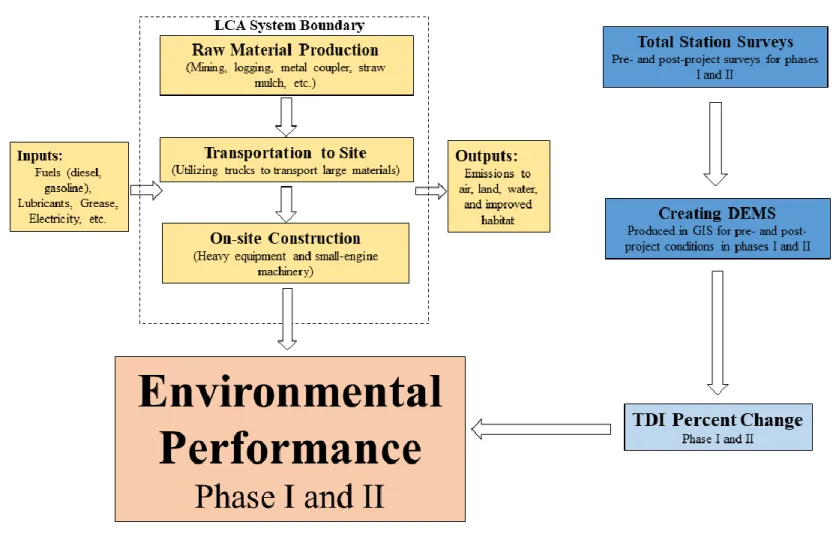
This section describes the methodology for how the total station surveys were conducted, how the DEMs were created, and how the TDI was calculated. Additionally, this section describes how the TDI was incorporated with the LCA results to quantify the environmental performance of the LSCR. Figure 2 shows the general outline for this section.
3.5.1 Total Station Surveys
A total station was used to collect topographic survey data for phase I in the summer 2014 (pre-project) and spring 2015 (post-(pre-project). Similarly, in phase II, a total station was used to collect topographic survey data in summer 2015 (pre-project) and summer 2016 (post-project). These surveys focused on capturing the topography of the active channel, nearby streambanks, and adjacent floodplain surfaces. Major break lines were shot, including the top-of-bank, bottom-of-bank, and thalweg. Additionally, a point cloud was shot between these break lines. The break lines and point cloud were intended to capture the major morphologic features of the study Table 6. Summary of the scenario analysis.
Scenario Description Material Produciton Transportation On-Site Construction
AS 50%
AS 100% Used only in-situ trees to build LWCs
No LWC materials were imported MT Doubles the transportaiton distance Doubled transportation distance PS
Assumed no changes to on-site construction Used a greater
degree of in-situ trees to build LWCs
Operation time requrie to installing wood features
was cut by 50% Produced half of the
materials used to contruct LWCs
Produced no materials required to construct
LWCs
Operation time requrie to installing wood features
was cut by 75%
Replaced excavation of local plants with greenhouse grown plants
No change to material production Used greenhouse
grown plants
Estimated the weights of plants and haul distances to transport
materials from a
Assumed no changes in on-site revegetation Imported half of the of
38
reaches. There were 1,000-1,500 points shot in each survey. Each point recorded the northing, easting, and elevation of that specific location. Once these data were collected they were offloaded into excel spreadsheets and checked for quality and data gaps.
3.5.2 DEMs
In phase I, the point cloud was used to build a triangular irregular network (TIN) surface AutoCAD Civil 3D by the project manager. The TIN surfaces were built by importing the point cloud and break lines in the phase I total station survey. Breaklines for the top-of-bank, bottom-of-bank, and the thalweg were drawn on the TIN surface to add definition to the features. Once the breaklines were added, the TIN surface served as the base-layer for the DEMs. Similarly, in phase II, the point cloud was used to build a TIN surface in ArcMap v. 10.2.2 by the author. The TIN surfaces were built by importing the point cloud and break lines collected in the phase II total station survey. The TIN surfaces were built using the 3D Analyst and TIN editing toolbars in ArcMap. To increase the definition of the DEMs, break lines were drawn along the top-of-bank, bottom-of-bank, and thalweg. There were four DEMs created, one from each survey period (i.e. summer 2014, spring 2015, summer 2015, and summer 2016).
3.5.3 Topographic Diversity Index (TDI) Percent Change
The base-layer DEM was used to quantify the project effectiveness by adapting the concept of Shannon’s Diversity Index (referred to as Topographic Diversity Index (TDI)). To adapt the topographic data: (1) the base layer DEM was reclassified into one-foot elevation categories; (2) the area within each one-foot category was considered a distinct category in Equation 1; (3) the total TDI was summed for each DEM.
𝐄𝐪. 𝟏 𝑇𝐷𝐼 = − ∑𝑅𝑖=1(𝑃i)Ln(Pi)
39
Pi equals a proportion between of area within a given individual category and the total area in all categories
R equals the total number categories
This equation served as a quantitative indicator for the effectiveness of the LSCR and helped establish a functional unit of study for the LCA (Figure 2). This methodology allowed for a speedy quantification of the project benefits, as increasing habitat complexity is often a goal of SHI projects and is especially beneficial for salmonids (Solazzi et al., 2000; Hafs et al., 2014).
3.5.4 Environmental Performance
40 4. Results 4.1 Baseline LCIA
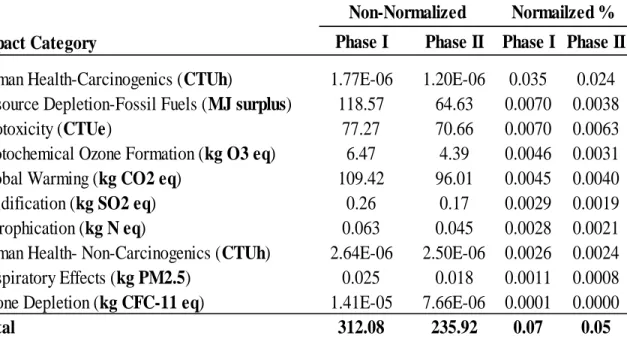
The LCIA results for the phase I and II baseline scenarios are reported on a per meter basis in Table 5. Phase I had ≈ 312 overall impact, while phase II had ≈ 236 overall impact. Phase II had lower impacts across all impact categories. In phase I, the normalized results (US 2008
[Person/Year]) assign the highest impacts to human health-carcinogenics, followed by: resource depletion, ecotoxicity, photochemical ozone formation, global warming, acidification,
eutrophication, human health- non-carcinogenics, respiratory effect, and ozone depletion. In phase II the highest impacts were associated with human health-carcinogenics, followed by ecotoxicity, global warming, resource depletion, photochemical ozone formation, human health non-carcinogenics, eutrophication, acidification, respiratory effects, and ozone depletion (Table 7).
Impact Category
Phase I
Phase II
Phase I Phase II
Human Health-Carcinogenics (
CTUh
)
1.77E-06
1.20E-06
0.035
0.024
Resource Depletion-Fossil Fuels (
MJ surplus
)
118.57
64.63
0.0070
0.0038
Ecotoxicity (
CTUe
)
77.27
70.66
0.0070
0.0063
Photochemical Ozone Formation (
kg O3 eq
)
6.47
4.39
0.0046
0.0031
Global Warming (
kg CO2 eq
)
109.42
96.01
0.0045
0.0040
Acidification (
kg SO2 eq
)
0.26
0.17
0.0029
0.0019
Eutrophication (
kg N eq
)
0.063
0.045
0.0028
0.0021
Human Health- Non-Carcinogenics (
CTUh
)
2.64E-06
2.50E-06
0.0026
0.0024
Respiratory Effects (
kg PM2.5
)
0.025
0.018
0.0011
0.0008
Ozone Depletion (
kg CFC-11 eq
)
1.41E-05
7.66E-06
0.0001
0.0000
Total
312.08
235.92
0.07
0.05
41 4.2 Key Contributors to Impacts
The key contributors to environmental impacts were estimated for human health-carcinogenics, photochemical ozone formation, global warming, acidification, ecotoxicity, eutrophication, human health non-carcinogenics, respiratory effects, resource depletion, and ozone depletion for both phase I and II. The impact categories are listed here in order of greatest magnitude according to the US 2008 [Person/Year] normalization and weighting factor.
4.2.1 Key Contributors to Impacts in Phase I
4.2.1.1 Human Health- Carcinogenics
The contributions are primarily from installing wood features, installing off-channel features, and transporting heavy equipment which make up account for ≈55%, ≈15%, and ≈15% of the
impacts, respectively. In the installing wood feature and installing off-channel feature processes most of the impacts are associated with machine building. Machine building is upstream of the machinery operation process which modeled the operation of a large excavator (Hyundai 140 LCD-7) used to construct LWCs. Similarly, a metal working process was another hotspot in the wood feature construction, which was used to model the production of flexible couplers used to join LWCs. The impacts from transporting heavy-equipment were attributed the haul trucks used to transport the equipment (Figure 5).
4.2.1.2 Resource Depletion-Fossil Fuels
The majority of impacts stem from installing wood features, off-channel features, and heavy equipment transportation which account for ≈52%, ≈25%, and ≈15% of impacts, respectively. In installing wood features and off-channel features much of impacts stem from the operation of a large excavator (Hyundai 140 LCD-7). The upstream petroleum refinery operation was