Mining and Predicting Temporal Patterns in the Quality Evolution of
Wikipedia Articles
Haifeng Zhang Carnegie Mellon University
Yuqing Ren University of Minnesota
Robert E. Kraut Carnegie Mellon University
Abstract
Online open collaboration systems like Wikipedia are complex adaptive systems within which large numbers of individual agents and artifacts interact and co-evolve over time. A key issue in these systems is the quality of the co-created artifacts and the processes through which high-quality artifacts are produced. In this paper, we took a dynamic approach to uncover common patterns in the temporal evolution of 6,057 Wikipedia articles in the domains of roads, films, and battles. Using Dynamic Time Warping, an advanced time-series clustering method, we identified three distinctive growth patterns, namely, stalled, plateaued, and sustained. Multinomial logistic regressions to predict these different clusters suggest that the path that an article follows is determined by both its inherent attributes, such as topic importance, and the contribution and coordination of editors who collaborated on the article. Our results also suggest that different factors matter at different stages of an article’s life cycle.
1.
Introduction
Online peer-production communities have emerged as major sources of information and other social goods. They have produced quality artifacts like free encyclopedia, open source software, books and user manuals, data libraries, many of which benefit our society and lives [1]. Two prominent examples are open source software (OSS) and free encyclopedia like Wikipedia [2, 3]. An important issue in online open collaboration is how to assure work quality when the content is created and maintained by a large crowd of self-organized volunteers?
While some artifacts created by online open collaborations have been achieved high quality status [4, 2], there is great variance and unpredictability in the crowd’s work. Work quality can range from superior [4, 5] to unusable or even erroneous and misleading [6, 7].
Consequently, researchers have devoted great effort to identify factors that may influence work quality in online open collaboration [3]. Article quality has been linked to the number of editors who have contributed to an article [8], the composition of the editors and their roles and experiences [9], and the structure and process of coordination among editors [10].
Most research on Wikipedia article quality has been correlational and cross-sectional and few are longitudinal (see [11, 10, 12] for exceptions). As a result, we have limited knowledge about the process through which articles grow and develop over time. It is also unclear to what degree an article’s success is determined by “nature” (e.g., inherent characteristics of the article) or “nurture” (e.g., critical events that happened in the early stage of the article).
The dynamic trajectory of quality evolution is worth studying for at least three reasons. First, preliminary evidence suggests that the development of Wikipedia articles may be history dependent, in the sense that what occurs in an article’s early history may influence its subsequent growth. For example, [10] showed that collaboration is more productive if a small group of editors first structure an article before a large group of editors join to add and expand the content of the article. Second, although prior literature has identified multiple factors that can affect article quality, different factors may be instrumental at different stages of article development. It is virtually impossible to discern these effects unless we unpack the process through which article quality evolves over time. Third, unpacking article evolution trajectories can help facilitate the matching of editors’ effort to articles that need work. If article’s quality growth is determined by both nature and nurture, our results can help identify articles that can benefit from mobilization initiatives to increase their chances of achieving higher quality.
In this paper, we examine the dynamic evolution of Wikipedia article quality to answer two research questions: 1) What are the common trajectories through which the quality of Wikipedia articles change over Proceedings of the 53rd Hawaii International Conference on System Sciences | 2020
time and 2) What factors determine an article’s quality trajectory? We analyzed archival data from 6,057 articles in three categories of roads, films, and battles. Using an advanced time-series clustering method called Dynamic Time Warping, we identified three distinctive clusters of quality trajectories that differed in initial quality levels, ultimate quality levels, and the speed at which article quality grew. Thestalledcluster remained at low quality levels throughout their life cycles. The plateauedcluster quickly rose to level C and remained at that level for the rest of their life cycles. Thesustained cluster were continuous growers that steadily rose and achieved highest quality levels among all three clusters. We ran multinomial logistic regressions to predict the clusters and the results showed that nature and nurture jointly determine the path of an article’s quality growth. Articles created earlier in Wikipedia’s history and with higher popularity and relevance had a greater chance of following the sustained path. Articles that attracted more editors, with active talk page discussion, and had greater contribution from power editors were also more likely to follow the sustained path. Our results also suggested that different factors play different roles at different life stages of an article.
2.
Related work
2.1.
Factors that affect article quality
Prior research suggests several factors that affect Wikipedia article quality. The first factor is articles’ topical relevance and importance. Studies have shown that articles with high relevance are more likely to achieve high quality status [13, 14, 15], possibly because more relevant or important articles tend to attract greater readership, which in turn increases editor contributions [16].
The second factor is the number of editors who contribute to the article and the number of edits contributed. When many editors contribute their knowledge to create and improve article content, there is a greater chance that incomplete entries will be expanded and inaccurate information will be discovered and fixed. This “wisdom of crowds” effect is evident as there is a strong correlation between article quality and the number of edits and unique editors [8].
The third factor is the attributes, roles, and experiences of editors. [17] showed that articles edited primarily by “all-around” editors who have experiences in all types of Wikipedia work are typically of high quality; whereas articles edited by casual contributors or new editors are often of questionable quality. In addition, studies have also linked article quality to top
contributor’s experience [18], editors’ domain expertise and affiliation with WikiProjects [19].
The fourth factor is the process through which editors coordinate. Studies have shown that high-quality articles on average exhibit more intense patterns of communication and coordination as measured through edits on article talk pages, edits per editor, and quick succession edits [20, 8].
2.2.
Dynamic evolution of social systems
The importance of dynamic approaches has been highlighted by researchers in multiple disciplines including economics [21, 22], sociology [23], organization science [24] and information systems [25], partially due to the lack of research using the dynamic approach. Similarly, there have been few studies of the temporal dynamics of online open collaborations in Wikipedia (see [11, 10, 12] for exceptions).Only a few papers have examined longitudinal trends in article development or editors’ roles. For instance, [26] compared high-quality and low-quality articles and found that high-quality articles had more persistent edits that survived at least one editing periods whereas low-quality articles had more transient edits that were often changed or reverted in the same period. [27] studied the dynamics of editor roles in Wikipedia and found that although editors may enact different roles during the life cycle of an article, at the system level, the work is organized around a stable set of emergent roles. [28] noted “aggregate” or cross-sectional approaches often do not capture micro patterns and advocated for the study of temporal dynamics of socio-technical systems.
2.3.
Methods to study dynamic changes
A common approach to studying dynamic changes is to simply plot variables over time. A functional form may be also used to quantify the growth, e.g., the use of Gompertz function to characterize Wikipedia’s growth.1 These conventional methods are suitable for discerning temporal patterns for a single entity or a small number of them, but not sufficient to identify common patterns among trajectories of many artifacts. Advanced methods such as time-series clustering can be useful, and have been applied to domains like speech recognition, robotics, finance, medicine, and spatio-temporal analysis [29, 30]. The method has rarely been applied to analyze online collaborative activities like Wikipedia (see [31] for exceptions).1https://en.wikipedia.org/wiki/Wikipedia: Modelling_Wikipedia’s_growth
In general, there are three categories of time-series clustering methods: shape-based, model-based and feature-based [30]. Shape-based approaches rely on measurements of the difference in the shapes of the trajectories. Model-based approaches infer a mixture of different statistical models that are assumed to generate the observed time sequences. Feature-based approaches transform the raw time-series into feature vectors so that traditional clustering methods can be applied. The last two rely on statistical assumptions and well-crafted features, we therefore chose the shape-based method for our exploratory analysis. The key process in shape-based clustering is to measure the “distance” between two time series.
3.
Clustering Algorithms
To cluster the quality trajectories of Wikipedia articles, we applied the Dynamic Time Warping (DTW) method, which is a shape-based distance measure widely used in many domains [29].2 One benefit of
the method is that it can be applied to cases where two temporal patterns might occur at different time periods (time-shifted) or vary in speed (time-distorted). This is important because Wikipedia articles created at different time periods will have quality sequences of different lengths. DTW corresponds to the shortest “warping path” to align two temporal sequences, by moving, stretching and compressing portions of one sequence to match the other. Intuitively, DTW measures the level of difficulty of aligning two time-series sequences, with higher DTW implying greater difficulty to align the two sequences.
Assume P and Q are two time series, with P =
p1, p2, . . . , pi, . . . , pm, Q = q1, q2, . . . , qj, . . . , qn. A warping path is defined as the mapping fromP toQ
and denoted asW =w1, w2, . . . , wk, . . . , wK. We call wk= (i, j)kthewarping step, which is a point-to-point mapping of one sequence to the other. A legitimate warping path must satisfy two constraints: 1) w1 =
(1,1), wK = (m, n) and 2) if wk = (p, q) and wk−1 = (p0, q0)are two adjacent warping steps, then
0 ≤ p−p0 ≤ 1 and0 ≤ q−q0 ≤ 1. Condition 1) imposes a boundary condition to the warping path, and condition 2) ensures that warping steps are adjacent and monotonic in time [29]. The DTW distance betweenP
andQis thus defined as the minimum length over all possible warping paths:
DT W(P, Q) =min
pP
(dk) m+n ,
2There are other metrics such as EDIT distance and its variants,
Longest Common Subsequence (LCSS) distance, etc. We chose DTW because it generated the best results.
s.t.dk =d(wk) = (pi−qj)2
Note that the DTW distance above is normalized by length, i.e.,m+n, to account for differences in length. The pairwise distance d(wk) for step wk is based on an Euclidean definition. The word “dynamic” is given because the method can be computed efficiently by dynamic programming. The above DTW is also called standard DTW. There are other variants that impose constraints, such as, weights over warping steps or time windows [29]. We expeimented with different DTW methods and found that the standard DTW performed best, over the variants. We thus performed standard DTW clustering and reported our results based on it.
Besides calculating the warping distances between two time-series, we also need a clustering algorithm to assign the time series into different groups. We choseK-Medoids, a variant of the well-knownK-Means clustering method. Normally, the K-Means involves iterating between two steps: 1) assigning each data point to its nearest centroid; and 2) updating the K centroids by averaging across data points in the cluster. The K-Mediods algorithm differs from K-Means mainly in the second step. Instead of computing the new centroids, K-Medoids searches for a new “medoid” within each cluster, which is the data point that has the shortest distance (e.g., DTW distance) to all other data points in a cluster.
4.
Data and Sample
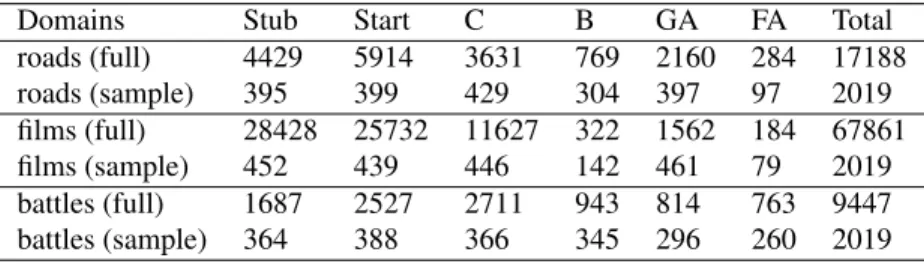
Our sample included 6,057 articles from three Wikipedia topical categories: roads, films and battles, with 2,019 articles from each category. We chose to study articles in these categories because (1) they represent a diverse set of general topics, which improves the generalizability of our findings, (2) these categories have a good distribution of articles at various quality levels, and (3) within each category, the entities are largely homogeneous, which helps control for idiosyncratic factors that may affect our analyses. To search and identify articles in these categories, we used a search tool called PetScan 3. Table 1 shows
the distribution of articles across quality levels in the three domains, where quality classes were predicted by ORES. Within each domain, we selected a stratified sample of 2,019 articles based on quality levels.
Measuring Wikipedia artifact quality is a complex endeavor. Multiple dimensions need to be considered when assessing article quality such as accuracy, comprehensiveness, currency, readability and style, richness, neutrality[14, 13, 3]. Multiple methods
Table 1. Number of articles by quality as of April 30, 2017.
Domains Stub Start C B GA FA Total
roads (full) 4429 5914 3631 769 2160 284 17188 roads (sample) 395 399 429 304 397 97 2019 films (full) 28428 25732 11627 322 1562 184 67861 films (sample) 452 439 446 142 461 79 2019 battles (full) 1687 2527 2711 943 814 763 9447 battles (sample) 364 388 366 345 296 260 2019
have been proposed to measure article quality based on article length [32] or article revision history[13] using computational models [33] or dynamic Bayesian models [34]. In this paper, we leveraged the quality scoring function available in Wikipedia Objective Revision Evaluation Service (ORES) to compute article quality. 4 ORES is a machine learning classifier that
was developed using human-labeled quality data as the ground truth and based on structural features such as revision length, number of sections and references [35]. It has been used to develop many Wikipedia applications such as task routing and vandalism fighting, and has achieved high accuracy [36, 37].
For each article in our sample, we constructed a temporal sequence of monthly quality observations starting from the article’s creation to April 2017. We computed article quality scores (QS) at the end of each month asQS, which is the weighted sum of the probabilities of an article being classified into different quality levelsL. That is
QS=
6
X
i
i∗P r(Li)
whereLi can be one of six levels (from low to high): Stub, Start, Class C, Class B, Good Article, Featured Article. {P r(Li)}i=1,2,...,6was estimated by using the wp10model available through Wikipedia ORES API.
5.
Clustering Results
5.1.
Number of clusters
A key challenge in clustering is to determine the number of clusters because the true number of clusters is generally unknown. We used two evaluation criteria to determine the proper number of clusters. The first measure is the Silhouette index [38], which is the ratio of compactness (how close articles in the same cluster are to one another) over dissimilarity (how far apart articles in different clusters are from one
4https://www.mediawiki.org/wiki/ORES
another). The index ranges from -1 to 1 with higher values showing a better fit. The second measure is within-cluster variance, which is the sum of the squared distance between each data point and the “center” of its assigned cluster [39]. According to the “elbow” criterion, the proper number of clusters corresponds to the value beyond which the marginal reduction in variance begins to drop. Interestingly, the two measures suggested different numbers of clusters (e.g., 2 clusters based on the silhouette index and 3 clusters based on within-cluster variance for road infrastructure articles). To resolve the issue, we visually examined the clustered quality trajectories and chose three clusters, because it did a better job of showing structural differences across the clusters in all three domains.
To further validate our choice of three clusters and also to compare clusters across the three domains, we proposed a novel evaluation method to quantify the distinctiveness of the clusters within each domain (so as to establish them as distinctive temporal patterns) and the similarity of corresponding clusters across domains (so as to establish the generalizability of the clusters). Table 1 shows the matrix of meandistances between pairs of quality trajectory clusters both within and across domains. The table includes 3x3 = 9 matrices. The diagonal matrices show distances across clusters within the same domain and the off-diagonal matrices show distances across clusters across different domains. Within each matrix, the diagonal cells are highlighted in bold and show the distances between similarly numbered clusters (e.g., cluster 1 in roads and cluster 1 in films) and the off-diagonal cells show the distances between differently numbered clusters (e.g., cluster 1 in roads and cluster 2 in films).
A careful examination of the three diagonal matrices showed that the diagonal cells in these matrices were significantly lower than off-diagonal cells (0.13, 0.25, 0.44 for roads; 0.14, 0.26, 0.37 for films; 0.13, 0.28, 0.48 for battles). This suggested that the three clusters within each domain were indeed distinctive from one another. In the off-diagonal matrices, the diagonal cells were also significantly lower than the off-diagonal cells,
suggesting the three clusters shared commonality across domains. In other words, the shape of cluster 1 in the roads domain was more similar to the shape of cluster 1 in the films or the battles domain than the shape of clusters 2 and 3 in these two domains. Hence, the three clusters have the potential to be generalized beyond the three domains that we examined.5
5.2.
The Three clusters
Figure 2 (a), (b) and (c) shows the three quality trajectory clusters, with 50 randomly chosen articles plotted for each cluster in each domain. The black lines show our superimposed medoids, i.e., the “centers” of the clusters.6 Visual examinations suggest that the three
clusters differ in at least three aspects: initial quality levels, final quality levels, and the speed at which quality grew over time.
We named Cluster 1 the ”Stalled” cluster because the majority of articles in the cluster remained at very low quality levels, less than level 2 or the ”Start” level, throughout their life cycles. For some reason, most articles in this cluster were trapped in the low quality state and never grow beyond the Start level. We named Cluster 2 the ”Plateaued” cluster because articles in this cluster grew quickly to quality level 3 or Class C, and then lost momentum and failed to grow beyond C levels. We named Cluster 3 the ”Sustained” cluster because most articles in the cluster grew quickly to quality levels above C and experienced continuous growth throughout their life cycles. Most articles in Cluster 3 reached level 5 or Good Article status and above. The diagram also showed that the high quality of Cluster 3 articles was the result of years of sustained effort, some of which lasted more than 10 years.
6.
Predicting Article Clusters
In the previous section, we identified three clusters of article quality trajectories. In this section, we ran multinomial logistic regressions to predict articles’ likelihood of following any of the temporal trajectories.
6.1.
Variables
Based on prior literature on Wikipedia article quality, we chose three sets of predictors: an article’s inherent attributes, editors’ characteristics and editing activities in the first three months after article creation 5We also generated the two clusters option and calculated distance
matrices. The cluster patterns failed to generalize across the three domains, which further showed the superiority of the three-cluster option.
6A medoid is the trajectory with minimal average DTW distance
to all other trajectories in the cluster.
(initial period), and editors’ characteristics and editing activities in the three months during which the article’s quality change was most similar to the main trajectory (typical change period).7
Article attributes. We examined three article
attributes: popularity, relevance, and creation time. Articles that are inherently popular and relevant to other articles tend to be of higher quality [13, 14, 15]. We defined article popularity as the degree to which Wikipedia readers are interested in the content of the article and operationalized it as the number of article views, similar to [16]. We computed the monthly average of pageviews in 2016 based on pageviews data from Wikipedia pageviews API.8
We defined article relevance as the degree to which an article is referred to by other articles, which is usually measured by PageRank scores from article link networks.We computed pageranks using pagelinks data from the September 1, 2017 data dump. Prior research has shown signs of slow growth of Wikipedia after 2007 (Haifeng, see ref below). So we included article creation time, which was computed as the number of months that elapsed since Wikipedia’s inception.
Article editing activities. Prior work suggests
that article quality is influenced by both editor contribution [8] and coordination among editors [10, 20]. So we included editor contribution and coordination in the initial three months and during the typical change period of an article. We measured early contribution by initial article length, and the number of registered editors who contributed to an article in its first three months. Following [10], we measured both “explicit” and “implicit” coordination. We measured explicit coordination as the number of editors who participated on the article’s talk pages, and we measured implicit coordination as the Gini coefficient of editors’ contributions. Higher Gini coefficient indicates greater contribution inequality among editors, which implies that a small group of editors took the lead in structuring an article before a large group of editors joined to expand the article.
We also included articles’ affiliations with WikiProjects. WikiProjects are groups of editors who “work together as a team to improve Wikipedia”, and help coordinate work around a topic. We included WikiProject affiliation as a dummy variable to indicate whether an article was affiliated with any WikiProjects 7Typical change period is defined as the three-month period during
which the sub-sequence had the minimum DTW distance to the whole article quality trajectory.
Figure 1. Comparing clusters within and across the three domains.
(a) three clusters in the roads domain
(b) three clusters in the films domain
(c) three clusters in the battles domain
Figure 2. Three clusters in three domains.
or not. We calculated the above variables for two time periods: the initial three-month period and the typical change three-month period.
Editors attributes. Prior research has shown that
editors’ attributes such as knowledge diversity [40, 9], competency and experience [41, 18], and roles [42, 43] influence article quality. We measured both general and domain-specific experiences of editors. General experience is measured by an editor’s tenure as the number of months since an editor’s first edit in Wikipedia. We measured tenure diversity as the Gini
coefficient of editors’ tenure.
We measured editor’s domain experience as the total number of edits that an editor had performed in the domain of the article during the year before the article’s creation. We included edits on article pages, article talk pages, WikiProjects pages, and WikiProjects talk pages. We used keyword match to determine whether an article or a WikiProject was within a domain. For example, we considered an article in the roads domain if its title included keywords such as road, route, highway, expressway, etc.
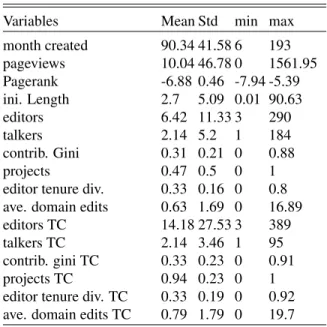
Table 2. Descriptive Statistics.
Variables Mean Std min max
month created 90.34 41.58 6 193 pageviews 10.04 46.78 0 1561.95 Pagerank -6.88 0.46 -7.94 -5.39 ini. Length 2.7 5.09 0.01 90.63 editors 6.42 11.33 3 290 talkers 2.14 5.2 1 184 contrib. Gini 0.31 0.21 0 0.88 projects 0.47 0.5 0 1
editor tenure div. 0.33 0.16 0 0.8 ave. domain edits 0.63 1.69 0 16.89
editors TC 14.18 27.53 3 389
talkers TC 2.14 3.46 1 95
contrib. gini TC 0.33 0.23 0 0.91
projects TC 0.94 0.23 0 1
editor tenure div. TC 0.33 0.19 0 0.92 ave. domain edits TC 0.79 1.79 0 19.7 TC: typical change period
Table 2 shows the descriptive statistics of all variables. Several variables such as initial length, pageviews, editors, talkers, and average domain edits were highly skewed, so we log-transformed them. We also standardized all variables before running the regressions. For generalizability, we combined articles in all three categories (roads, films, and battles) and ran multinomial logistic regression on the merged sample.
6.2.
Multinomial Logistic Regressions
Our dependent variableYiis a multinomial variable, which indicates which cluster an articleibelongs to. So we ran multinomial logistic regressions as follows:
log P r(Yi=c)
P r(Yi=c0)
=a0+a1∗X1+. . .+am∗Xm
where, P r(Yi = c)refers to the probability of article i being in cluster c; P r(Yi = c)/P r(Yi = c0) is the odds ratio, which indicates the relative likelihood of article i belonging to clustercrelative to clusterc0; X is the vector of m covariates or features, such as,
X = (X1, . . . , Xm); a = (a0, . . . , am)is the vector of coefficients. The odds ratio compares a predicted cluster with a base cluster. With three clusters in our data, we have three comparisons (Sustained vs. Stalled, Plateaued vs. Stalled, andSustained vs. Plateaued). We estimated the model using themultinormfunction in R’s nnetpackage. We checked correlation coefficients and Variable Inflation Factor (VIF) for multicollinearity. All correlations were equal to or below 0.63. The highest VIF score was 2.63, lower than the common threshold value of 5. For all correlations that were above 0.5, we repeated the analyses with only one variable and ruled out the possibility of multicollinearity.
6.3.
Regression results
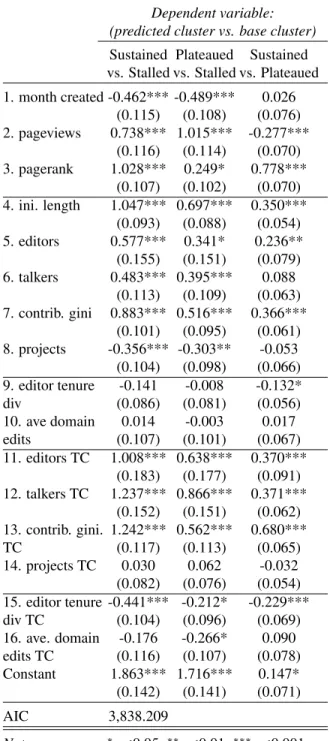
Table 3 shows our results. Column 1 indicates the influence of a factor on the likelihood of an article being in thesustained cluster versus thestalledcluster. Column 2 indicates the likelihood of being in the plateauedcluster versus the stalledcluster. Column 3 indicates the likelihood of being in thesustainedcluster versus theplateauedcluster. Standard errors are listed under the coefficients.pvalues were derived from Wald statistics.
The impact of article attributes. Rows 1-3 in Table 3 show the effects of article attributes such as month created, popularity measured aspageviews, and relevance measured as pagerank. All three factors had significant effects on an article’s likelihood of following a certain trajectory. In general, articles created earlier in Wikipedia history (-0.462, -0.489) and articles with high popularity (0.738, 1.015) or high relevance (1.028, 0.249) were more likely to be in the sustained or plateaued cluster than the stalled cluster. Between sustained and plateaued clusters, the month of creation did not seem to differentiate the two. Articles with relatively higher relevance were more likely to be sustained than plateaued (0.778) whereas articles
with relatively higher popularity were less likely to be sustained than plateaued (-0.277).
The impact of article activities and editor attributes in the initial three months. Rows 4-8 in Table 3 show the effects of article activities in the initial three months after creation. Not surprisingly, when an article was created with more content (ini.Length), it was more likely to be in the sustained or plateaued cluster than the stalled cluster (1.047, 0.697, 0.35). The number of registered editors (editors) who contributed to an article increased an article’s likelihood of being in the sustained cluster over plateaued and the likelihood of being in the plateaued cluster over the stalled cluster (0.577, 0.341, 0.236). The number of registered editors who participated in talk page discussion (talkers, as a measure of explicit coordination, increased an article’s likelihood of being in the sustained or plateaued cluster over the stalled cluster (0.483, 0.395); but had no significant impact on the likelihood between the sustained and plateaued clusters (0.088). A higher Gini coefficient (contrib.Gini), indicating greater contribution inequality among editors, increased an article’s likelihood of being in the sustained cluster over plateaued and the likelihood of being in the plateaued cluster over stalled (0.883, 0.516, 0.366). Contrary to our expectations, WikiProject affiliation (projects) reduced an article’s likelihood of being in the sustained or plateaued cluster over stalled (-0.356, -0.303). In other words, being affiliated with a WikiProject in the first three months of article creation was detrimental to an article’s long-term growth.
Rows 9-10 in Table 3 show the effects of two editor attributes: tenure diversity (editor tenure div.) and domain-specific experience (ave. domain edits). Greater tenure diversity reduced an article’s likelihood of being in the sustained cluster versus plateaued (-0.132) and had no significant impact differentiating the sustained or plateaued cluster from the stalled cluster. Domain experience measured as average edits in domain-specific articles and projects had no significant effects.
The impact of article activities and editor attributes in the three months of typical change. Rows 11-14 in Table 3 show the effects of article activities during the typical change (aka.TC) period. The effects of most factors were similar to the effects of these factors in the initial three months with a few exceptions. First, although the number of registered editors who contributed to the article was significant in both periods, the magnitude of the effects was greater in the typical change period than in the initial three months period. Second, the number of registered editors who participated in article talk page discussion also differentiated all three clusters. While the number of
talkers didn’t differentiate sustained and plateaued in the initial three months, it became a significant factor in the typical change period (0.371). This difference suggested the importance of explicit coordination in the later stage of article development. Third, Gini coefficient of contribution was significant in differentiating all three clusters, suggesting contribution inequality was not only important in the early days of an article but also important as an article matures. Fourth, different from the initial three months, affiliation with WikiProject in the typical change period had no significant effects.
Rows 15-16 in Table 3 show the effects of tenure diversity and domain-specific experience in the typical change period, which differed from the effects in the initial three months. Greater tenure diversity among editors in the later stage of article development reduced articles’ likelihood of being in the sustained cluster over the plateaued cluster (-0.229) and also reduced articles’ likelihood of being in the plateaued cluster over the stalled cluster (-0.212). Counterintuitively, domain-specific experience reduced articles’ likelihood of being in the plateaued cluster over the stalled cluster (-0.266). In other words, if editors who contributed to an article had done more edits in the domain, the article was more likely to be trapped in low quality status than growing to higher quality levels.
7.
Discussion
In this paper, we combined advanced time series clustering and multinomial regression to identify and predict dynamic patterns in the evolution of Wikipedia articles. Our analyses generated several key insights. First, our clustering generated three distinctive trajectories - stalled, plateaued, and sustained - which differed in initial quality levels, final quality levels, and the speed at which article quality grew over time.
Prior work suggested that the aggregate growth path of articles [44, 45] may follow the classic S-curve. Our clustering analysis revealed a slightly different story. Some Wikipedia articles, such as the ones in the stalled and plateaued clusters, never grew beyond low or moderate quality levels. For the articles in the sustained cluster, while some did experience a short period of rapid acceleration in quality, most achieved high quality based on years of continuous, sustained efforts.
Second, our findings showed the importance of both “nature” and “nurture” in determining article quality evolution. In terms of nature, both article creation time and article popularity and relevance influenced growth trajectories. Articles created earlier in Wikipedia history and with greater popularity and relevance had a greater chance of following the sustained trajectory.
Table 3. Multinomial logistic regression on merged samples.
Dependent variable: (predicted cluster vs. base cluster) Sustained Plateaued Sustained vs. Stalled vs. Stalled vs. Plateaued 1. month created -0.462*** -0.489*** 0.026 (0.115) (0.108) (0.076) 2. pageviews 0.738*** 1.015*** -0.277*** (0.116) (0.114) (0.070) 3. pagerank 1.028*** 0.249* 0.778*** (0.107) (0.102) (0.070) 4. ini. length 1.047*** 0.697*** 0.350*** (0.093) (0.088) (0.054) 5. editors 0.577*** 0.341* 0.236** (0.155) (0.151) (0.079) 6. talkers 0.483*** 0.395*** 0.088 (0.113) (0.109) (0.063) 7. contrib. gini 0.883*** 0.516*** 0.366*** (0.101) (0.095) (0.061) 8. projects -0.356*** -0.303** -0.053 (0.104) (0.098) (0.066) 9. editor tenure -0.141 -0.008 -0.132* div (0.086) (0.081) (0.056) 10. ave domain 0.014 -0.003 0.017 edits (0.107) (0.101) (0.067) 11. editors TC 1.008*** 0.638*** 0.370*** (0.183) (0.177) (0.091) 12. talkers TC 1.237*** 0.866*** 0.371*** (0.152) (0.151) (0.062) 13. contrib. gini. 1.242*** 0.562*** 0.680*** TC (0.117) (0.113) (0.065) 14. projects TC 0.030 0.062 -0.032 (0.082) (0.076) (0.054) 15. editor tenure -0.441*** -0.212* -0.229*** div TC (0.104) (0.096) (0.069) 16. ave. domain -0.176 -0.266* 0.090 edits TC (0.116) (0.107) (0.078) Constant 1.863*** 1.716*** 0.147* (0.142) (0.141) (0.071) AIC 3,838.209 Note: ∗p<0.05;∗∗p<0.01;∗∗∗p<0.001
In terms of nurture, article activities (e.g., number of contributing editors and their coordination) in the first three months and the typical change period influenced evolution trajectories. Contrary to prior beliefs about the benefits of articles’ WikiProject affiliation, we found that WikiProject affiliation negatively affected article quality in the first three months after article creation and
had no effects in the later stage of article development. Third, our findings suggested that different factors may play different roles depending on the life stage of an article. While factors such as the number of editors who contributed to an article or its talk pages were important throughout an article’s life cycle, they had greater impact during the typical change period than during the first three months after article creation.
Furthermore, Gini coefficient was significant and important during both the first three months and the typical change period. This implied that having a small group of editors contribute a disproportionately high percentage of edits was crucial throughout an article’s life cycle for the article to achieve high quality status. This again highlights the importance of ”core” editor in Wikipedia, as noted in many prior work [10, 46].
Higher tenure diversity among editors was more detrimental in the later stage of article evolution than the first three months. This suggests that for a stable state of article the experience levels of the volunteer editors have to be similar. Lower tenure diversity may help minimize group conflict, and ease communication.
8.
Limitations
Our work is not without limitation. First, although our exploratory work uncovered interesting patterns, more research is needed to understand the social and psychological mechanisms behind these patterns. Doing so requires qualitative data and methods and performing in-depth analyses of critical events in an article’s life cycle.
Second, some of the variables in our analyses may not be completely independent of one another. For example, a popular article may attract edits in its early days, and its success may help draw further attention. This can trigger a positive self-reinforcing feedback loop. Our findings need to be replicated with more sophisticated methods to account for these recursive relationships.
Third, we studied Wikipedia articles in three categories of roads, films, and battles. Such focus allowed us to control for noise in the data so as to observe clear patterns. We believe most of our results can be generalized to other domains on Wikipedia or other online collaboration platforms such as OpenStreetMap and Reddit, although generalization needs to be done with caution. For example, the methods could be used to cluster the growth trajectories of other artifacts like regional maps on OpenStreetMap and sub-forums on Reddit. The specific trajectories generated, however, may or may not be the same.
References
[1] Y. Benkler and H. Nissenbaum, “Commons-based peer production and virtue,”Journal of Political Philosophy, vol. 14, no. 4, pp. 394–419, 2006.
[2] K. Crowston, K. Wei, J. Howison, and A. Wiggins, “Free/libre open-source software development: What we know and what we do not know,”ACM Computing Surveys (CSUR), vol. 44, no. 2, p. 7, 2012.
[3] M. Mesgari, C. Okoli, M. Mehdi, F. . Nielsen, and A. Lanam¨aki, ““the sum of all human knowledge”: A systematic review of scholarly research on the content of wikipedia,” Journal of the Association for Information Science and Technology, vol. 66, no. 2, pp. 219–245, 2015.
[4] J. Giles, “Internet encyclopaedias go head to head,”
Nature, vol. 438, no. 7070, pp. 900–901, 2005.
[5] T. Chesney, “An empirical examination of wikipedia’s credibility,”First Monday, vol. 11, no. 11, 2006. [6] S. Caddick, “Wiki and other ways to share learning
online,”Nature, vol. 442, no. 7104, p. 744, 2006. [7] A. R. Brown, “Wikipedia as a data source for political
scientists: Accuracy and completeness of coverage,”PS: Political Science & Politics, vol. 44, no. 2, pp. 339–343, 2011.
[8] D. M. Wilkinson and B. A. Huberman, “Assessing the value of cooperation in wikipedia,” First Monday, vol. 12, no. 4, 2007.
[9] Y. Ren, J. Chen, and J. Riedl, “The impact and evolution of group diversity in online open collaboration,”
Management Science, vol. 62, no. 6, pp. 1668–1686, 2015.
[10] A. Kittur and R. E. Kraut, “Harnessing the wisdom of crowds in wikipedia: Quality through coordination,” in
ACM Conference on Computer Supported Cooperative Work, (San Diego), pp. 37–46, 2008.
[11] G. C. Kane, J. Johnson, and A. Majchrzak, “Emergent life cycle: The tension between knowledge change and knowledge retention in open online coproduction communities,” Management Science, vol. 60, no. 12, pp. 3026–3048, 2014.
[12] A. Halfaker, S. Geiger, M. Jonathan, and J. Riedl, “The rise and decline of an open collaboration system: How wikipedias reaction to sudden popularity is causing its decline,”American Behavioral Scientist, vol. 57, no. 5, p. 664688, 2012.
[13] A. Lih, “Wikipedia as participatory journalism: Reliable sources? metrics for evaluating collaborative media as a news resource,”Nature, vol. 3, no. 1, 2004.
[14] A. Br¨andle, ““too many cooks don’t spoil the broth,”,” in
International Wikimedia Conference, (Frankfurt), 2005. [15] P. Dondio, S. Barrett, S. Weber, and J. Seigneur,
“Extracting trust from domain analysis: A case study on the wikipedia project,” Autonomic and Trusted Computing, pp. 362–373, 2006.
[16] G. C. Kane and S. Ransbotham, “Content as community regulator: The recursive relationship between consumption and contribution in open collaboration communities,” Organization Science, vol. 27, no. 5, pp. 1258–1274, 2016.
[17] J. Liu and S. Ram, “Who does what: Collaboration patterns in the wikipedia and their impact on article quality,”ACM Transactions on Management Information Systems (TMIS), vol. 2, no. 2, p. 11, 2011.
[18] G. C. Kane, “A multimethod study of information quality in wiki collaboration,” ACM Transactions on Management Information Systems (TMIS), vol. 2, no. 1, p. 4, 2011.
[19] A. Kittur, B. Pendleton, and R. E. Kraut, “Herding the cats: the influence of groups in coordinating peer production,” in Proceedings of the 5th international Symposium on Wikis and Open Collaboration, p. 7, ACM, 2009.
[20] O. Arazy and O. Nov, “Determinants of wikipedia quality: the roles of global and local contribution inequality,” inProceedings of the 2010 ACM conference on Computer supported cooperative work, pp. 233–236, ACM, 2010.
[21] J. H. Holland and J. H. Miller, “Artificial adaptive agents in economic theory,” The American economic review, vol. 81, no. 2, pp. 365–370, 1991.
[22] S. Klepper, “Entry, exit, growth, and innovation over the product life cycle,”The American Economic Review, vol. 86, no. 3, pp. 562–583, 1996.
[23] J. Lerner, M. Bussmann, T. A. Snijders, and U. Brandes, “Modeling frequency and type of interaction in event networks,” Corvinus journal of sociology and social policy, vol. 4, no. 1, pp. 3–32, 2013.
[24] A. Van de Ven and G. Huber, “Longitudinal field research methods for studying processes of organizational change,” Organization Science, vol. 1, no. 3, pp. 213–219, 1990.
[25] H. Benbya and B. McKelvey, “Toward a complexity theory of information systems development,”
Information Technology & People, vol. 19, no. 1, pp. 12–34, 2006.
[26] T. W¨ohner and R. Peters, “Assessing the quality of wikipedia articles with lifecycle based metrics,” inInt. Sym. Wikis, 2009.
[27] O. Arazy, J. Daxenberger, H. Lifshitz-Assaf, O. Nov, and I. Gurevych, “Turbulent stability of emergent roles: The dualistic nature of self-organizing knowledge coproduction,” Information Systems Research, vol. 27, no. 4, pp. 792–812, 2016.
[28] B. C. Keegan, S. Lev, and O. Arazy, “Analyzing organizational routines in online knowledge collaborations: A case for sequence analysis in cscw,” in ACM Conference on Computer-Supported Cooperative Work & Social Computing, (San Francisco), pp. 1065–1079, 2016.
[29] D. Kotsakos, G. Trajcevski, D. Gunopulos, and C. Aggarwal, “Time-series data clustering,” Data Clustering: Algorithms and Applications, 2013. [30] S. Aghabozorgi, A. S. Shirkhorshidi, and T. Y. Wah,
“Time-series clustering–a decade review,” Information Systems, vol. 53, pp. 16–38, 2015.
[31] O. Arazy and A. Croitoru, “The sustainability of corporate wikis: A time-series analysis of activity patterns,” vol. 1, p. 6, 12 2010.
[32] J. E. Blumenstock, “Size matters: Word count as a measure of quality on wikipedia,” inInternational World Wide Web Conference, (Beijing), pp. 1095–1096, 2008. [33] M. Hu, E. P. Lim, A. Sun, H. W. Lauw, and B. Vuong,
“Measuring article quality in wikipedia: Models and evaluation,” in ACM Conference on Conference on Information and Knowledge Management, (New York), pp. 243–252, 2007.
[34] H. Zeng, M. A. Alhossaini, L. Ding, R. Fikes, and D. L. McGuinness, “Computing trust from revision history,” in
International Conference on Privacy, Security and Trust, (New York), p. 8, 2006.
[35] M. Warncke-Wang, D. Cosley, and J. Riedl, “Tell me more: An actionable quality model for wikipedia,” in
International Symposium on Open Collaboration, (Hong Kong), p. 8, 2013.
[36] Q.-V. Dang and C.-L. Ignat, “An end-to-end learning solution for assessing the quality of wikipedia articles,” inProceedings of the 13th International Symposium on Open Collaboration, p. 4, ACM, 2017.
[37] A. Sarabadani, A. Halfaker, and D. Taraborelli, “Building automated vandalism detection tools for wikidata,” in Proceedings of the 26th International Conference on World Wide Web Companion, pp. 1647–1654, International World Wide Web Conferences Steering Committee, 2017.
[38] P. J. Rousseeuw, “Silhouettes: a graphical aid to the interpretation and validation of cluster analysis,”Journal of computational and applied mathematics, vol. 20, pp. 53–65, 1987.
[39] M. Halkidi, Y. Batistakis, and M. Vazirgiannis, “On clustering validation techniques,” Journal of intelligent information systems, vol. 17, no. 2, 2001.
[40] O. Arazy, O. Nov, R. Patterson, and L. Yeo, “Information quality in wikipedia: The effects of group composition and task conflict,”Journal of Management Information Systems, vol. 27, no. 4, pp. 71–98, 2011.
[41] K. Carillo and C. Okoli, “Generating quality open content: A functional group perspective based on the time, interaction, and performance theory,”Information & Management, vol. 48, no. 6, pp. 208–219, 2011. [42] J. Jones, “Patterns of revision in online writing: A study
of wikipedias featured articles,”Written Communication, vol. 25, no. 2, pp. 262–289, 2008.
[43] D. Yang, A. Halfaker, R. E. Kraut, and E. H. Hovy, “Who did what: Editor role identification in wikipedia,” inAAAI Conference on Web and Social Media (ICWSM), (Cologne), pp. 446–455, 2016.
[44] G. M. Alluvatti, A. Capiluppi, G. De Ruvo, and M. Molfetta, “User generated (web) content: trash or treasure,” in Proceedings of the 12th International Workshop on Principles of Software Evolution and the 7th annual ERCIM Workshop on Software Evolution, pp. 81–90, ACM, 2011.
[45] A. Gorgeon and E. B. Swanson, “Organizing the vision for web 2.0: A study of the evolution of the concept in wikipedia,” in Proceedings of the 5th international Symposium on Wikis and Open Collaboration, p. 18, ACM, 2009.
[46] K. Panciera, A. Halfaker, and L. Terveen, “Wikipedians are born, not made: a study of power editors on wikipedia,” in ACM International Conference on Supporting Group Work, (Sanibel Island), pp. 51–60, 2009.