OBJECT RECOGNITION IN THE ANIMATION SYSTEM
Peter L. Stanchev, Boyan Dimitrov, Vladimir RykovKettering Unuversity, Flint, Michigan 48504, USA {pstanche, bdimitro, vrykov}@kettering.edu
ABSTRACT
This work is devoted to analyzing the syntax contents of an animation. In the paper we present the ANIMATION system – a system for animation scene and contents creation, retrieval and display. The object recognition mechanism in the ANIMATION system includes three steps: (1) Low level animation images analysis - element recognition based on the Attribute Relational Graphs (ARG); (2) Object recognition, based on production rules with degree of recognition; (3) Image interpretation, based on the Dempster-Shafer theory of evidence. An example of the functioning of the ANIMATION system is also given.
KEY WORDS:
Computer Animation, ComputerGraphics, Pattern Recognition, Image Segmentation, Digital Imaging, MPEG 4, MPEG 7
1.
INTRODUCTION
Recently there are numerous works in the field of animation [1, 2, 6]. In the paper we present the object recognition mechanism in the ANIMATION system – a system for animation scene and contents creation, retrieval and display. The system is based on MPEG-4 standard [3, 4]. The ANIMATION system contains three separate tools: (1) the ANIMATION editor, (2) the ANIMATION searches by contents engine, and (3) the ANIMATION display tool. The first tool of the system is an editor for preparing an animation according to the MPEG 4 standard. The second toll is a search engine by animation contents. It includes tools for specifying the animation media objects, which we search by their properties (attributes), mutual position of the search objects, and spatial-temporal changes of these objects. The object recognition mechanism in the ANIMATION system includes three steps: (1) Low level animation images analysis - element recognition based on the Attribute Relational Graphs (ARG). During the element analysis, an ARG representation of the animation scene (in terms of basic elements of the application domain, their relationships and attributes) is obtained and store in
the scene description file; (2) Object recognition, based on production rules with degree of recognition. Prolog's inference mechanism is used to perform the object recognition; (3) Image interpretation, based on the Dempster-Shafer theory of evidence. The third tool starts with the scene definition parser. It reads the scene structure and the node attribute, and builds the scene tree. It also reads all ROUTE statements and prepares the routing table for the events. An example of the functioning of the system is also given. The system can be used for different purposes including e-commerce.
2.
THE ANIMATION SYSTEM
ARCHITECTURE
The ANIMATION system contains three separate tools: (1) the ANIMATION editor, (2) the ANIMATION searches by contents engine, and (3) the ANIMATION display tool (Figure 1). A description of the system is given in [11]. ANIMATION editor ANIMATION search by contents engine ANIMATION display tool Animation description
• media objects (attributes)
• scene graph
• pre-defined spatial-temporal changes
• interactive spatial-temporal changes Animation
Query Scene definition parser Similarity measure Result animations Animation + Animation description in MPEG-4 format Render Router Animation User
Figure 1. The ANIMATION system architecture
2.1. The ANIMATION editor
The reason of this tool is to prepare an animation. The scenes are represented as a set of visual and aural
5th IASTED International Conference “Computer Graphics and Imaging”, (CGIM 2002, August 12-14, 2002,
Kauai, Hawaii, USA (27-31)
primitives. However, scenes may fall into several sub-categories. The Figure 2 describes a typical scene structure for MPEG 4 animation.
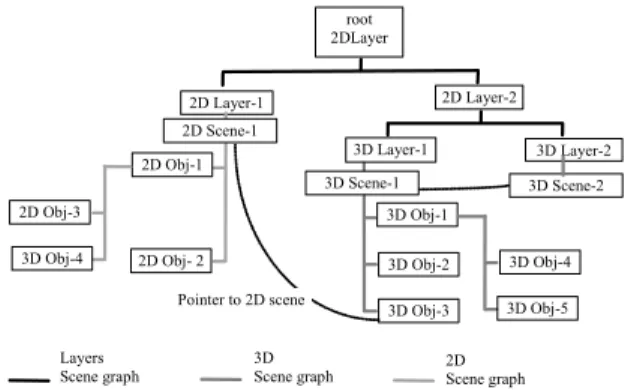
2D Layer-2 3D Layer-1 3D Obj-1 3D Layer-2 3D Obj-2 3D Obj-3 3D Obj-4 3D Obj-5 root 2DLayer 2D Layer-1 2D Obj-1 2D Obj- 2 2D Obj-3 3D Obj-4 Layers
Scene graph 3D Scene graph 2D Scene graph Pointer to 2D scene
2D Scene-1
3D Scene-1 3D Scene-2
Figure 2. Scene graph example. The hierarchy of 3 different scene graphs is shown: a 2D graphics scene graph and two 3D graphics scene graphs combined with the 2D scene via layer nodes. As shown in the picture, the 3D Layer-2 is the same scene as 3D Layer-1, but the viewpoint may be different. The 3D Obj-3 is an appearance node that uses the 2D Scene-1 as a texture node.
Media objects have both a spatial and a temporal extent. Complex objects are constructed by using appropriate scene description nodes that combine to form complex objects and thus build up the scene description tree. Objects may be located in 2D or 3D space. Each object has a local coordinate system. A local coordinate system is one in which the object has a fixed spatio-temporal location and scale (size and orientation). Objects are positioned in a scene by specifying a coordinate transformation from the object’s local coordinate system into another coordinate system defined by a parent node in the tree.
Individual scene description nodes expose a set of parameters through which several aspects of their behavior can be controlled. Examples include the pitch of a sound, the color of a synthetic visual object, or the speed at which a video sequence is to be played. A clear distinction should be made between the media object itself, the attributes that enable the control of its position and behavior, and any elementary streams that contain coded information representing some attributes of the object.
The scene description include:
1. The attributes of media objects, which define their audio-visual properties;
2. The structure of the scene graph, which contains these media objects. A scene description follows a hierarchical structure that can be represented as a tree.
3. The pre-defined spatial-temporal changes (or “self-behaviors”) of these objects.
4. The spatial-temporal changes triggered by user interaction.
2.2. The ANIMATION searches by contents
engine
The available retrieval methods in the ANIMATION system include:
1. Retrieval by object names. The retrieval by object names is similar to the retrieval in conventional database systems.
2. Retrieval by color similarity. For retrieving an animation or an object with a given color. The following methods are presented:
• pick a template from predefined images (such as a sunny sky, a clear sea, etc.) and query for the animation having images with similar color distribution;
• make an own template by using parts of stored animations and/or use drawing tools; • use a color picker to specify from a color
palette the percentage of the desired colors in the result subset (in this way a query can be formed as follows: “Show me an animation containing images with color distribution: 40% yellow and 60% blue”). 3. Retrieval by shape similarity. The departing
point in this case is the shape similarity measure based on the correspondence of visual parts. For specifying an animation containing image objects with the desired shape the user can: • draw an approximation of the object shape; • copy the shape for the query from a “shape”
gallery.
4. Retrieval by animation example similarity. For specifying an example animation the user can: • identify an animation from the animation
database;
• make their own animation.
5. Retrieval by spatial and temporal constrains. The spatial constraints are given using icons and text descriptions. There are also tools for scaling and rotating the icons and presenting a temporal change. The result subset contains the animations that contain objects arranged in a manner similar to the way shown in the query.
The retrieval value (RV) between Q and I is defined as: RVQ(I) = Σi = 1, …,n (wi * sim(qi, xi)), where wi (i
= 1, 2, …, n) is the weight specifying the importance of the i-th parameter in the animation description and sim(qi,
xi) is the similarity between the i-th parameter of the
query animation Q(q1, q2, …, qn) and analyzed animation
I(x1, x2, …, xn). sim(qi, xi) is calculated in different way
taking in account if qi, xi are symbol, numerical, linguistic
values, histograms, attribute relational graphs, pictures, interval values, temporal or spatial representations.
2.3. The ANIMATION display tool
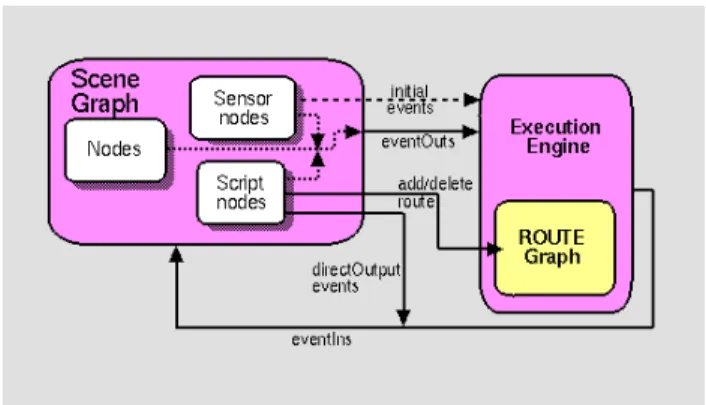
Some scene nodes generate events in response to environmental changes or user interaction. Event routing gives authors a mechanism, separate from the scene graph hierarchy, through which these events can be propagated to effect changes in other nodes. Once generated, events are sent to their routed destinations in time order and processed by the receiving node. This processing can change the state of the node, generate additional events, or change the structure of the scene graph.
The event model processes all events instantaneously in the order that they are generated. A timestamp, the time at which an event is delivered to a node, serves two purposes. First, it is a conceptual device used to describe the chronological flow of the event mechanism. It ensures that deterministic results can be achieved by real-world implementations which must address processing delays and asynchronous interaction with external devices. Second, timestamps are also made available to nodes to allow events to be processed based on the order of user actions or the elapsed time between events.
Most node types have at least one eventIn definition and thus can receive events. Incoming events are data messages sent by other nodes to change some state within the receiving node. Some nodes also have eventOut definitions. These are used to send data messages to destination nodes that some state has changed within the source node. The connection between the node generating the event and the node receiving the event is called a route. Routes are not nodes. The ROUTE statement is a construct for establishing event paths between nodes. Routes may be established only from eventOuts to eventIns.
Once a sensor has generated an initial event, the event is propagated from the eventOut producing the event along any ROUTEs to other nodes. These other nodes may respond by generating additional events, continuing until all routes have been honored. This process is called an event cascade. All events generated during a given event cascade are assigned the same timestamp as the initial event, since all are considered to
happen instantaneously. Some sensors generate multiple events simultaneously. In these cases, each event generated initiates a different event cascade with identical timestamps. Figure 3 provides a conceptual illustration of the execution model in MPEG 4 standard.
Figure 3. Conceptual view of the execution model
3. OBJECT RECOGNITION MECHANIZM
IN THE ANIMATION SYSTEM
The animation analysis includes three steps. It is an essential extension of the procedure described in [7].
3.1. Low level animation images analysis -
element recognition
Since the number of the basic graphical elements (e.g. polilines, curves, etc.) can be very large in a single frame (in order of thousands) a very efficient approach is required for recognizing the basic elements which are meaningful in the application domain. They constitute the basic symbols which compose the semantic objects in the animation scene. In this phase, it is not possible to adopt a rule system, based on a generalized interference mechanism with back-tracking, because of its computational complexity. We need instead more efficient and specialized algorithms (with polynominal complexity) even if we have to pay this with a description system less rich in semantic content. For this reason we adopted an approach based on the Attribute Relational Graphs (ARG) [8]. During the element analysis, an ARG representation of the animation scene (in terms of basic elements of the application domain, their relationships and attributes) is obtained and store in the scene description file.
3.2. Object recognition
The purpose of this phase is to compose more complex objects from the derived trough low-level image analysis basic elements. It is usually accomplished by a recursively applied production rules from a set defined for the correspondent application domain. The rules are defining also the degree of recognition (RD) of an object as a distance between objects implied in the rule and those found in the image. RD could also be calculated using fuzzy measures [9]. An interference mechanism based on backward chaining tries to derive from the basic elements more general objects and to give a recognition degree to the object recognized. In this phase a generalized inference mechanism is used. Its computation complexity is acceptable now, since fewer objects (in number of hundreds) are present in the animation scene.
After this step a sequence in the form (1) is obtained:
(1) O1 1(m1 1, l1 1), ..., O1 S1(m1 S 1, l1 S 1), ...
On 1(mn 1 , ln 1), ..., On Sn(mn S n, ln S n)
Such a sequence describes an image with n distinct physical objects. The unit Oi j(mi j, li j) is a semantic representation of the physical object I (i=1,2, … ,n) in the j-th (j=1,2, …, sj) recognition (i.e. a semantic
object). mi j and li j are respectively the RD and the list of attributes of the i-th physical object in the j-th recognition. A logic programming language Prolog is chosen to express the object recognition rules. In this case the Prolog's inference mechanism is used to perform the object recognition, as part of the image analysis function.
3.3. Image interpretation
Using a procedure similar to Barnett's scheme [10], based on the Dempster-Shafer theory of evidence [5] we convert the results obtained from the previous phase into a list of new structures containing information for each object:
(2) O11([Bel(O11, 1-Bel(not O11)], l11), ..., O1
q1([Bel(O1 q1, 1-Bel(not O1 q1)], l1 q1), ...,
On1([Bel(On1, 1-Bel(not On1)], ln1), ..., O1
q1([Bel(On qn, 1-Bel(not On qn)], ln qn),
where qi ≤ si (i=1, 2, ..., n).The function Bel(Oij,
1-Bel(not Oij)] is a belief function. In such sequence,
objects interpretations with low belief are omitted. The belief function Bel(Oi) (i=1,2, …,n) gives the total amount of belief committed to the object Oi after all evidence bearing on Oi has been pooled. The function Bel
provides additional information about Oi, namely Bel(not Oi), the extent to which the evidence supports the negation of Oi, i.e. not Oij. The quantity 1-Bel(not Oj)
expresses the posibility of Oi, i.e., the extent to which the evidence allows one to fail to doubt Oi. The interval
[Bel(Oi),1-Bel(not Oi)] is called belief interval.
4. AN EXAMPLE
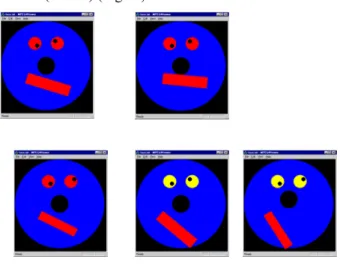
Let us develop animation with the following animation frames (scenes) (Fig. 4.)
Figure 4. An example of an animation frames
The used basic elements are shown in Figure 5. The used relations are union, intersection, contain.
Figure 5. Basic elements
Prolog rules describe the mutual positions of the elements to define a face.
A search query for the example animation could be: “Find animations which contain a face with moving mouth and eyes changing their colors from red to yellow in 5 seconds interval.”
mout
h
eye
face noose
5. CONCLUSIONS
The realized system is an example of MPEG-4 terminal application. It is written in MS Visual C++ compiler, using MFC framework library under Windows 95/NT platform. It is in state of testing. The use of the system for Internet animation retrieval is described in [11].
The main advantages of the ANIMATION system are:
1. The creation of the animation content is done automatically during the animation creation.
2. The animation scene recognition mechanism allows very powerful animation retrieval by animation content.
At present we are working on including the system as a part of a standard web browser.
REFERENCES
[1] R. Parent, Computer Animation: Algorithms and
Techniques, Morgan Kaufmann, 2001.
[2] L. Pocock, J. Rosebush, The Computer Animator's Technical Handbook, Morgan Kaufmann, San Francisco, 2001.
[3] ISO/IEC FCD International Standard 14496-1, Systems MPEG-4 Systems, 1998.
[4] MPEG Home Page - http://mpeg.telecomitalialab.com/index.htm.
[5] J. Gordon J, E. Shortliffe, The Dempster-Shafer Theory of Evidence in Rule-Based Expert Systems", in B. Buchanan, E. Shortliffe (edt.), Mycin Experiments of
the Stanford Heuristic Programming Project
(Addison-Wesley Publishing Company, 1984) 272-292.
[6] Cambridge Animation Systems - http://www.animo.com/casweb/naviga.htm.
[7] P. Stanchev, F. Rabitti, Image DataBase Management System. Applied Theories, Tools and Decisions,
Mathematical Research, Vol. 55, Academe Verlag, Berlin
1989, 208-214.
[8] M. Eshera, K. Fu, An Image Understanding Systems Using Attribute Symbolic Representation and Inexact Graph-Matching, IEEE Trans. Pattern Anal. Mach. Intell. PAMI 8, 5, 1986, 604-618.
[9] F. Rabitti, P. Stanchev, An Approach to Image Retrieval from Large Image Databases, Proc. ACM-SIGIR Conf., New Orleans, 1987, 284-295.
[10] J. Barnett, Computational Methods for a Mathematical Theory of Evidence, Proc. 7-th Inter. Joint
Conf. on Artificial Intelligence, Vancouver, BC, 1982,
868-875.
[11] P. Stanchev, ANIMATION – System for Animation Scene and Content Creation, Retrieving and Viewing,