EFFECT OF THE NANO-BIO INTERFACE ON THE GENOTOXICITY OF TITANIUM DIOXIDE NANOPARTICLES AND ASSOCIATED CELLULAR RESPONSES
Raju Yashaswi Prasad
A dissertation submitted to the faculty of the University of North Carolina at Chapel Hill in partial fulfillment of the requirements for the degree of Doctor of Philosophy in the
Department of Environmental Sciences and Engineering.
Chapel Hill 2013
Approved By: Rebecca C. Fry David M. DeMarini Ivan Rusyn
©2013
Raju Yashaswi Prasad ALL RIGHTS RESERVED
ABSTRACT
RAJU YASHASWI PRASAD: Effect of the Nano-Bio Interface on the Genotoxicity of Titanium Dioxide Nanoparticles and Associated Cellular Responses
(Under the direction of Rebecca C. Fry and David M. DeMarini)
Several toxicological studies have shown that titanium dioxide nanoparticles (nano-TiO2), one of the most widely produced engineered nanoparticles, can induce genotoxicity; however, potential adverse health effects associated with their physicochemical properties are not fully understood. Proteins in a biological medium can adsorb to the surface of the nanoparticle resulting in the formation of a protein corona that can alter the physicochemical properties of the particle. Furthermore, the protein corona may impact the interaction
between nanoparticles and cells, referred to as the nano-bio interface, effecting the uptake, distribution, and toxicity of the particles. Despite the potential influence of the composition of the biological medium on the physicochemical properties and genotoxicity of titanium dioxide nanoparticles, the majority of studies have not examined systematically the influence of medium composition on protein corona, genotoxicity, and cellular responses.
In this dissertation we tested the overall hypothesis that titanium dioxide
more by cells without inducing cell cycle arrest, thereby allowing induced DNA damage to be processed into micronuclei in BEAS-2B cells. 3) Nano-TiO2 in medium that facilitates increased cellular interaction induces the upregulation of the ATM-Chk2 DNA damage response (similar to ionizing radiation) and NF-κB inflammation pathways.
Taken together, our research provides a systematic examination of the
physicochemical properties, genotoxicity, and cellular responses induced by titanium dioxide nanoparticles. The impact of cell type and cell culture conditions must be considered when analyzing in vitro studies for a health risk assessment of engineered nanoparticles.
Therefore, we conclude that there is limited ability to make a general prediction regarding the
in vitro genotoxicity of titanium dioxide nanoparticles without understanding further the
ACKNOWLEDGEMENTS
There are so many people that have influenced my development over the past several years that I need to thank. First, I would like to thank my parents Dr. M.G. and Geetha Prasad for instilling in me a hard work ethic and for allowing me to pursue my goals. I would also like to thank my brother, Teju, for leading by example in school and in life.
I would like to thank both Dr. David DeMarini and Dr. Rebecca Fry for giving me the opportunity to pursue a Ph. D. and conduct research in both of their labs. I understand how unique my situation was, and how both of them needed to be as flexible as possible with their time and resources for me to succeed. I would also like to thank the rest of my committee: Dr. William Kaufmann, Dr. Ivan Rusyn, and Dr. James Swenberg for their valuable input and guidance during the Ph. D process. I couldn’t have asked for a more esteemed and distinguished committee. I would also like to thank my master’s advisor, Dr. David
Edwards, for encouraging me to get a Ph. D. because he thought nothing else would satisfy my intellectual curiosity.
I would like to thank all of my fellow colleagues for the interesting scientific dialogue over the past few years and for keeping my intellectual curiosity alive.
TABLE OF CONTENTS
LIST OF TABLES…..………...xi
LIST OF FIGURES……..………....xii
Chapter 1 ... 1
1.1 POTENTIAL FOR HUMAN EXPOSURE TO NANO-TIO2 IN THE ENVIRONMENT ... 4
1.2 OCCUPATIONAL EXPOSURE TO NANO-TIO2 AND EXPOSURE RECOMMENDATIONS ... 6
1.3 EPIDEMIOLOGY STUIDES ON TITANIUM DIOXIDE ... 8
1.4 GENOTOXICITY OF NANO-TIO2 ... 8
1.5 IN VIVO CARCINOGENICITY AND GENOTOXICITY STUDIES ... 9
1.6 IN VITRO GENOTOXICITY STUDIES ... 11
1.7 NANO-BIO INTERACTIONS ... 16
1.8 CELLULAR RESPONSE TO NANO-TIO2 ... 17
1.9SPECIFIC AIMS ... 20
Chapter 2 ... 23
2.1 OVERVIEW…...……….……….23
2.2 INTRODUCTION ... 24
2.3 MATERIALS AND METHODS ... 28
2.3.1 Chemicals and Instruments ... 28
2.3.3 Particle Characterization ... 30
2.3.4 Scanning Electron Microscopy ... 30
2.3.5 One-dimensional Gel Electrophoresis ... 31
2.3.6 Cell Treatment ... 32
2.3.7 Cell Line and Cell Culture ... 32
2.3.8 Live/dead Assay ... 33
2.3.9 Trypan Blue Dye-exclusion Assay ... 33
2.3.10 Flow Cytometry ... 34
2.3.11 Microscopy ... 35
2.3.12 Comet Assay ... 36
2.3.13 Cytokinesis-blocked MN Assay with Acridine-Orange Staining ... 37
2.3.14 Cell Cycle ... 38
2.3.15 Statistical Analyses ... 38
2.4 RESULTS ... 39
2.4.1 Physicochemical characterization of TiO2 nanoparticles in dry form and treatment medium. ... 39
2.4.2 Determination of cellular interaction ... 41
2.4.3 Cytotoxicity of TiO2 nanoparticles ... 42
2.4.4 Genotoxicity ... 43
2.4.5 Cell Cycle ... 44
2.5 DISCUSSION ... 44
Chapter 3 ... 51
3.1 OVERVIEW ... 51
3.3 MATERIALS AND METHODS ... 54
3.3.1 Cell lines and culture conditions ... 54
3.3.2 Nanoparticle treatment conditions ... 55
3.3.3 Scanning Electron Microscopy ... 55
3.3.4 Transmission Electron Microscopy ... 56
3.3.5 Dynamic Light Scattering Measurements ... 56
3.3.6 Cytotoxicity ... 57
3.3.7 Immunocytochemistry analysis of pH2AX, pATM, and pChk2 ... 57
3.3.8 Immunofluorescence microscopy of combed DNA fibers ... 59
3.3.9 Western blotting ... 59
3.3.10 Statistical Analysis ... 61
3.4 RESULTS ... 61
3.4.1 Nano-TiO2 form agglomerates in cell culture medium ... 61
3.4.2 Concentration dependent nano-TiO2 exposure decreases viability of human dermal fibroblasts ... 62
3.4.3 Nano-TiO2 exposure is associated with phosphorylation of H2AX, ATM, and Chk2 as determined by immunocytochemistry ... 62
3.4.4 Nano-TiO2 exposure decreases relative DNA synthesis and origin firing in human dermal fibroblasts ... 63
3.4.5 Human dermal fibroblasts respond to nano-TiO2 exposure with activation of ATM/Chk2 DNA damage response pathway ... 63
3.5. DISCUSSION ... 65
Chapter 4 ... 70
4.1 OVERVIEW ... 70
4.3 MATERIALS AND METHODS ... 74
4.3.1 Chemicals ... 74
4.3.2 Particle Preparation and Characterization ... 75
4.3.3 One-Dimensional Gel Electrophoresis ... 76
4.3.4 Cell Culture and Treatments ... 76
4.3.5 Cell Viability ... 77
4.3.6 Flow Cytometry ... 78
4.3.7 Comet Assay ... 79
4.3.8 Cytokinesis-blocked MN Assay ... 80
4.3.9 Immunocytochemistry ... 81
4.3.10 Luciferase reporter gene assay ... 82
4.3.11 Statistical Analyses ... 82
4.4 RESULTS ... 83
4.4.1 Physicochemical characterization ... 83
4.4.2 Cell viability ... 84
4.4.3 Cellular interaction with flow cytometry ... 85
4.4.4 Comet assay ... 85
4.4.5 Micronucleus assay ... 86
4.4.6 Immunocytochemistry analysis of pATM ... 86
4.4.7 Transciptional activation of NF-κB and AP-1 ... 87
4.4.8 Protein Corona, Agglomeration, Cellular interaction, and Micronucleus formation with KB and KB-Plus ... 87
4.5 DISCUSSION ... 88
5.1 SUMMARY ... 93
5.2 CONCLUSIONS ... 96
5.3 LIMITATIONS ... 101
FIGURES AND TABLES………..……….104
APPENDIX I Summary of Mammalian In Vitro Studies on the Genotoxicity of Titanium Dioxide Nanoparticles…………..……...……129
APPENDIX II Chapter 2: Supporting Information ... 132
APPENDIX III Chapter 3: Supporting Information ... 144
APPENDIX IV Chapter 4: Supporting Information ... 146
REFERENCES ... 153
LIST OF TABLES
Table 1 Physical characteristics of TiO2 nanoparticles……….…..125 Table 2 TiO2 nanoparticle characterizations in three treatment
media and H2O measured by dynamic light scattering………..126 Table 3 Summary of results from Aim #1………..127 Table 4 Size and zeta potential of nano-TiO2 in cell culture medium
(DMEM + 10% FBS) using dynamic light scattering………128 Supplemental Table 1 Representative flow cytometry experiment
showing an increase in side scatter of BEAS-2B cells treated with TiO2 nanoparticles in three
treatment media for 24 h………141 Supplemental Table 2 The effect of three treatment media on the
induction of DNA damage……….142 Supplemental Table 3 Representative flow cytometry experiment
showing cell-cycle compartments………...143 Supplemental Table 4 Average # of Nuclei/Well………...144 Supplemental Table 5 Physical characteristics of nano-TiO2 ………149 Supplemental Table 6 Polydispersion index and zeta potential
LIST OF FIGURES
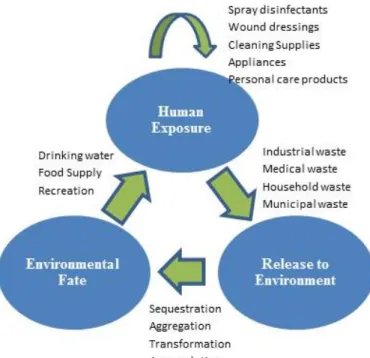
Figure 1 Potential consumer and environmental exposures to
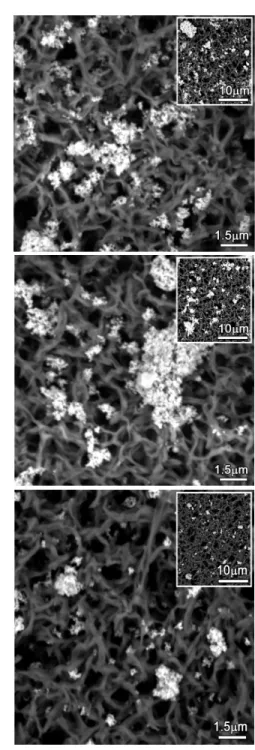
humans of engineered nanoparticles………..………..…104 Figure 2 The nano-bio interface………...105 Figure 3 Representative SEM images of TiO2 nanoparticles dispersed in
A) KB medium, B) DM medium, and C) KF medium at 200 µg/ml…………...106
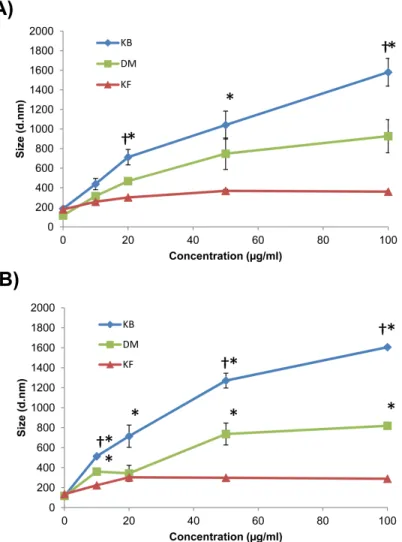
Figure 4 Characterization of TiO2 nanoparticles in treatment
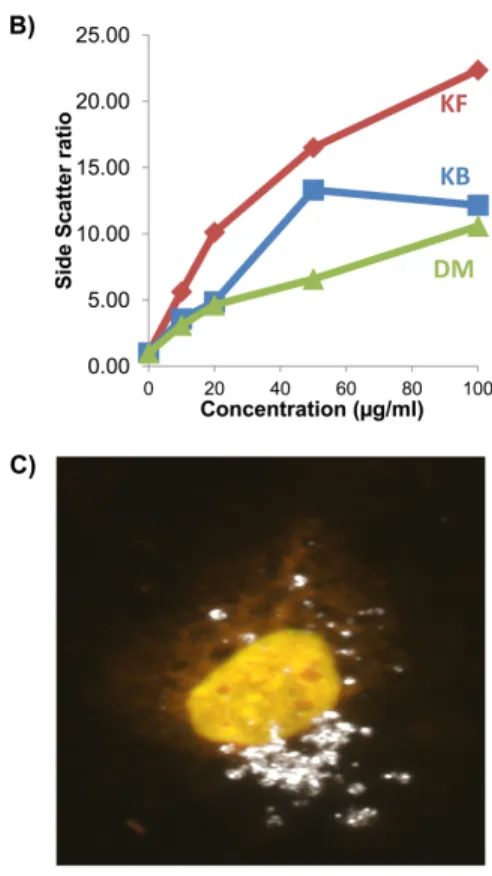
media by dynamic-light scattering………...107 Figure 5 Comparison of cellular interaction of TiO2 nanoparticles
in three different dispersion media (KF, KB, and DM) as revealed
by flow cytometer side scatter………...……….…108
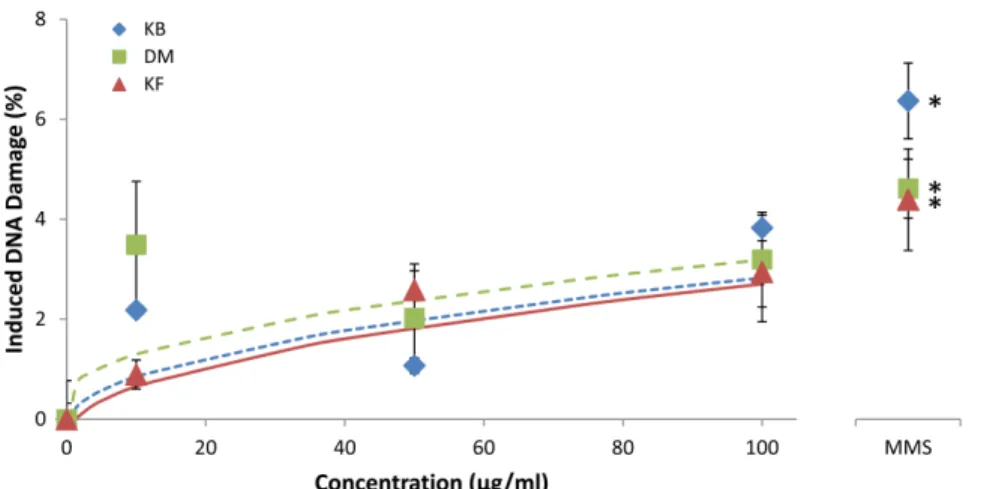
Figure 6 The effect of three different media on the induction of DNA damage (% tail DNA) in the comet assay by TiO2 nanoparticles
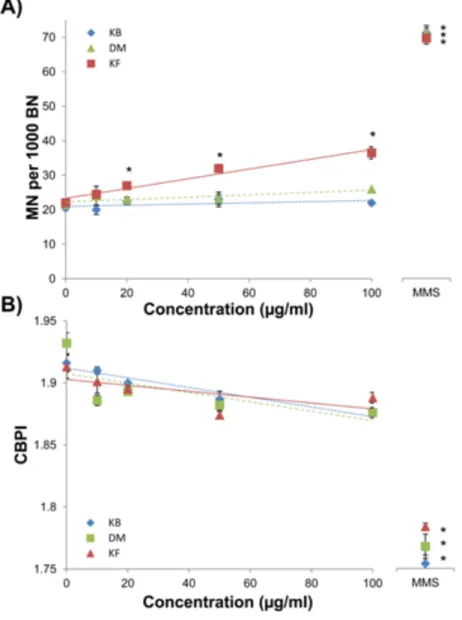
in BEAS-2B cells after a 24-h exposure………..……109 Figure 7 The effect of medium composition on the induction of
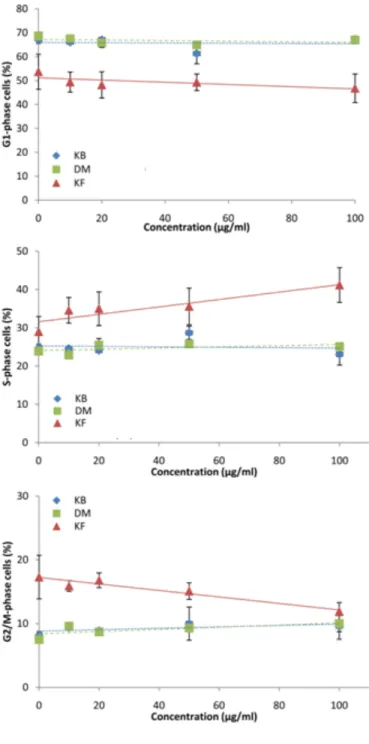
MN in BEAS-2B cells treated with TiO2 nanoparticles for 24 h……….110 Figure 8 The effect of medium composition on the cell cycle in
BEAS-2B cells treated with TiO2 nanoparticles for 24 h……….111 Figure 9 Physical characterization of titanium dioxide nanoparticles
in dry form using scanning electron microscopy……….………112 Figure 10 Cell viability of human dermal fibroblasts treated with
titanium dioxide nanoparticles using trypan blue dye
exclusion assay……….……….……....113
Figure 11 Immunocytochemical analysis oftitanium dioxide nanoparticle exposure in human dermal fibroblasts show
phosphorylation of (A) H2AX (B) ATM, and (C) Chk2 after 24 h…………...…114 Figure 12 Replication dynamics of DNA combed fibers after
treatment of human dermal fibroblasts with titanium dioxide
nanoparticles……….………...115 Figure 13 Western blotting analysis of human dermal fibroblasts
Figure 14 Intra-S checkpoint signaling in response to titanium
dioxide nanoparticle exposure for 24 h.………...………….……117 Figure 15 Characterization of nano-TiO2 in DB and DF medium
after exposure of HepG2 cells for 24 h……….…118 Figure 16 Assessment of genotoxicity in HepG2 cells after exposure
to nano-TiO2 for 24 h………..………..119
Figure 17 DNA damage and inflammatory responses of HepG2
cells after exposure to nano-TiO2 for 24 h……….………....…120
Figure 18 Effect of glucose and ionic concentrations in cell-culture medium on agglomeration, cellular interaction, and
genotoxicity in BEAS-2B cells……….………….…121
Figure 19 Proteins adsorbed to the surface of nano-TiO2 in
treatment medium and after 24 h in cell culture medium using
1D SDS-PAGE gel electrophoresis………...……....122 Figure 20 Compilation of the measurements made in all three studies………....…123 Figure 21 Four major categories of nanotoxicology studies and
associated information garnered from the dissertation aims in each
category………124 Supplemental Figure 1 Representative TEM image of P25
TiO2 nanoparticle aggregate………132 Supplemental Figure 2 Sample histogram of dynamic light
scattering of (A) KB, (B) DM, and
(C) KF medium alone………..133 Supplemental Figure 3 Sample dynamic light-scattering data
for TiO2 nanoparticles in KF………..134 Supplemental Figure 4 Sample dynamic light-scattering data
for TiO2 nanoparticles in DM...………..135 Supplemental Figure 5 Sample dynamic light-scattering data
for TiO2 nanoparticles in KB………..136 Supplemental Figure 6 SDS-PAGE electrophoresis gel of proteins
adsorbed onto surface of TiO2 nanoparticles after suspension in three treatment media
Supplemental Figure 7 Live/Dead assay of BEAS-2B cells treated with TiO2 nanoparticles in three treatment
media for 24 h……….138 Supplemental Figure 8 Trypan blue dye exclusion assay in BEAS-2B
cells treated with TiO2 nanoparticles for 24 h in
three treatment media………..139 Supplemental Figure 9 Sample of the single cell gel electrophoresis
(comet) assay………...140 Supplemental Figure 10 Transmission electron microscpy image of
human dermal fibroblast treated with nano-TiO2
for 24 h at 10 µg/ml………..144 Supplemental Figure 11 Proteins adsorbed to the surface of nano-TiO2
in DB and DF with 1D SDS-PAGE gel
electrophoresis after 24 h………...………...146 Supplemental Figure 12 Cell viability was evaluated by Cell-Titer Blue®
at a concentration range of 0.003 – 100 µg/ml in
half log increments………...………....147 Supplemental Figure 13 Cellular stress response luciferase reporter genes
for A) NFkB and B) AP1 exposed to positive control, hydroquinone (HQ) for 24 h in HepG2 cells
Chapter 1 INTRODUCTION
Nanotechnology has emerged as a strategy to address several issues in the consumer and medical industries due to the novel optical, electrical, and magnetic properties of nanomaterials, combined with their tunable size, shape and surface chemistry. Although natural particulates in the size of nanometers are not new, manufactured or engineered nanoparticles are. They have been synthesized from metal and metal oxides such as titanium dioxide, silver, and copper oxide, as well as carbon derivatives such as fullerenes and carbon nanotubes. The current definition of engineered nanoparticles is a material having at least one dimension in the range of 1 - 100 nm and expressing novel properties (NIOSH 2005).
accompanying toxicity profiles also vary greatly depending on the material. Therefore, in identifying the risk associated with engineered nanoparticles, each type of nanoparticle must be analyzed individually using exposure assessment and toxicology protocols.
Titanium dioxide nanoparticles (nano-TiO2) are being used primarily in consumer products, such as sunscreens and sporting goods as well as a photocatalyst in water to treat arsenic (NIOSH 2005, Yoon and Lee 2005), pathogens (Kim and Kwak 2009), organic pollutants, and inorganic pollutants (Ryu and Choi 2008, Shintre and Thakur 2009). This provides a multitude of avenues for human exposure (Figure 1).
Understanding the biological implications of human exposure to engineered nanoparticles will be extremely important towards their safe development and use in consumer products. The combined studies of this dissertation examine the physicochemical characteristics of titanium dioxide nanoparticles (nano-TiO2) and their subsequent impact on cellular interaction, genotoxicity, and biological response in different cell types representing human target organs. An ultimate goal for this project is to increase the knowledge on the physicochemical characteristics of titanium dioxide nanoparticles in biological medium and the subsequent impact of the particles on genotoxicity and biological pathways. These studies support future research in the understanding of engineered nanoparticles on public health.
mechanism involves passive diffusion, receptor-mediated endocytosis, and clathrin-coated vesicles as transportation mechanisms into the cell, wherein the nanoparticles can physically interact with the cellular machinery (Singh et al., 2009). Indirect mechanisms involve cell-surface contact and/or release of free metal ions, thereby initiating biological pathways such as oxidative stress and inflammation that may eventually lead to DNA damage (Bhattacharya et al., 2009; Hussain et al., 2009). The current study examines aspects of these two mechanisms for nano-TiO2.
With the burgeoning applications of nanotechnology in the consumer industry, the impact of engineered nanoparticles on human health require further examination. The significance of this study stems from:
(i) the applications of nano-TiO2 in water and sunscreens and potential for human exposure,
(ii) the current lack of regulation regarding the use of nano-TiO2 in consumer products,
(iii) previous in vitro and in vivo studies yielding inconclusive results on the genotoxicity of nano-TiO2 exposure,
(iv) the need to investigate further the mechanisms of biological response to nano-TiO2 exposure such as genotoxicity, DNA damage response, and inflammation, and
(v) the lack of information on the influence of physicochemical characteristics on the toxicity of these particles to guide safety assessment.
1.1 POTENTIAL FOR HUMAN EXPOSURE TO NANO-TIO2 IN THE ENVIRONMENT
The characteristics of nano-TiO2 make it useful for functional purposes such as the treatment of water containing arsenic as well as UV absorption in consumer products such as sunscreens. However, exposing nano-TiO2 to the body through several routes, such as ingestion, inhalation, and absorption into the skin, could result in toxic effects.
The literature on the effects of nano-TiO2 on drinking water treatment revolve around the photocatalytic treatment of As(III) into As(V), which is more easily removed due to lower solubility (Dutta et al., 2004). Li et al. (2009) used nano-TiO2 as a treatment for removal of an arsenic species in drinking water. The investigators modified the nanoparticle with palladium and nitrogen and used the particle with and without exposure to visible light. Their results showed that exposure to light for 1 h reduced the concentration of As(III) in water by over two orders of magnitude in water. This level was below the U.S. Environmental Protection Agency standard of 10 µg/L. The mechanism for this photocatalytic treatment is thought to involve hydroxyl radicals (Sharma and Sohn 2009).
The ability of nano-TiO2 to photo-catalytically degrade various forms of arsenic was reported by Xu et al. (2008, 2009). In their studies they show that in the presence of UV irradiation and TiO2, 93% monomethylarsonic acid (MMA) was transformed to inorganic arsenate [As(V)] after 72 h (Xu et al., 2008). The same group also showed adsorption of methylated arsenic species in TiO2 suspensions (Xu et al., 2009). Dimethylarsenic (DMA) was degraded as well upon photocatalysis with MMA as the primary oxidation product.
2006). They found that both As(V) and As(III) form bidentate binuclear surface complexes with TiO2. The authors suggested that TiO2 was an effective adsorbent for arsenic removal due to its high surface area and high affinityhydroxyl groups.
The ability of nano-TiO2 for water purification can also extend to other organic and inorganic pollutants. Kabra et al. (2004) has documented the use of nano-TiO2 to degrade organic compounds and reduce toxic metal ions in aqueous solutions under UV light. A study by Asahi et al. (2001) showed that nitrogen-doped nano-TiO2 was capable of photodegradating methylene blue under visible light. With the potential economic impact of cleaning hazardous waste sites reaching up to $250 billion, it will be important to develop new technologies for cleanup that may include the use of engineered nanoparticles such as nano-TiO2 (Karn et al., 2009)
potential dermal exposure may also occur due to sunscreen wash-off into water during swimming or bathing.
The properties of high surface area-to-volume ratio and high affinity hydroxyl groups have been hypothesized to be a mechanism (free radical formation in the presence and/or absence of UV lights) by which nano-TiO2 could induce toxicity (Fenoglio et al., 2009; Madl and Pinkerton 2009). Due to the increasing usage of nano-TiO2 in consumer products and water treatment procedures, it is important to determine the potential for real-world exposure and whether or not current regulations are sufficient in dealing with the added complexity of smaller sized particles. The improvement of characterization of nano-TiO2 in consumer products, the factors that affect their presentation upon exposure, and life cycle analysis are extremely important in assessing the exposure to nanoparticles and their potential health effects.
1.2 OCCUPATIONAL EXPOSURE TO NANO-TIO2 AND EXPOSURE RECOMMENDATIONS
multiple-path particle dosimetry model for the human lung, Gangwal et al. identifed alveolar retention for silver nanoparticles, carbon nanotubes, and nano-TiO2 for a working lifetime of 45 years to be in the range of 30-400 µg/ml, which they considered suitable for in vitro testing.
1.3 EPIDEMIOLOGY STUDIES ON TITANIUM DIOXIDE
To assess the literature on the effects of nano-TiO2, it is important to understand the results of epidemiologic studies. Studies that have examined occupational exposures of workers to pigment-grade (<2.5 µm) TiO2 have not found an association with increased incidence of lung cancer (Fryzek et al., 2003; Boffetta et al., 2004). Boffetta et al. (2004) studied 15, 017 workers (14,331 men) and found an increased standardized mortality ratio (SMR) of lung cancer; however, it was not associated with employment duration or estimated cumulative TiO2 exposure. Fryzek et al. (Fryzek et al., 2003) studied 4,241 TiO2 workers employed for at least 6 months and found no significant trends or exposure-risk associations for total cancers, lung cancers, or other causes of death. However, these studies made no association between particle sizes of TiO2 and effects. Epidemiological studies are needed to assess accurately the carcinogenic risk to humans of nano-TiO2. Additional studies examining biomarkers of exposure and physicochemical characteristics of the particles (i.e. size, shape, surface chemistry) that correlate to adverse outcomes would further the knowledge on nano-TiO2 exposure. It is a goal of our study to understand the physicochemical properties of nano-TiO2 in biological medium that may influence the toxicity of nano-TiO2.
1.4 GENOTOXICITY OF NANO-TIO2
the potential genotoxicity of a toxicant. By measuring genotoxicity, a mechanism of potential mutagenesis and carcinogenicity can be elucidated.
The primary focus of research published on nano-TiO2 has been on the potential of nano-TiO2 to induce genotoxicity. However, the results of these studies are conflicting and also vary in the physicochemical characterization, cell line, and cell culture medium used to assess these effects. Overall, studies range from cell culture in human cell lines to animal studies involving various routes of exposure (inhalation, intratracheal instillation, intraperitoneal injection, etc.) and target tissues (lung, liver, skin, etc.).
A review of the epidemiology literature by Roller (2009) states that, “For intentionally produced nanomaterials there is simply no adequate epidemiological information to conclude whether or not there is an association between exposure and lung cancer risk.” With the growing application of engineered nanoparticles, the potential for human exposure is undeniable. Therefore, the need to establish a consensus on testing, characterization, and toxicological effects in epidemiology, in vivo, and in vitro models are necessary to determine the degree to which engineered nanoparticles (in the particular case of this set of studies, nano-TiO2) can and should be regulated. Our study attempts to understand further the impact of the preparation of nano-TiO2 in treatment medium and cell culture medium for experimental testing.
1.5 IN VIVO CARCINOGENICITY AND GENOTOXICITY STUDIES
studies in which high-pigment grade (<2.5 µm) and ultrafine TiO2 (<100 nm) dust particles were shown to cause respiratory tract cancer in exposed rats, one observed an excess incidence in both sexes and another in females only (Borm et al., 2004; Dankovic et al., 2007; IARC 2010).
Lee et al. (1985) examined groups of 100 male and 100 female rats at 5 weeks of age
exposed by inhalation to titanium dioxide at concentrations of 0, 10, 50, or 250 mg/m3 for 6 h/day on 5 day/week for 2 years. The incidence of lung tumors was increased in both sexes in the high-dose rats (adenomas: male 12/77, female 13/74; squamous-cell carcinomas: male 1/77, female 13/74). The squamous-cell carcinomas were re-evaluated and 11 were described as non-neoplastic pulmonary keratinizing cysts (Warheit and Frame, 2006). It should be noted in this study that the titanium dioxide was not nano-sized.
Intra-peritoneally injected Wistar and Sprague-Dawley rats with photocatalytic nano-TiO2 were examined for tumors in the abdomen (Pott et al., 1987). Tumor incidences in the abdominal cavity ranged from 0-10% in the experiments in response to 5 injections of 20 mg nano-TiO2 over 5 weeks. The authors concluded that there were no increases in tumor incidence in the treated rats. Similarly, Hansen et al. (2006) did not observe tumors in rats that received subcutaneous intramuscular implantations of nano-TiO2 for up to twelve months. However, granuloma (localized nodular inflammation) was observed at the site of implantation at 6 and 12 months post-implantation.
A study on the genotoxicity of nano-TiO2 performed by Trouiller et al. (2009) examined the effect of 60-600 µg/ml of nano-TiO2 in the drinking water of mice. The mice were allowed to drink freely for 5 days, and the measured intake produced exposures in the range of 50-500 mg/kg. The endpoints included several markers of DNA damage and chromosome breakage including the comet and micronucleus assays performed in peripheral blood, γH2AX assay in bone marrow cells, and 8-OH-dG formation in livers isolated just after five
days of treatment. They found increases in all of the DNA damage markers (with γH2AX being the most sensitive- significantly elevated at all concentrations tested) in addition to an inflammatory response (assessed by expression of TNF-α, IFN-γ and IL-8) in peripheral blood. This study indicated that exposure to nano-TiO2 in drinking water was genotoxic in mice.
1.6 IN VITRO GENOTOXICITY STUDIES
The in vitro genotoxicity studies involving nano-TiO2 involve several different assays
understanding is needed. Most of the early studies used two common methodologies: the alkaline comet assay for DNA strand breaks and the cytokinesis-blocked micronucleus assay for chromosome breakage/loss. Other assays have been used as markers of DNA damage, such as the phosphorylation of H2AX and Hprt mutation assay, however, not nearly as often. Below is a detailed examination of the in vitro genotoxicity of nano-TiO2 (see Appendix A for a summary table of genotoxicity studies in mammalian cell types). Our study examines
the in vitro genotoxicity of nano-TiO2 and attempts to address knowledge gaps in the
literature related to physicochemical characterization and cellular responses.
One of the earliest in vitro studies of nano-TiO2 genotoxicity was conducted by Gurr
et al. (2005). In this study they examined nano-TiO2 in the absence of photoactivation in
Another in vitro experiment that examined toxicity and oxidative stress response elicited by nano-TiO2 was Park et al. (2008). Exposure of cultured cells led to cell death, reactive oxygen species (ROS), reduced glutathione, and the induction of oxidative stress-related genes such as heme oxygenase-1, thioredoxin reductase, glutathione-S-transferase, catalase and a hypoxia inducible gene. Inflammatory proteins were upregulated, including IL-8, which the authors showed to be induced by the p38 MAPK and/or ERK pathways.
A study of human peripheral blood lymphocytes exposed to nano-TiO2 was performed by Kang et al. (2008). In addition to confirming DNA strand breakage and micronucleus induction, they identified an accumulation of p53 and activation of DNA damage checkpoint kinases. They also saw generation of reactive oxygen species that was confirmed through inhibition by N-acetylcysteine (NAC). This study found a cellular cascade involving p53 that was affected by nano-TiO2 treatment.
A thorough examination of the cytotoxicity and genotoxicity of nano-TiO2 in WIL2-NS cells (lymphoblasts) treated at 6, 24 and 48 h with concentrations of 0, 26, 65, and 130 µg/ml was reported by Wang et al. (2007). A significant decrease in viability was seen at higher doses, along with increases in the frequency of micronuclei. The comet assay, which assesses DNA strand breaks, showed a 5-fold increase at 65 µg/ml. Lastly, increases in mutant frequency as assessed by the Hprt mutation assay were shown with 130 µg/ml. The results further suggest that nano-TiO2 can cause genotoxicity and cytotoxicity in human cells.
72 h). They found that micronuclei frequency was significantly elevated from control at 1 µg/cm2 at each time point. Additionally, they found that the micronuclei were kinetochore-negative, which means that nano-TiO2 caused chromosome breakage rather than aneuploidy.
ROS is a common hypothesis for the mechanism of engineered nanoparticle toxicity. Shukla et al. (2011) examined the potential of nano-TiO2 to induce ROS-mediated genotoxicity as measured by the comet and micronucleus assay in human epidermal cells. Additonally, they showed a positive correlation (using regression analysis) between ROS-production and increases in micronucleus formation and oxidative DNA damage ROS-production using the formamidopyrimidine DNA glycosylase (Fpg) enzyme, which specifically recognizes oxidative DNA damage.
In the midst of all the positive in vitro data on the genotoxicity of nano-TiO2, both Bhattacharya et al. (2009) and Hackenberg et al. (2009) did not find any DNA damage induced by nano-TiO2 with the comet assay in IMR-90/BEAS-2B cells or peripheral blood lymphocytes, respectively. Furthermore, neither study observed much cytotoxicity in the cells as well. Bhattacharya et al. did note an increase in DNA adduct formation (8-OH-dG) with nano-TiO2 exposures of 5 and 10 µg/cm2 and also saw increases in the production of reactive oxygen species at 10 and 50 µg/cm2 at 6, 12, and 24 h. These studies contribute to the ongoing debate over the genotoxicity of nano-TiO2.
nano-TiO2 and subsequently its genotoxicity. The impact of biological medium on the physicochemical properties of nano-TiO2 and the subsequent effect on genotoxicity in human cell culture is a primary aim of this study. Furthermore, the impact of the biological medium on the toxicity of nano-TiO2 may help to predict more accurately the in vivo toxicity of these nanoparticles.
The body of literature on the toxicological effects of nano-TiO2 is still incomplete. The inconsistencies in reporting on physicochemical characteristics as well as the differences in biological endpoints in vitro and in vivo underscore the need for further testing. Comprehensive studies that elucidate further the complexities of the novel properties of engineered nanoparticles and the ability to elicit toxicological effects are paramount to advancing the field.
1.7 NANO-BIO INTERACTIONS
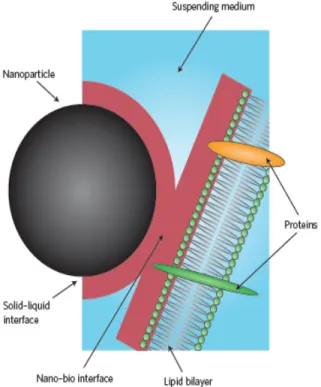
Several studies suggest that a nanoparticle-protein interaction, referred to as the protein corona, can occur when proteins attach to the surface of the nanoparticle. This protein coating can become part of the surface that interacts with the cell membrane as in Figure 2(Nel et al., 2009; Maiorano et al., 2011). This interaction has been shown to play a role in the physicochemical characteristics of nanoparticles and play a role in the cellular uptake, gene expression, and toxicity of engineered nanoparticles (Albanese et al., 2012). Understanding this process is important for the design of nanoparticles for drug delivery and to understand the potential toxicity of nanoparticles.
(a surfactant lipid) increased the production of reactive oxygen species by carbon black particles (Foucaud et al., 2007), whereas Pluronic F127 (a surfactant) dispersion resulted in lower toxicity of single-walled carbon nanotunes and amorphous silica nanoparticles (Dutta et al., 2007); and fetal bovine serum (FBS) dispersion resulted in lower toxicity of gold nanorods (Hauck et al., 2008). FBS also was shown to result in greater cellular uptake of nano-TiO2 in comparison to serum-free medium (Tedja et al., 2012).
Depending on the compound, its size/shape, the route of exposure, and distribution within the body, engineered nanoparticles have the potential to interact with a variety of biological components, such as protein. This interaction can lead to the association of a protein corona that elicits a toxicological response by changing the nanoparticle-cell interaction. Additionally, when including targeted ligands that have become important in the applicability of engineered nanoparticles to complex diseases, the protein corona may impede the efficacy and possibly induce off-target effects.
One of the primary goals of the studies is to identify the role of the protein corona on the genotoxicity of nano-TiO2. By adequate physicochemical characterization of nano-TiO2 in both dry form and in various dispersions reflecting biological medium, we can identify which characteristics of nano-TiO2 can contribute to its genotoxicity and cellular response.
1.8 CELLULAR RESPONSE TO NANO-TIO2
mitochondria to the cytosol. The levels of caspase-3 and caspase-9 in addition to Bax, cytochrome C, p53 and Bcl-2 were also shown to be upregulated in BEAS-2B cells (Shi et al., 2010a). Both of these studies suggest nano-TiO2 induced apoptosis involving an intrinsic mitochondrial pathway.
Wu et al., (2010) studied the effects of nano-TiO2 on cytotoxicity, cell cycle and
biological pathways in PC12 (neuronal) cells. They found an upregulation in JNK and p53 as well as G2/M cell cycle arrest. The authors suggest that reactive oxygen species were responsible for the activation of toxicity pathways. The oxidative stress mechanism of toxicity was also shown in mice exposed to nano-TiO2 for 30 consecutive days (Wang et al., 2011a). The study showed increases in the expression of heme oxygenase-1 via the p38-Nrf-2 signaling pathway.
An argument has been made for using the biology of particle-induced oxidative stress as a basis for predictive modeling of engineered nanoparticle toxicity (Nel et al., 2006). This hypothesis is due to the direct relationship between surface area, reactive oxygen species production, and inflammatory effects of nanoparticles that have been shown in the lung (Nel 2005; Oberdorster et al., 2005). In addition to an increased production of reactive oxygen species, studies by Jaeger et al. (2012) and Shukla et al. (2011b) have also shown significant decreases in the anti-oxidant glutathione and increased frequency of micronuclei after nano-TiO2 exposure in HaCaT keratinocytes. These results suggest that increased production of reactive oxygen species may be a cause of the genotoxicity of nano-TiO2.
BEAS-2B cells, including catalase and superoxide dismutase. Another study examining nano-TiO2 exposure in human amnion epithelial (WISH) cells found a 1.87-fold increase in intracellular reactive oxygen species generation, significant reduction in catalase activity and glutathione levels, as well as an increase in G2/M cell cycle arrest and DNA double strand breaks with the neutral comet assay (Saquib et al., 2012).
Identifying the cellular response to a toxicant is paramount in determining biomarkers of exposure as well as mechanisms of toxicity. Investigation of signaling pathways can also reveal similarities and differences between toxicants. Studies have indicated the role of reactive oxygen species in the toxicity of nano-TiO2. Although nano-TiO2 has been shown to induce both reactive oxygen species and genotoxicity, their effect on inflammation and DNA damage response are not well defined. In our study, we assess the role of the nano-bio interface on the potential for nano-TiO2 to induce genotoxicity and upregulate adverse outcome pathways of DNA damage response and inflammation.
The primary goals of our study are to:
(i) understand the physicochemical characteristics that can lead to the cellular interaction and genotoxicity of nano-TiO2,
(ii) identify the cellular stress response to nano-TiO2 as represented by the DNA damage response and inflammation pathways and
(iii) use an integrated approach to examine the effects of nano-TiO2 on different organs using three cell lines representing the lung, skin and liver.
surfactant, and fetal bovine serum) on the agglomeration of nano-TiO2. We examine further the genotoxicity, cellular interaction, and cell cycle differences in human lung epithelial (BEAS-2B) cells. In chapter 3, we build upon the results of chapter 2 by investigating the DNA damage response to nano-TiO2 in human dermal fibroblasts using two known genotoxic pathways associated with: (i) ultraviolet light: ataxia telangiectasia mutated and Rad3 related (ATR) and its downstream kinase checkpoint kinase 1 (Chk1) and (ii) ionizing radiation: ataxia telangiectasia mutated (ATM) and its downstream kinase checkpoint kinase 2 (Chk2). In chapter 4, we analyze two treatment media (one supplemented with bovine serum albumin and the other with fetal bovine serum) and its’ subsequent impact on agglomeration, genotoxicity, and cellular interaction in a human hepatoma (HepG2) cell line. Additionally we analyze the key mediators of DNA damage response (ATM) and inflammation.
By adequate physical characterization in dry form and dispersion (agglomeration, zeta potential, nanoparticle-protein interaction, and cellular interaction), we aim to provide a systematic assessment of nanoparticle physicochemical characterization, interaction with the cell, and impact on genotoxicity in three different cell lines representing three target organs. Subsequently, we intend to examine the biological response to nano-TiO2 in three different cell types.
1.9 SPECIFIC AIMS
genotoxicity, and that upon exposure, cells will initiate signaling of key mediators of DNA damage and inflammation stress responses.
This hypothesis will be tested using three specific aims:
The goal of aim 1 is to determine whether nanoparticle-protein interactions influence the cellular uptake, cell-cycle, and genotoxicity of nano-TiO2 in human lung epithelial (BEAS-2B) cells. In the first aim, we propose to examine the effects of nanoparticle-protein interactions on cellular uptake, cell-cycle progression, and genotoxicity by creating three different dispersion media (serum-free media, media containing BSA and surfactant to mimic bronchoalveolar lavage fluid, and media with 10% fetal bovine serum). We will use flow cytometry to assess cellular uptake and cell-cycle, the comet assay to assess DNA damage, and the micronucleus assay to determine chromosome damage. The hypothesis of aim 1 is that nanoparticle-protein interactions that elicit the smallest aggregates will induce genotoxicity in human lung epithelial cells.
The goal of aim 2 is to establish the effects on replication dynamics and DNA damage response of nano-TiO2 in human dermal fibroblasts. In the second aim, we propose to assess DNA replication dynamics and new origin firing using DNA combed fibers, and the DNA damage response in human dermal fibroblasts following exposure to TiO2 nanoparticles by analyzing phosphorylation of H2AX and DNA repair pathways (ATM-Chk2, ATR-Chk1) using immunocytochemistry and western blotting. The hypothesis of aim 2 is that nano-TiO2 will induce a DNA damage response in human dermal fibroblasts.
Chapter 2
EFFECT OF TREATMENT MEDIA ON THE AGGLOMERATION OF TITANIUM DIOXIDE NANOPARTICLES: IMPACT ON GENOTOXICITY, CELLULAR
INTERACTION, AND CELL CYCLE 2.1 OVERVIEW
The widespread use of titanium dioxide (TiO2) nanoparticles in consumer products increases the probability of exposure to humans and the environment. Although TiO2 nanoparticles have been shown to induce DNA damage (comet assay) and chromosome damage (micronucleus assay, MN) in vitro, no study has systematically assessed the
influence of medium composition on the physicochemical characteristics and genotoxicity of TiO2 nanoparticles. We assessed TiO2 nanoparticle agglomeration, cellular interaction, induction of genotoxicity, and influence on cell cycle in human lung epithelial cells using three different nanoparticle-treatment media: keratinocyte growth medium (KGMTM) medium plus 0.1% bovine-serum albumin (KB); a synthetic broncheoalveolar lavage fluid containing PBS and 0.6% bovine-serum albumin and 0.001% surfactant (DM); or KGMTM with 10% fetal bovine serum (KF). The comet assay showed that TiO2 nanoparticles induced similar amounts of DNA damage in all three media, independent of the amount of
nanoparticles in KF demonstrate an association between medium composition, particle uptake, and nanoparticle interaction with cells, leading to chromosomal damage as measured by the MN assay.
2.2 INTRODUCTION
The number of consumer and commercial products containing nanoparticles already exceeds 800 and is growing at an exponential rate (Singh et al., 2009). Metal oxide
nanoparticles, in particular, are currently present in the environment due to industrial processes and consumer products available on the market (NIOSH 2011). This increased usage requires an improved understanding of the potential risks and hazards associated with human exposure. Specifically, it is critically important to identify those physicochemical characteristics of nanoparticles that may cause detrimental health effects.
Titanium dioxide (TiO2) nanoparticles, which are one of the most widely used engineered nanoparticles, are used in sunscreens and cosmetics because of their absorptive properties, and have also been used as a wastewater disinfectant due to their photocatalytic properties (Singh et al., 2009). The National Institute for Occupational Standards and Health has made efforts to determine two different size/concentration levels for worker safety due to the potential for nano-sized TiO2 particles to cause toxicity (NIOSH 2011).Furthermore, the crystal structure of TiO2 nanoparticles has been shown previously to play a role in the toxicity of such nanoparticles, with the anatase isoform inducing greater inflammation than the rutile isoform in vivo (Warheit et al., 2007).
genotoxicity of TiO2 nanoparticles. In some studies TiO2 nanoparticles showed no significant induction of DNA damage based on the comet assay in human peripheral blood lymphocytes (Hackenberg et al., 2011)or BEAS-2B/IMR-90 cells (Bhattacharya et al., 2009). However, other studies found that TiO2 nanoparticles induced DNA damage in BEAS-2B (Falck et al., 2009; Gurr et al., 2005), GFSk-S1 cells (Hackenberg et al., 2010),and peripheral blood lymphocytes (Kang et al., 2008). Based on results with the MN assay, researchers have found that TiO2 nanoparticles induce chromosomal damage in BEAS-2B cells at 24 h (Gurr et al., 2005);in SHE fibroblasts at 12, 24, 48, 66, and 72 h (Rahman et al., 2002); in WIL2-NS cells at 6, 24, and 48 h (Wang et al., 2007); and in peripheral blood lymphocytes in vitro at 12, 24, and, 48 h (Kang et al., 2008). However, another study in BEAS-2B cells showed a significant increase in MN only after a 72-h exposure but not after a 24- or 48-h exposure (Falck et al., 2009).
A potential explanation for this discrepancy is in the preparation of the nanoparticles as well as the type of medium in which the cells are cultured and/or treated. Nanoparticle-protein interactions (referred to as the “Nanoparticle-protein corona” or the association of Nanoparticle-proteins in a biological medium with the surface of the nanoparticle) have been hypothesized to play an important role in the uptake, distribution, and toxicity of nanoparticles in biological systems; however, it is still unclear how this occurs (Dutta et al., 2007; Lundqvist et al., 2008; Nel et al., 2009; Maiorano et al., 2010; Monopoli et al., 2011;). For example, reactive-oxygen species (ROS) produced by exposure to carbon black particles in a Monomac-6 cell line were increased when medium containing 1% bovine serum albumin (BSA) and/or 0.025%
264.7, a macrophage-like cell line (Dutta et al., 2007). Gold nanorods induced less toxicity in HeLa cells when serum was used in the cell-culture medium, and this was associated with reduced cellular uptake (Hauck et al., 2008). On the other hand, silica suspended in
bronchoalveolar lavage (BAL) fluid showed no differences in the induction of pulmonary inflammation and lactate dehydrogenase in A549 (a human lung cell line) compared to a phosphate buffer solution (Sager et al., 2007).
Despite the apparent role of medium composition and other factors on the
genotoxicity of TiO2 nanoparticles, no systematic assessment of these parameters has been performed (Gonzalez et al., 2008; Doak et al., 2009; Johnston et al., 2009; Donaldson et al., 2010). Consequently, there is no consensus or harmonized guidance on how to prepare nanoparticles for in vitro toxicity testing or to formulate the composition of the medium. Additionally, there is no consensus on what physicochemical characteristics of the particles should be determined and reported or for the physicochemical characteristics that may influence genotoxicity (Donaldson et al., 2010).Some genotoxicity studies have not characterized the nanoparticles in dispersion (Gurr et al., 2005); nonetheless, physical characteristics such as surface area, primary particle size, and agglomeration/stability of the dispersion are thought to play a role in the toxicity of nanoparticles (Wick et al., 2007; Stone et al.; 2009, Ji et al., 2010; Tenzer et al., 2011).
multi-walled carbon nanotubes) in the presence or absence of 10% serum in A549 cells after a 4-h exposure and showed increases in MN frequency in cells treated with ZnO in the presence of serum. Thus, there is a need to determine the most appropriate procedures by which to characterize TiO2 nanoparticles, to measure their uptake into cells, and to evaluate their genotoxicity in order to produce data useful for assessing the safety of nanoparticles (Maynard et al., 2006; Nel et al., 2006).
purity, and crystal structure by transmission-electron microscopy (TEM) and visualized TiO2 nanoparticles in each treatment medium with scanning electron microscopy (SEM). We also assessed whether proteins in each treatment medium were adsorbed to the nanoparticle surface using sodium dodecyl sulfate-polyacrylamide gel electrophoresis (SDS-PAGE). Lastly, we determined the hydrodynamic diameter/size, polydispersion index (PdI), and zeta potential by dynamic-light scattering (DLS), as well as cellular interaction and cell-cycle effects by flow cytometry (Zucker et al, 2010; Zucker et al., 2012).
2.3 MATERIALS AND METHODS
2.3.1 Chemicals and Instruments
We used three different nanoparticle-treatment media. A medium with a low concentration of protein (KB) was composed of KGMTM (Lonza, Walkersville, MD) plus 0.1% BSA (Sigma, St. Louis, MO). The dispersion medium (DM) was composed of PBS supplemented with a moderate level of protein in the form of BSA at 6.0 mg/ml (0.6%) and 1,2-dipalmitoyl-sn-glycero-3-phosphocholine (DSPC) at 10 µg/ml (0.001%) and was purchased from Sigma-Aldrich. A serum-containing medium (KF) was composed of KGMTM plus 10% FBS (Invitrogen).
2.3.2 Particle Preparation
For the KB or KF dispersion, pre-weighed TiO2 nanoparticles were suspended in KGMTM medium with 0.1% BSA (KB) or KGMTM with 10% FBS (KF) at 1 mg/ml and probe sonicated at 7 W for 2 min on ice; subsequent dilutions in KB and KF were made to 500, 200, and 100 µg/ml.
2.3.3 Particle Characterization
Nanoparticles were characterized in dry form using TEM (University of Kentucky) and in medium using DLS and zeta potential measurement techniques. All nanomaterial preparations were diluted 1:10 in KGMTM and subjected to dynamic-light scattering analysis at 0 and 24 h for size and zeta potential measurements and calculations. Approximately 1 ml of each concentration (0, 10, 20, 50, and 100 µg/ml) was placed in a sizing cuvette (Sarstedt, Nümbrecht, Germany) and measured by the Zetasizer Nano at 37 ºC (Malvern Instruments, Worcestershire, UK). Intensity and PdI measurements at each concentration were at 0 and 24 h. The refractive index used for the measurements was 2.51, reflecting a 14% rutile, 86% anatase mixture. Samples were placed in a humidified incubator at 37ºC between
measurements. For zeta potential each concentration was measured using a zeta-potential cuvette (Malvern Instruments, Worcestershire, UK) at 0-h time point only. All particle characterization measurements are the mean ± SD of three independent experiments.
2.3.4 Scanning Electron Microscopy
Stock TiO2 nanoparticle suspensions were prepared as described previously in different treatment media at a concentration of 1 mg/ml. Suspensions were then
instrument, Sigma-Aldrich) at room temperature until analyzed by SEM. SEM micrographs of nylon filters containing various nanoparticle-dispersion samples were obtained using the Phenom Tabletop SEM (Phenom-World NA, Inc., Beaverton, OR). Briefly, nylon filters were mounted onto metal stubs using double-backed adhesive carbon tape. The immobilized filter on the stubs was placed in the sample holder and the height adjusted so that the top of the filter was ~2 mm below the holder’s surface. The holder was placed in the Phenom and loaded automatically. At the low magnification, our detection limit is 100 nm without carbon coating; with carbon coating, the vendor specifies the lower-size limit as 30 nm.
Magnification, focus, brightness/contrast, sample position, and image gathering were carried out by the use of an integrated touch screen and rotary-adjustment knob according to the manufacturer’s instructions.
2.3.5 One-dimensional Gel Electrophoresis
To determine the proteins adsorbed onto the surface of the TiO2 nanoparticles in each
treatment medium, SDS-PAGE gel electrophoresis of the nanoparticles in each treatment
medium, along with the treatment medium alone, was performed as described previously,
with some modifications (Lundqvist et al., 2008, ; Maiorano et al., 2010; Tedja et al., 2012;
Tedja et al., 2012a). TiO2 nanoparticles were diluted in each treatment medium (KB, DM,
and KF) at 1 mg/ml and sonicated as described previously. After incubation for 24 h, 1 ml of
each suspension was transferred to a separate tube and centrifuged at 12,000 x g for 15
min. The supernatant was aspirated, and the remaining pellets were washed with PBS and
centrifuged again. After the supernatant was removed, the TiO2 nanoparticles and equal
volumes of each treatment medium were mixed with 2X Protein Gel Loading Buffer (Fisher
TiO2 nanoparticles in each treatment medium) were loaded onto 8-16% SDS-PAGE 1D gels
(Thermo Scientific) along with a Fermentas PageRuler™ Plus protein ladder (Thermo
Scientific), and a constant voltage of 125 V for 45 min was applied. The gel was fixed with
water for 15 min, stained using Gel Code Blue Stain (Thermo Scientific) for 3 h, followed by
destaining with water for ~1 h. Gel images were taken using a Gel Logic 2200 Pro imager
and analyzed with MI SE 534 program (Carestream Health, Rochester, NY). Three
independent experiments were performed to ensure reproducibility. A representative gel is
shown in Supplemental Figure 5.
2.3.6 Cell Treatment
Cells at 5.0 x 10⁴ cells/cm2 were seeded in T-25 flasks, incubated for 48 h, and then treated for 24 h with nanoparticles. For these treatments, the new nanoparticle preparations (KB, DM, and KF) were diluted 1:10 in KGMTM to provide concentrations of 0, 10, 20 (except for the comet assay), 50, and 100 µg/ml TiO2. For the MN assay the cells were treated at ~60% confluence to ensure growth-phase characteristics, and fresh medium was added with the cytochalasin-B treatment. For the comet assay the cells were treated at ~80% confluence.
2.3.7 Cell Line and Cell Culture
BEAS-2B (ATCC), a human bronchial epithelial cell line, was maintained in serum-free Keratinocyte Basal Medium (KBMTM, Lonza) supplemented with KGMTM
with 5% CO2. The cells were subcultured every 3-4 days or when they reached 85-90% confluency using HBSS (Lonza), Versene (Invitrogen), TrypLE (Invitrogen), and Trypsin Neutralizing Solution (Lonza). Cells were centrifuged at 135 x g for 5 min, the supernatant was aspirated, and the cell pellet was re-suspended in fresh medium and brought to a concentration of 5 x 10⁴ cells/cm2. The cytochalasin-B was dissolved in PBS at 1 mg/ml. For the comet assay, SYBR-Gold was purchased from Molecular Probes (Eugene, OR) and diluted 1:200 in 1x TE buffer.
2.3.8 Live/dead Assay
Calcein-AM and propidium iodide were purchased from Invitrogen (Carlsbad, CA). After cells were incubated in TiO2 in appropriate medium for 24 h in 25-cm2 flasks, the medium was aspirated and replaced with fresh medium containing calcein-AM (Invitrogen) and propidium iodide (Invitrogen) at a concentration of 1 µg/ml and placed in a humidified incubator at 37ºC and 5% CO2 for 1 h. Images were taken of each concentration with WASABI imaging software (Hamamatsu) using an ORCA-ER camera (Hamamatsu) and a phase objective (Nikon, Plan 10X, na = 0.3), Nikon Diaphot 300 microscope with DAPI and FITC filters. Pictures were evaluated using a scoring grid placed on the captured images. Approximately 200 cells were counted in both Live (calcein+) and Dead (propidium iodide+) images (Supplemental Figure 6B). Live/dead experiments were performed as three
independent 24-h exposures for each treatment medium.
2.3.9 Trypan Blue Dye-exclusion Assay
treatment the cells were trypsinized, and 0.1 ml of the whole cell suspension was removed and placed in 0.5 ml of trypan blue and 0.4 ml of sterile PBS at a ratio of 1:10 for each treatment concentration. Counts were performed with a hemocytometer where unstained cells were alive, and those that were stained blue were considered dead. Trypan blue
experiments were performed as three independent 24-h exposures for each treatment medium (Supplemental Figure 7).
2.3.10 Flow Cytometry
To determine cellular uptake by flow cytometry, the method of Zucker et al. (2010) was used. Briefly, BEAS-2B cells were plated in twenty T-25 flasks (1×10⁵ cells/ml) and incubated for 48 h. After incubation, 10, 20, 50, and 100 µg/ml of TiO2 nanoparticles were prepared by sonication in 3 different media (KF, KB, and DM) as described previously. The medium in each flask was replaced with 5 ml of nano-TiO2 suspension. Each flask received treatment of TiO2 nanoparticles, and one control flask received only fresh medium.
Following 24-h exposure, cells were trypsinized, centrifuged at 135 x g for 10 min, resuspended in 0.5 ml of medium, and put directly on ice. Cellular uptake of TiO2 nanoparticles was assessed in three independent experiments.
A BD FACSCalibur™ (BD Biosciences, San Jose, CA) flow cytometer containing a 488-nm laser, forward-scatter (FSC) diode detector, and photomultiplier tube side-scatter (SSC) detector was used in this study. Prior to each experiment, the instrument was checked for functionality and performance using Duke 3.0-µm alignment beads (Zucker 2008;
Sanders et al., 2012). The instrument yielded coefficient of variation values below 2% on all the fluorescence channels at low flow rates with Duke 3.0-µm alignment beads. The
ranges of the scales were used to optimize the changes with the different concentrations. The highest concentration of nanoparticles was run first to set the range for the maximum SSC signal and the minimum FSC signal. The treated values were normalized to control values and expressed as percent increase.
2.3.11 Microscopy
Dark-field microscopy has been used by us and others to visualize nanoparticle uptake into cells (Zucker et al., 2010, Zucker et al., 2012, Sanders et al., 2012, Zucker and Daniel 2012, Hu et al., 2008, Cao et al., 2011, Weinkauf et al., 2009, Johnston et al., 2012, Thurn et al., 2011). The cells in Figure 2C were spun onto a slide using a Shannon
CytoSpinTM centrifuge at 40 x g for 5 min, fixed with 100% methanol, and stained using 40 µg/ml acridine orange for 60 sec. A Nikon E-800 microscope was used to observe dark-field and fluorescence images. The fluorescence excitation cubes consisted of FITC and TRITC. However, the dark-field image was so bright that it could be observed through either of the filter cubes. The dark field was ~100 times brighter than the fluorescence image as measured by exposure times. The combination of fluorescence and dark-field images was made
sequentially with Nikon Elements software. Co-localization was checked and measured with 0.5-µm Tetra spec beads (Molecular Probes, Eugene, OR), and there was minimal distortion. A Xenon light supply was used to optimize the shorter wavelength excitation that provided for better resolution for the dark-field image. A GG420 filter was put in the eyepieces to protect the user’s eyes from possible UV damage from the Xenon light source.
and 1.25. The lens had a sufficiently large magnification to observe cellular details and the background scatter, which could be controlled by adjusting the diaphragm. During the course of this study, the dark-field images were obtained using the following dry lenses: Plan Apo 20x, (NA 0.75), and the following oil lenses: 20x multi-immersion (MI, NA 0.75), and 60x Plan Fluor with iris (NA 1.25-0.55).
2.3.12 Comet Assay
The comet assay was performed as described previously (Singh et al., 1991). After treatment the cells were trypsinized and kept on ice throughout the duration of the slide preparation. All nanoparticle concentrations examined resulted in cell viabilities above 80%. Briefly, 10 µl of cells at 106 cells/ml (approximately 10,000 cells) were added to 190 µl of 0.53% low-melting-point agarose (LMP), and 90 µl were placed on two slides and covered by a 24- x 50-mm coverslip and placed on ice. After the agarose had solidified, the cover slip was removed, and another 90 µl of LMP was added, and a coverslip was placed on top. The cover slip was removed again, and the slides were placed in 4ºC lysis buffer (5-M NaCl, 100-mM EDTA, 10-100-mM Tris, 1% Triton X-100, pH 10.0) overnight at 4°C. Following lysis, slides were rinsed with cold water and immersed in 4ºC denaturing electrophoresis buffer (300-mM NaOH, 1-mM EDTA) for 40 min. Electrophoresis was performed in cold buffer (pH > 13) for 20 min at 25 V (1.33 V/cm) and 300 mA. Then the slides were immersed in neutralizing buffer (0.4-M Tris-HCl, pH 7.5) for 15 min, dehydrated in 95% ethanol for 3 min, and allowed to air dry.
Microphot FXA), a Nikon B-2H filter, and an ORCA CCD camera (Hamamatsu) connected to a personal computer. Images were analyzed using Komet® version 5.5 (Andor
Technology, Morrisville, NC); 50 images per slide and two slides per concentration were analyzed in each experiment. Slides were coded before analysis so that the scorer had no knowledge of the treatment when obtaining the data. Data were expressed as the mean ± SD of three independent experiments for each treatment medium and concentration tested. A representative image of undamaged and damaged cells is shown in Supplemental Figure 9.
2.3.13 Cytokinesis-blocked MN Assay with Acridine-Orange Staining
The MN assay with acridine-orange staining was performed as described previously (Ellard and Parry 1993). Cells treated with TiO2 nanoparticles for 24 h and then 5 µg/ml of cytochalasin B for 18 h were resuspended in PBS at a density of 2 x 10⁵ cells/ml. The cells from 75 µl of cell suspension were deposited onto pre-cleaned slides using a Shannon
CytoSpinTM centrifuge at 40 x g for 5 min. Slides were air dried, fixed in 100% methanol for 10 min, and stored at 20ºC.
Slides were stained in acridine orange diluted to 40 µg/ml in a 0.02-M phosphate buffer (pH 7.4) for 30-45 sec and washed twice with distilled water. A 24- x 55-cm cover glass was mounted using Sorenson’s buffer (70 ml 0.1-M NaHPO4 and 30 ml 0.1-M
al., 2003). Two independent experiments were conducted for all concentrations in all three treatment media.
2.3.14 Cell Cycle
For cell-cycle analysis BEAS-2B cells were treated with TiO2 nanoparticles for 24 h in the three different treatment media (KF, KB and DM), trypsinized, and placed on ice as described above. Cells were then prepared for flow-cytometry analysis by incubating them for 15 min at 37°C with a 1:2 dilution in 0.5% NP-40 non-ionic detergent that was made up in PBS without Ca2+ and Mg2+. The cells were then stained with propidium iodide (20 µg/ml, Molecular Probes, Eugene OR). The flow cytometer was set to measure nuclei using DNA FL2H (585/42) as the detection trigger. Nuclei sub-populations were analyzed using MultiCycle (Phoenix Flow Systems, San Diego, CA) that was incorporated into FCS express 4.0 (Denovo, Los Angeles, CA) analysis software. The percentage of cells in G1, S, and G2/M phases for all concentrations in each treatment medium were calculated from histograms using the area parameter. Two independent experiments were performed and expressed as mean ± SD (Figure 6), and a representative experiment is shown in
Supplemental Table 3.
2.3.15 Statistical Analyses
treatments produced differences among each other or from the controls. Results were considered statistically significant if p < 0.05.
In addition, for the comet assay, a linear model was used to compare the slopes of the 3 regression lines (each treatment medium) for the induced DNA damage versus the square root of the concentration after a preliminary analysis for a best-fit model. The induced DNA damage (i.e., % tail DNA of each treated concentration minus mean % tail DNA for the concurrent controls) was used as a measure of damage to normalize the data because each replicate experiment was done at a different time. The slopes of the regression lines were compared assuming a common Y-intercept set to zero using Statgraphics Centurion XVI Version 16.1.05 (Statpoint Technologies, Inc., Warrenton, VA). For the MN assay simple linear-regression analyses were performed with StatGraphics Centurion XVI for each concentration-response curve for each medium. For the two independent cell-cycle
progression experiments for each medium, linear regression analysis was performed similar to that done by Potter et al. (Potter et al., 2002; Potter et al., 2005)but only on the change in percentage of cells in S phase. If p < 0.05, then the regression was deemed significant, and the medium caused an effect on cell cycle.
2.4 RESULTS
2.4.1 Physicochemical characterization of TiO2 nanoparticles in dry form and treatment medium.
Kentucky. A representative image is shown in Appendix II Figure 1, and the results are presented in Table 1. The primary particle size was measured to be ~27.5 nm, with a surface area of 49 m2/g, and the particles were a mixture of anatase and rutile crystal structures. As illustrated by SEM in Figure 3, TiO2 nanoparticles were qualitatively different in all three treatment media. The KF medium resulted in smaller agglomerated nanoparticles compared to those observed in the other two media.
DLS was used to measure hydrodynamic diameter, PdI, and zeta potential of nanoparticles in suspension. We initially measured each treatment medium alone and determined that the protein concentrations did not confound the DLS results (Appendix II Figure 2). DLS measurements of TiO2 nanoparticles in the three treatment media showed that KB resulted in the largest agglomerates, followed by DM and then KF (Figure 4A). After 24 h at 37ºC, the suspension in KB showed larger agglomerates with increasing concentration from the 0-h size measurements, whereas KF did not. DM showed slightly elevated agglomerates at 24 h, with a significant increase compared with KF. Agglomerates in KB were still significantly greater than DM and KF after 24 h (Figure 4B).
We also calculated the PdI, which is a measure of the variance in size measurements, for each concentration in each treatment medium (Table 2). The values for all concentrations in all treatment media were between 0.2 and 0.8, with KB yielding the highest PdI values and KF yielding the lowest. Zeta potential, a measure of electrokinetic potential that indicates the degree of repulsion between particles, was -0.53 mV to -8.47 mV for all concentrations in all treatment media at 37ºC (Table 2). To be considered a disperse suspension these zeta
aggregating and separating out of the liquid phase during the genotoxicity experiments, which is common for medium suspensions of TiO2 nanoparticles (Ji et al., 2010). Zeta potential of TiO2 nanoparticles in distilled water was lower than in medium, with a range of -8.7 to -17.2 mV (indicating a more disperse suspension), which has been shown previously (Table 2) (Deng et al., 2009; Ji et al., 2010).
2.4.2 Determination of cellular interaction
TiO2 nanoparticles can enter cells, resulting in a change in the cytoplasm that can be measured by flow cytometry using side scatter (Suzuki et al, 2007; Zucker et al., 2010; Zucker and Daniel 2012). Thus, we assessed cellular interaction quantitatively and
dark-field microscopy (Shapiro 2001; Zucker 2008; Zucker et al., 2010; Zucker and Daniel 2012).
A representative dark-field microscopy image of a BEAS-2B cell after a 24-h exposure to TiO2 nanoparticles is shown in Figure 5C. At high concentrations of TiO2 nanoparticles (20-100 µg/ml), the cytoplasm appears to consist primarily of agglomerates. Microscopy has been used previously by our group and others to visualize nanoparticle interaction with cells (Shapiro 2001; Hu et al., 2008; Zucker 2008; Weinkauf et al., 2009; Johnston et al., 2010; Zucker et al., 2010; Cao et al., 2011; Sanders et al., 2012; Zucker and Daniel 2012). It should be noted that the nanoparticles (colored white) are not located in or over the nucleus.
In BEAS-2B cells treated with TiO2 nanoparticles in KF, the cell population displayed a concentration-dependent increase in side scatter (Figure 5B), with a ratio normalized to a control of 22.4 at 100 μg/ml (Appendix II, Table 4). However, BEAS-2B cells treated with KB and DM showed lower side-scatter values at all concentrations compared to the KF medium, with DM < KB (Figure 5B). The side-scatter ratios normalized to control for KB and DM were 12.2 and 10.6 at 100 μg/ml, respectively (Appendix II, Table 1). This indicates less cellular interaction of TiO2 nanoparticles dispersed in KB and DM occurs compared with TiO2 nanoparticles dispersed in KF.
2.4.3 Cytotoxicity of TiO2 nanoparticles