THE ELECTROCHEMISTY OF SURFACE MODIFIED <10 NM METAL OXIDE NANOPARTICLES
Joseph J.P. Roberts
A dissertation submitted to the faculty of the University of North Carolina at Chapel Hill in partial fulfillment of the requirements for the degree of Doctor of Philosophy in the Department of Chemistry
(Analytical Chemistry)
Chapel Hill 2014
Approved by: Royce W. Murray James W. Jorgenson Robert M. Wightman Wei You
iii ABSTRACT
Joseph J.P. Roberts: The Electrochemisty of Surface Modified <10 nm Metal Oxide Nanoparticles
(Under the direction of Royce W. Murray)
Chapter One provides a general introduction of the research on metal oxide
nanoparticles (MOx), highlighting their synthesis, surface modification, and functionalization.
Emphasis is given to the different synthetic route for producing small (<10 nm) MOx
nanoparticles with narrow size distributions. Different methods for modifying their surface with small organic molecules are discussed with focus given to silanes and phosphates. Furthermore, functionalizing surface modified nanoparticles for specific functions is addressed, with markers for analytically relevant nanoscale quantification being the primary focus.
Chapter Two describes in detail the thermal degradation synthesis used for the generation of small MOx nanoparticles. It demonstrates the versatile of the synthesis by
successfully synthesizing ZrO2 and IrO2 nanoparticles. Preliminary work involving the formation
of Bi2S3, Bi2O3, and RuO2 nanomaterials is also addressed. The solvothermal synthesis of indium
tin oxide (ITO) is also shown for comparison to ITO produced by thermal degradation.
Chapter Three details the surface modification of ITO nanoparticles and subsequent electrochemical tagging with a ferrocene moiety. ITO nanoparticles were synthesized via thermal degradation. These nanoparticles underwent a ligand exchange with a covalently binding
iv
modification. Electrochemisty of the quasi-diffusing nanoparticles was evaluated via cyclic voltammetry (CV), chronoamperometry (CA), and mircodisk electrode (µE) experiments.
Chapter Four investigates spectroscopic tagging of ITO and ZrO2 nanoparticles as well
as electrochemical tagging of ZrO2 and IrO2 nanoparticles. An unbound azo-dye was synthesized
and attempts were made to attach the dye to the surface of ITO nanoparticles. Imine couple between a spectroscopic tag and ZrO2 nanoparticles was also explored, but resulted in very low
surface coverages. ZrO2 nanoparticles were also ferrocene tagged using previously discussed
v
vi
ACKNOWLEDGEMENTS
What a ride it has been! This dissertation would not be possible without the support and contributions of many people in my life. First, I would like to thank Dr. Royce W. Murray for all of his support during my graduate experience. He’s been an excellent mentor and I am very thankful for all the opportunities he has given me to share my research, mentor undergraduates, and grow as an individual. He will likely forget more about chemistry than I will ever know. Thank you for putting up with my nonsense for 5 years. I hope to do you proud as teacher.
I would also like to extend my thanks to the members of the Murray Lab who shared my time here at UNC. The 5th years who helped acclimate me to the lab, Joe Parker, Christina
vii
with me through it all. I really appreciate our coffee walks, our cupcake dates, and our morning talks. May your stubbornness always refute my results and may your Excel never crash.
I also want to thank all of the undergraduates and interns who have given me the pleasure of working with them during this last 5 years. Kimmy Vuong, Ahnthu Vuong, John Westgard, Chris Wilhelmson, and Laura Cooper, you guys proved that teaching is really what I want to do. You’ve been the most rewarding part of my graduate experience. Good luck in everything you do.
Much of the work presented here couldn’t have been done without the wonderful support staff here at UNC. Debbie Norton, thank you for being such a great asset to the lab and helping out with all the ridiculous things we needed. Also, thank you for not throwing me out a window for all the times I messed up the PCard. Amar Kumbhar, thank you for all your sage advice about grad school, all time we spent looking at tiny organic covered nanoparticles, and for taking me to the Spice & Curry buffet where I was convinced I was going to die. Thank you Carrie Donely for great conversation in the XPS room and for running all of the questionable samples I brought you. And finally, Reggie down at Fisher for just shooting the breeze with me when I needed a little break from science.
viii
distraction, every silly conversation about knowing what it’s like to be the Batman, and for being the best pseudo-sibling I could ever have.
ix
TABLE OF CONTENTS
TABLE OF CONTENTS ... ix
LIST OF TABLES ... xiv
LIST OF FIGURES ... xv
LIST OF SCHEMES... xviii
LIST OF ABBERVIATIONS AND SYMBOLS ... xix
CHAPTER 1 - AN INTRODUCTION TO METAL OXIDE NANOPARTICLES AND METHODS TO MODIFY THEIR SURFACE ... 1
1.1 Methods of Metal Oxide Nanoparticle Synthesis ... 4
1.2 Surface Modification of Metal Oxide Nanoparticles ... 5
1.3 Functionalization of Metal Oxide Nanoparticles ... 8
CHAPTER 2 – SYNTHESIS OF METAL OXIDE NANOPARTICLES BY THERMAL DEGRADATION AND SOLVOTHERMAL ROUTES ... 16
2.1 Introduction ... 16
2.1.1 Metal Oxide Nanoparticles via Thermal Degradation Synthesis ... 17
2.1.2 Metal Oxide Nanoparticles via Solvothermal Synthesis... 19
2.2 Experimental ... 20
2.2.1 Chemicals and Materials ... 20
2.2.2 Instrumentation ... 21
x
2.2.4 Hot Injection Thermal Degradation Synthesis of Metal Oxide
Nanoparticles ... 22
2.2.5 Solvothermal Synthesis of ITO Nanoparticles... 23
2.2.6 Citrate Capped Nanoparticles. ... 23
2.2.7 Estimations of Nanoparticle Mass and Composition ... 24
2.3 Results and Discussion ... 24
2.3.1 Characterization of ZrO2 Nanoparticles Prepared by Thermal Degradation Synthesis ... 24
2.3.2 Characterization of IrO2 Nanoparticles Prepared by Thermal Degradation Synthesis ... 29
2.3.3 Characterization of Bi2S3 and Bi2O3 Nanomaterials Prepared by Thermal Degradation Synthesis ... 29
2.3.4 Characterization of RuO2 Nanoparticles Prepared by Thermal Degradation Synthesis ... 40
2.3.5 Characterization of ITO Nanoparticles Prepared by Solvothermal Synthesis ... 40
2.4 Conclusions ... 44
2.5 Acknowledgments ... 44
2.6 References ... 47
CHAPTER 3 – SYNTHESIS AND ELECTROCHEMISTRY OF 6 NM FERROCENATED INDIUM TIN OXIDE NANOPARTICLES ... 49
3.1 Introduction ... 49
3.2 Experimental ... 50
3.2.1 Chemicals and Materials ... 50
3.2.2 Instrumentation and Electrochemical Details ... 52
xi
3.2.4 Silane-Capped ITO Nanoparticles. ... 53
3.2.5 Synthesis of Ferrocenoyl Chloride and of Ferrocene-Functionalized ITO Nanoparticles. ... 54
3.3 Results and Discussion ... 54
3.3.1 ITO Synthesis. ... 54
3.3.2 Replacement of Surfactants with Silane Ligands and Ferrocenation. ... 56
3.3.3 Voltammetry of Ferrocenated ITO Nanoparticles. ... 62
3.4 Acknowledgment. ... 69
3.5 References ... 71
CHAPTER 4 – SPECTROSCOPIC AND ELECTROCHEMICAL MODIFICATION OF SMALL (<10 NM) METAL OXIDE NANOPARTICLES ... 73
4.1 Introduction ... 73
4.1.1 Surface Modification by Siloxane Chemisty ... 74
4.1.2 Surface Modification by Phosphate Chemistry ... 75
4.1.3 Analytical Methods for Quantification of Surface Modification ... 76
4.2 Experimental ... 77
4.2.1 Chemicals and Materials ... 77
4.2.2 Instrumentation and Electrochemical Details ... 78
4.2.3 Silane-Capped ITO and ZrO Nanoparticles. ... 79
4.2.4 Synthesis of N,N-Dimethylaniline Dye ... 79
4.2.5 Amine Quantification via Imine Coupling with ZrO2 Nanoparticles ... 80
xii
4.2.7 Synthesis of Ferrocene Functionalized ZrO2 and IrO2 via Click
Chemisty ... 83
4.3 Results and Discussion ... 85
4.3.1 Spectroscopic Surface Quantification by Dye-Modified ITO Nanoparticles ... 85
4.3.2 Spectroscopic Surface Quantification by Imine Coupled ZrO2 Nanoparticles ... 87
4.3.3 Surface Modification of ZrO2 with Silane Bound Ferrocene. ... 88
4.3.4 Voltammetry of Ferrocenated Silane-Capped ZrO2 Nanoparticles (FcZrO) ... 91
4.3.5 Click Ferrocenation of ZrO2 and IrO2 Nanoparticles... 101
4.4 Acknowledgments ... 110
4.5 References ... 115
CHAPTER 5 – ELECTROCHEMICAL EVALUATION OF <10 NM CITRATE CAPPED MAGNETITE NANOPARTICLES ... 118
5.1 Introduction ... 118
5.2 Experimental ... 120
5.2.1 Chemicals and Materials ... 120
5.2.2 Instrumentation and Electrochemical Details ... 121
5.2.3 Synthesis of 4 nm Magnetite Nanoparticles. ... 122
5.2.4 Citrate Capped Magnetite Nanoparticles. ... 123
5.3 Results and Discussion ... 123
5.3.1 Fe3O4 Nanoparticle Synthesis and Characterization. ... 123
xiii
5.3.3 Electrochemistry of Solutions of Citrate-Capped Magnetite
Nanoparticles. ... 131
5.3.4 Effects of Magnetic Field on Magnetite Electrochemisty. ... 146
5.4 Acknowledgments ... 146
xiv
LIST OF TABLES
Table 2.1 – Atomic values for ZrO2 ... 28
Table 2.2 – Atomic values for IrO2 ... 34
Table 2.3 – Atomic Values of Bi2O3 ... 43
Table 4.1 – Spectroscopic Quantification of silane ZrO2 ... 90
Table 5.1 – Molar absorptivities of magnetite and citrate-magnetite ... 128
Table 5.2 – Electrochemically determined diffusion coefficients of cit-Fe3O4 ... 145
xv
LIST OF FIGURES
Figure 2.1 – TEM of citrate-ZrO2 nanoparticles ... 26
Figure 2.2 – XPS of ZrO2 and citrate-ZrO2 nanoparticles ... 27
Figure 2.3 – UV/Vis of ZrO2 nanoparticles ... 30
Figure 2.4 – TEM of IrO2 nanoparticles ... 31
Figure 2.5 – XPS of IrO2 nanoparticles ... 32
Figure 2.6 – EDX of IrO2 nanoparticles ... 33
Figure 2.7 – TEM of Bi2S3 nanomaterials ... 36
Figure 2.8 – EDX of Bi2S3 nanoparticles... 37
Figure 2.9 – UV/Vis of Bi2S3 nanoparticles ... 38
Figure 2.10 – TEM of Bi2O3 nanoparticles ... 39
Figure 2.11 – XPS of Bi2O3 and citrate-Bi2O3 nanoparticles ... 41
Figure 2.12 – EDX of Bi2O3 nanoparticles ... 42
Figure 2.13 – TEM of solvothermal ITO nanoparticles ... 46
Figure 3.1 – TEM of ITO nanoparticles ... 55
Figure 3.2 – XPS of ITO nanoparticles ... 57
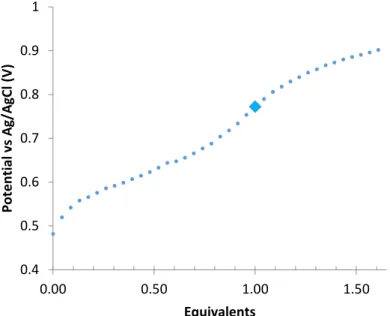
Figure 3.3 – Cu2+ titration of ferrocenated ITO nanoparticles in CH3CN ... 59
Figure 3.4 – XPS of ferrocenated ITO nanoparticles ... 60
Figure 3.5 – EDX of ferrocenated ITO nanoparticles ... 61
Figure 3.6 – Cyclic voltammetry of ferrocenated ITO nanoparticles in CH3CN ... 64
Figure 3.7 – Randles-Sevcik plot for ferrocenated ITO nanoparticles in CH3CN ... 65
Figure 3.8 – Microdisk electrode voltammetry of ferrocenated ITO nanoparticles in CH3CN ... 66
xvi
Figure 3.10 – CVs of ferrocenated ITO nanoparticles after FcCOOH additions ... 70
Figure 4.1 – UV/Vis of N,N-dimethylaniline dye ... 86
Figure 4.2 – UV/Vis of 4-NBA... 89
Figure 4.3 – TEM of silanized and ferrocenated ZrO2 nanoparticles ... 92
Figure 4.4 – XPS of silanized ZrO2 nanoparticles ... 93
Figure 4.5 – XPS of ferrocenated ZrO2 nanoparticles ... 94
Figure 4.6 – EDX of ferrocenated ZrO2 nanoparticles ... 95
Figure 4.7 – Cyclic voltammetry of ferrocenated ZrO2 nanoparticles in DCM ... 98
Figure 4.8 – Randles-Sevcik plot of ferrocenated ZrO2 nanoparticles in DCM ... 99
Figure 4.9 – iPEAK scan rate dependence of ferrocenated ZrO2 nanoparticles in DCM ... 100
Figure 4.10 – Microdisk electrode voltammetry of ZrO2 nanoparticles in DCM ... 103
Figure 4.11 – Cottrell plot of ferrocenated ZrO2 nanoparticles in DCM ... 104
Figure 4.12 – TEM of click-ZrO2 nanoparticles ... 106
Figure 4. 13 – XPS of click-ZrO2 nanoparticles ... 107
Figure 4.14 – XPS of azo-IrO2 nanoparticles ... 108
Figure 4.15 – XPS of click-IrO2 nanoparticles ... 109
Figure 4.16 – Cyclic voltammetry of click-ZrO2 nanoparticles in CH3CN ... 111
Figure 4.17 – Cyclic voltammetry of click-IrO2 nanoparticles in DMSO ... 112
Figure 4.18 – Randles-Sevcik of click-ZrO2 nanoparticles in CH3CN ... 113
Figure 4.19 – Cottrell plot of click-ZrO2 nanoparticles in CH3CN ... 114
Figure 5.1 – TEM of magnetite nanoparticles ... 125
Figure 5.2 – XRD of magnetite nanoparticles ... 126
xvii
Figure 5.4 – Emission spectra of magnetite nanoparticles ... 129
Figure 5.5 – XPS of magnetite nanoparticles ... 130
Figure 5.6 – TEM of cit-Fe3O4 nanoparticles ... 132
Figure 5.7 – XPS of cit-Fe3O4 nanoparticles ... 133
Figure 5.8 – Cyclic Voltammetry of cit-Fe3O4 in citrate buffer ... 134
Figure 5.9 – Comparison between Pt background and cit-Fe3O4 in citrate buffer ... 135
Figure 5.10 – Comparison between Au background and cit-Fe3O4 in citrate buffer ... 136
Figure 5.11 – pH depedence of cit-Fe3O4 electrochemistry in citrate buffer... 138
Figure 5.12 – Cyclic voltammetry of Fe(III) citrate in citrate buffer ... 139
Figure 5.13 – Randles-Sevcik plot of cit-Fe3O4 in citrate buffer ... 140
Figure 5.14 – RDE of cit-Fe3O4 in citrate buffer ... 142
Figure 5.15 – Levich plot of cit-Fe3O4 in citrate buffer ... 143
Figure 5.16 – Cottrell plot of cit-Fe3O4 in citrate buffer ... 144
Figure 5.17 – Tafel plot of cit-Fe3O4 in citrate buffer ... 147
Figure 5.18 – Magnetic electrochemisty experimental setup ... 149
xviii
LIST OF SCHEMES
Scheme 1.1 – Cartoon of presented nanoparticle modifications ... 2
Scheme 3.1 – Cartoon of presented ITO nanoparticles ferrocenation ... 51
Scheme 4.1 – Synthetic route for azo-dye modified ITO ... 81
xix
LIST OF ABBERVIATIONS AND SYMBOLS
4NBA 4-nitrobenzaldehyde
A ampere
ac acetate
acac acetylacetonate
Ag silver
Ag/AgCl silver-silver chloride
Ar argon
Au gold
aux auxiliary electrode
BE bulk electrolysis
Bi Bismuth
Bi2O3 bismuth oxide
Bi2S3 bismuth sulfide
Bu4NClO4 tetrabutylammonium perchlorate
C coulombs
°C degree Celsius
CA chronoamperometry
ca circa
CF chloroform
cm centimeter
xx
D diffusion constant
DCM dichloromethane
dia diameter
DMSO dimethyl sulfoxide
E potential
EDX energy dispersive x-ray spectroscopy
ε molar absorptivity
EPEAK peak potential
ΔEPEAK peak potential separation
EtOH ethanol
F Faraday’s constant
Fc ferrocene
g gram
h hour
i current
iLIM limiting current
In indium
Ir iridium
IrO2 iridium oxide
ITO indium tin oxide
m minute
M molar
xxi
MeCN acetonitrile
MeOH methanol
mg milligram
mL milliliter
µL microliter
mm millimeter
µm micrometer
mM millimolar
mol moles
mV millivolt
MOx metal oxide
n number of electrons
N number of moles
NaOH sodium hydroxide
nm nanometer
NP nanoparticle
Pt platinum
RDE rotating disk electrode
ref reference electrode
RuO2 ruthenium oxide
s second
S sulfur
xxii
T temperature
TCOs transparent conducting oxides
TD thermal degradation synthesis
TEM transmission electron microscope
UV-Vis ultraviolet-visible
V volt
vs versus
WE working electrode
XPS x-ray photoelectric spectroscopy
XRD x-ray diffraction
Zr zirconium
ZrO2 zirconium oxide
+ positive
CHAPTER 1 - AN INTRODUCTION TO METAL OXIDE NANOPARTICLES AND METHODS TO MODIFY THEIR SURFACE
The field of nanotechnology has experienced an explosion of growth in recent years. This is largely due to the number of interesting properties that nanomaterials have over their bulk counterparts. As you shrink a material down to the nanoscale, you typically see changes based on quantum confinement. CdSe nanoparticles, often referred to as quantum dots, can emit different wavelengths of light based on the diameter of the nanoparticle1. Changing the diameter between 2 to 10 nm covers the entire visible range. Nanomaterials also exhibit increased reactivity as they provide large surface-to-volume ratios. The number of potential applications is large, especially since careful synthetic control opens an avenue to “tune” a nanomaterial for a wide range of applications. Polymeric nanomaterials, for instance, might be able to prevent biofouling of implantable sensors by gradually releasing NO during the lifetime of the device2. Gold nanoparticles, a favored topic in the nanocommunity, can be synthesized in specific “magic” structures, such as Au25. Not only do these small nanoparticles (~1.2 nm) show quantized energy
levels during electrochemical analysis, but they also allow a gold’s surface plasmon to be “tuned” based on nanoparticle size3. Many metal nanoparticles show increased catalytic
2
3
characterize them all. Instead, this work focuses on nanomaterials made from metal oxides and aims to control their formation during synthesis and change their properties by modifying their surfaces.
Metal oxide (MOx) nanoparticles are large portion of nanomaterial research. With an already staggering number of interesting MOx bulk materials, investigating their nanoscale
counterparts is a large undertaking. So many materials necessitates a need to evaluate and categorize them. This work chooses to organize them based on their most valued properties, and will focus on catalytic, magnetic, and transparent conducting MOx nanoparticles. As discussed
above, catalysis is a very important field in nanomaterial research. Several MOx NPs have shown
catalytic properties for a variety of organic reactions10. Other materials, like iridium oxide, show
promise in energy applications by reducing the overpotential of water oxidation to allow its splitting by solar energy11. Magnetic nanoparticles, like iron oxide and its derivatives, are primarily examined for their biological applications6. These nanoparticles show relatively low cell toxicity12-13 and can be manipulated in vivo by a powerful magnetic field providing routes for targeted drug delivery systems in cancer treatment14, more robust MRI contrast reagents15-16,
and immunotherapy treatments by localizing hyperthermia15. Another category includes transparent conductive oxides (TCOs), like indium tin oxide and TiO2. These materials have
4
1.1 Methods of Metal Oxide Nanoparticle Synthesis
There are many synthetic routes for metal oxide nanomaterials, generally stemming from the desire to specifically tune their properties. A frequently used synthesis is a co-precipitation method which involves metal salts (often chloride salts) in the presence of strong acid or base19. The size, type, and properties of the nanomaterial generated are based on the acid/base used, pH, and the concentration of the metal salts20-21. Generally, the reaction yields water soluble
materials but can suffer from poor monodispersity and crystallinity. Co-precipitation methods have been used since ancient times, though it was unknown then that the process created
nanomaterials. Many routes have come into existence in recent years, more than one work could possibly discuss in detail. This work will focus on co-precipitation, thermal degradation,
solvothermal, and electrochemical methods, but microwave-assisted22, laser-induced fragmentation, and ionic liquid23 methods are known in the literature.
Several routes for nonaqueous nanomaterial synthesis exist. Of them, thermal degradation and solvothermal methods have been specifically been utilized by this lab. The thermal
5
they are placed in a stabilizing organic solvent such as benzyl ether27-29. The whole reaction is then placed into a Teflon lined digestion bomb and heated to high temperatures (~ 200 °C) over the course of 1 or more days. The resulting nanomaterial is pseudo-capped with the stabilizing solvent which can easily be removed by additional washing. This method will also be discussed in more detail in Chapter 2.
Recently an electrochemical route was developed for synthesizing iron oxide
nanoparticles30-32. The method involves a sacrificial iron anode, an iron cathode, and a reference
electrode hooked to a standard potentiostat. The electrodes are placed into an electrolyte solution and separated by a specific distance. A voltage is applied, generating nanoparticles at the anode. Adjusting both the current density and the voltage yields control over the size and shape iron oxide nanoparticles formed. A surfactant is sometimes used to prevent flocculation, but methods exist where no surfactant is used.
1.2 Surface Modification of Metal Oxide Nanoparticles
As mentioned above, there is vast potential for MOx nanoparticles in a wide range of
6
synthesized by high temperature degradation are covered in surfactant, which leads to a competitive interaction during surface modification, making the process more challenging. However, many different molecules readily interact with a MOx surface providing a wide range
of molecules and surface chemistries to work with. The most common molecules involved are carboxylic acids, amines, phosphates and phosphonates, and silanes33. Each of these provides a unique type of binding to the MOx surface, with carboxylic acids and amines chemisorbing while
phosphates, phosphonates, and silanes are capable of multiple covalent bonds to the metal ion present at the surface.
Carboxylic acids and amines are commonly used to modify the solubility properties of a MOx nanoparticle by changing its surface charge30, 34-35. For instance, citric acid is often used to
replace the surfactant on nonaqueous iron oxide nanoparticles to make them soluble in water36. Many of the surfactants used in thermal degradation synthesis are also carboxylic acids or amines attached to very long carbon chains37-38. As such, it is the functional group that interacts with the MOx surface via adsorption or chemisorption between the electronegative
oxygens/nitrogen and the positively charged metal ions. Since the primary form of bonding is not covalent, the ligands are capable of detaching from the MOx surface and forming an equilibrium
with the solution around them, this is especially true in the case of adsorbed molecules. This means that carboxylate and amine capped nanoparticles can eventually lose their coating and begin to aggregate or flocculate in their environment. Coating a MOx nanoparticle with a
carboxylate or amine is usually very simple. The desired ligand is added to a solution of nanoparticles and stirred until the appropriate polarity change occurs which causes the
7
containing valeric acid just by continued stirring overnight39. The purple color of the IrO2
nanoparticles can be visually observed as it transfers over to the DCM layer.
In order to achieve long term surface control, a more powerful bonding option must be used, preferably something capable of covalent interaction. Silanes, which are well known for their bonding with bulk MOx surfaces, make an attractive option for long term surface
modification. Silanes are known to readily react with surface -OH groups to form covalent M-O-Si bonds40-43. They are capable of being mono, di, and tridentate ligands based on their design
and can be synthesized with a wide variety of R groups. They are also inexpensive and commercially available. However, silanes do possess some limitations, namely
homo-condensation and poor stability outside the pH range of 4-10. Homo-homo-condensation, which occurs when Si-O-Si bonds are formed between different silane molecules, often causes the silane to “chain”, creating large polymer networks which encapsulate nanoparticles. This polymerization makes it very difficult to try and quantify any surface modification that occurs and can be limited, but not completely prevented, by carefully controlling the reaction environment or by limiting the reagents to less reactive or monodentate silanes. Silanes are also susceptible to hydrolytic cleavage in strongly acidic or basic environments. Essentially, bonds are broken as H+ (in the case of acid environments) or OH- (in basic environments) react with Si to recreate Si-H
or Si-OH bonds. Bulky side groups can help limit the effects of hydrolytic cleavage, but extended operation outside of pH 4-10 will eventually lead to removal of the silane layer. A series of silanes were used to modify ITO and ZrO2 nanoparticles and will be discussed in more
detail in Chapters 3 and 4.
Phosphates and phosphonates provide an additional option for long term surface
8
bind with most non-silicon MOx surfaces and, like silanes, can be mono, di, or tridentate in their
binding and can be customized during synthesis to satisfy any R group needs. Unlike silanes, the M-O-P bonds formed at the MOx surface are much less susceptible to hydrolysis and are
incapable of homo-condensation to polymerize. This makes them ideal for quantifying
nanoparticle surface modification. Phosphate ligands have been used to anchor azide groups to nanoparticle surfaces to allow for further modification via click chemistry45. Chapter 4 will further explore nanoparticles with phosphate surfaces.
1.3 Functionalization of Metal Oxide Nanoparticles
The major focus behind modifying the surface of a nanoparticle is to provide groundwork for its functionalization to give it the properties needed to work with the application in mind. For instance, nanoparticles for biological applications must be soluble in water and stable at
physiological pH40, 46. This is not the case for many as-synthesized nanoparticles, so they must be modified with a ligand that provides those qualities with a strong surface attachment. There are numerous ways routes to functionalize nanoparticles, however it is easiest to divide them into two separate orders of operation, single step and multistep functionalization. In a single step functionalization, the molecule that is attached to the surface already has the desired
functionality. All synthetic steps for the ligand are completed before it is used. All that remains is to attach the ligand to the surface and remove any excess. This is the preferred method of
9
with the active site. They are certainly not limited to two-steps, but each additional step adds more work-up and decreases yield. This work discusses both single step and multistep functionalization in Chapters 3, 4, and 5.
Several common organic reactions can be used to modify an attached ligand in a multistep functionalization of a nanoparticle. Often, the limiting factor is the terminal groups available to be reacted. Primary amines make a very attractive choice, assuming your original ligand is capable of supporting one42. Amines are polar enough to widen solvent choices and are
the target of many powerful coupling techniques, specifically acyl chloride and carbodiimide47 couplings. Previous work from the Murray Lab showed how carbodiimide coupling could be used to modify the terminal amine groups of a 3-aminopropyltrimethoxysilane ligand shell on SiO2 nanoparticles with an electroactive ferrocene tag48. They were then able to electrochemicaly
determine the number of ferrocenes and predict the surface coverage of the SiO2 nanoparticles,
10
Recently, another way of modifying surfaces has afforded a degree of fame, the so called “click” reactions15, 45, 49. Click reactions are simple ways of combining two types of small
molecules and are typically required to be modular, high yielding, and stereoselective while producing very inoffensive by-products. Perhaps the most notable of the Click reactions is the azide-alkyne Huisgen cycloaddition where an azide group cyclizes after coming into contact with a terminal alkyne group. This reaction is typically very slow, but can be catalyzed by the
presence of Cu(I) in solution, often made in solution by reducing CuSO4 with sodium ascorbate.
There are many examples in the literature showing how metal oxide surfaces can be modified by using phospho-azide materials to bind with the surface then reacting them with an alkyne
terminated function group. In 2010 the Xian group of East China Normal University showed a way to modify iron oxide nanoparticles with ferrocene to create a magnetic electrochemical switch50. Using a previously reported synthesis for a phosphor-azide ligand45 they were able to
remove the original surfactant layer and replace it with this new phosphate ligand. They were then able to perform a click reaction using ethynylferrocene to graft an electroactive tag to the phosphate support and detect its presence with electrochemistry. Since phosphates do not polymerize this provides an attractive route to generate a monolayer of ferrocene on the surface of MOx nanoparticles. Chapter 4 will discuss using this route to modify the surface of IrO2 and
11
1.4 References
1. Nozik, A. J.; Beard, M. C.; Luther, J. M.; Law, M.; Ellingson, R. J.; Johnson, J. C., Semiconductor Quantum Dots and Quantum Dot Arrays and Applications of Multiple Exciton Generation to Third-Generation Photovoltaic Solar Cells. Chem. Rev. 2010,110 (11), 6873-6890.
2. Carpenter, A. W.; Johnson, J. A.; Schoenfisch, M. H., Nitric Oxide-Releasing Silica Nanoparticles with Varied Surface Hydrophobicity. Colloids and Surfaces A: Physicochemical and Engineering Aspects (0).
3. Parker, J. F.; Fields-Zinna, C. A.; Murray, R. W., The Story of a Monodisperse Gold Nanoparticle: Au25L18. Acc. Chem. Res. 2010,43 (9), 1289-1296.
4. Johnson, B. F. G., Nanoparticles in Catalysis. Top. Catal. 2003,24 (1-4), 147.
5. Jung, J. H., Functionalized magnetic nanoparticles as chemosensors and adsorbents for toxic metal ions in environmental and biological fields. Chem. Soc. Rev. 2011,40 (9), 4464.
6. Schladt, T. D.; Schneider, K.; Schild, H.; Tremel, W., Synthesis and bio-functionalization of magnetic nanoparticles for medical diagnosis and treatment. Dalton Transactions 2011,40 (24), 6315-6343.
7. Yiu, H. H. P., Engineering the multifunctional surface on magnetic nanoparticles for targeted biomedical applications: a chemical approach. Nanomedicine 2011,6 (8), 1429-1446.
8. Kamat, P. V., Graphene-Based Nanoarchitectures. Anchoring Semiconductor and Metal Nanoparticles on a Two-Dimensional Carbon Support. The Journal of Physical Chemistry Letters 2009,1 (2), 520-527.
9. Dahl, J. A.; Maddux, B. L. S.; Hutchison, J. E., Toward Greener Nanosynthesis. Chem. Rev. 2007,107 (6), 2228-2269.
10. Cuenya, B. R., Synthesis and catalytic properties of metal nanoparticles: Size, shape, support, composition, and oxidation state effects. Thin Solid Films 2010,518 (12), 3127-3150.
12
12. Joris, F.; Manshian, B. B.; Peynshaert, K.; De Smedt, S. C.; Braeckmans, K.; Soenen, S. J., Assessing nanoparticle toxicity in cell-based assays: influence of cell culture parameters and optimized models for bridging the in vitro-in vivo gap. Chem. Soc. Rev. 2013,42 (21), 8339-8359.
13. Mingwu, S.; Hongdong, C.; Xifu, W.; Xueyan, C.; Kangan, L.; Su He, W.; Rui, G.; Linfeng, Z.; Guixiang, Z.; Xiangyang, S., Facile one-pot preparation, surface functionalization, and toxicity assay of APTS-coated iron oxide nanoparticles. Nanotechnology 2012,23 (10), 105601.
14. Xie, J.; Chen, K.; Lee, H.-Y.; Xu, C.; Hsu, A. R.; Peng, S.; Chen, X.; Sun, S., Ultrasmall c(RGDyK)-Coated Fe3O4 Nanoparticles and Their Specific Targeting to Integrin αvβ3-Rich Tumor Cells. J. Am. Chem. Soc. 2008,130 (24), 7542-7543.
15. Hayashi, K.; Ono, K.; Suzuki, H.; Sawada, M.; Moriya, M.; Sakamoto, W.; Yogo, T., One-Pot Biofunctionalization of Magnetic Nanoparticles via Thiol−Ene Click Reaction for Magnetic Hyperthermia and Magnetic Resonance Imaging. Chem. Mater. 2010,22 (12), 3768-3772.
16. Zhang, C.; Wängler, B.; Morgenstern, B.; Zentgraf, H.; Eisenhut, M.; Untenecker, H.; Krüger, R.; Huss, R.; Seliger, C.; Semmler, W.; Kiessling, F., Silica- and Alkoxysilane-Coated Ultrasmall Superparamagnetic Iron Oxide Particles: A Promising Tool To Label Cells for Magnetic Resonance Imaging. Langmuir 2006,23 (3), 1427-1434.
17. Jeon, M.-K.; Kang, M., Synthesis and characterization of indium-tin-oxide particles prepared using sol–gel and solvothermal methods and their conductivities after fixation on polyethyleneterephthalate films. Mater. Lett. 2008,62 (4–5), 676-682.
18. Hoertz, P. G.; Chen, Z.; Kent, C. A.; Meyer, T. J., Application of High Surface Area Tin-Doped Indium Oxide Nanoparticle Films as Transparent Conducting Electrodes. Inorg. Chem.
2010,49 (18), 8179-8181.
19. Wöhler, L.; Witzmann, W., Die Oxyde des Iridiums. Zeitschrift für anorganische Chemie
1908,57 (1), 323-352.
20. Han, C.-H.; Han, S.-D.; Gwak, J.; Khatkar, S. P., Synthesis of indium tin oxide (ITO) and fluorine-doped tin oxide (FTO) nano-powder by sol–gel combustion hybrid method. Mater. Lett.
13
21. Liu, S.-m.; Ding, W.-y.; Chai, W.-p., Preparation and characterization of highly dispersed and crystallised ITO nanoparticles. Mater. Lett. 2011,65 (9), 1272-1275.
22. Kijima, N.; Yoshinaga, M.; Awaka, J.; Akimoto, J., Microwave synthesis,
characterization, and electrochemical properties of α-Fe2O3 nanoparticles. Solid State Ionics
2011,192 (1), 293-297.
23. Bühler, G.; Thölmann, D.; Feldmann, C., One-Pot Synthesis of Highly Conductive Indium Tin Oxide Nanocrystals. Adv. Mater. 2007,19 (17), 2224-2227.
24. Sun, S.; Zeng, H.; Robinson, D. B.; Raoux, S.; Rice, P. M.; Wang, S. X.; Li, G.,
Monodisperse MFe2O4 (M = Fe, Co, Mn) Nanoparticles. J. Am. Chem. Soc. 2003,126 (1), 273-279.
25. Sun, Z.; He, J.; Kumbhar, A.; Fang, J., Nonaqueous Synthesis and Photoluminescence of ITO Nanoparticles. Langmuir 2010,26 (6), 4246-4250.
26. Zhang, Z.; Lu, M.; Xu, H.; Chin, W.-S., Shape-Controlled Synthesis of Zinc Oxide: A Simple Method for the Preparation of Metal Oxide Nanocrystals in Non-aqueous Medium. Chemistry – A European Journal 2007,13 (2), 632-638.
27. Ba, J.; Feldhoff, A.; Fattakhova Rohlfing, D.; Wark, M.; Antonietti, M.; Niederberger, M., Crystallization of Indium Tin Oxide Nanoparticles: From Cooperative Behavior to
Individuality. Small 2007,3 (2), 310-317.
28. Ba, J.; Fattakhova Rohlfing, D.; Feldhoff, A.; Brezesinski, T.; Djerdj, I.; Wark, M.; Niederberger, M., Nonaqueous Synthesis of Uniform Indium Tin Oxide Nanocrystals and Their Electrical Conductivity in Dependence of the Tin Oxide Concentration. Chem. Mater. 2006,18 (12), 2848-2854.
29. Sasaki, T.; Endo, Y.; Nakaya, M.; Kanie, K.; Nagatomi, A.; Tanoue, K.; Nakamura, R.; Muramatsu, A., One-step solvothermal synthesis of cubic-shaped ITO nanoparticles precisely controlled in size and shape and their electrical resistivity. J. Mater. Chem. 2010,20 (37), 8153-8157.
14
31. Pascal, C.; Pascal, J. L.; Favier, F.; Elidrissi Moubtassim, M. L.; Payen, C., Electrochemical Synthesis for the Control of γ-Fe2O3 Nanoparticle Size. Morphology, Microstructure, and Magnetic Behavior. Chem. Mater. 1998,11 (1), 141-147.
32. Fajaroh, F.; Setyawan, H.; Widiyastuti, W.; Winardi, S., Synthesis of magnetite nanoparticles by surfactant-free electrochemical method in an aqueous system. Adv. Powder Technol. 2012,23 (3), 328-333.
33. Neouze, M.-A.; Schubert, U., Surface Modification and Functionalization of Metal and Metal Oxide Nanoparticles by Organic Ligands. Monatshefte für Chemie / Chemical Monthly
2008,139 (3), 183-195.
34. Lattuada, M.; Hatton, T. A., Functionalization of Monodisperse Magnetic Nanoparticles. Langmuir 2006,23 (4), 2158-2168.
35. Harris, L. A.; Goff, J. D.; Carmichael, A. Y.; Riffle, J. S.; Harburn, J. J.; St. Pierre, T. G.; Saunders, M., Magnetite Nanoparticle Dispersions Stabilized with Triblock Copolymers. Chem. Mater. 2003,15 (6), 1367-1377.
36. Campelj, S.; Makovec, D.; Drofenik, M., Preparation and properties of water-based magnetic fluids. J. Phys.: Condens. Matter 2008,20 (20), 204101.
37. Gilstrap, R. A.; Capozzi, C. J.; Carson, C. G.; Gerhardt, R. A.; Summers, C. J., Synthesis of a Nonagglomerated Indium Tin Oxide Nanoparticle Dispersion. Adv. Mater. 2008,20 (21), 4163-4166.
38. Choi, S.-I.; Nam, K. M.; Park, B. K.; Seo, W. S.; Park, J. T., Preparation and Optical Properties of Colloidal, Monodisperse, and Highly Crystalline ITO Nanoparticles. Chem. Mater.
2008,20 (8), 2609-2611.
39. Gambardella, A. A. On the Characterization of Small Iridium Oxide Nanoparticles. University of North Carolina at Chapel Hill, 2013.
40. Bruce, I. J.; Sen, T., Surface Modification of Magnetic Nanoparticles with Alkoxysilanes and Their Application in Magnetic Bioseparations. Langmuir 2005,21 (15), 7029-7035.
15
42. del Campo, A.; Sen, T.; Lellouche, J.-P.; Bruce, I. J., Multifunctional magnetite and silica–magnetite nanoparticles: Synthesis, surface activation and applications in life sciences. J. Magn. Magn. Mater. 2005,293 (1), 33-40.
43. Yamaura, M.; Camilo, R. L.; Sampaio, L. C.; Macêdo, M. A.; Nakamura, M.; Toma, H. E., Preparation and characterization of (3-aminopropyl)triethoxysilane-coated magnetite
nanoparticles. J. Magn. Magn. Mater. 2004,279 (2–3), 210-217.
44. Polito, L.; Monti, D.; Caneva, E.; Delnevo, E.; Russo, G.; Prosperi, D., One-step
bioengineering of magnetic nanoparticles via a surface diazo transfer/azide-alkyne click reaction sequence. Chemical communications (Cambridge, England) 2008, (5), 621-623.
45. White, M. A.; Johnson, J. A.; Koberstein, J. T.; Turro, N. J., Toward the Syntheses of Universal Ligands for Metal Oxide Surfaces: Controlling Surface Functionality through Click Chemistry. J. Am. Chem. Soc. 2006,128 (35), 11356-11357.
46. Barrera, C.; Herrera, A. P.; Rinaldi, C., Colloidal dispersions of monodisperse magnetite nanoparticles modified with poly(ethylene glycol). J. Colloid Interface Sci. 2009,329 (1), 107-113.
47. Mikhaylova, M.; Kim, D. K.; Berry, C. C.; Zagorodni, A.; Toprak, M.; Curtis, A. S. G.; Muhammed, M., BSA Immobilization on Amine-Functionalized Superparamagnetic Iron Oxide Nanoparticles. Chem. Mater. 2004,16 (12), 2344-2354.
48. Beasley, C. A.; Murray, R. W., Voltammetry and Redox Charge Storage Capacity of Ferrocene-Functionalized Silica Nanoparticles. Langmuir 2009,25 (17), 10370-10375.
49. Hayashi, K.; Moriya, M.; Sakamoto, W.; Yogo, T., Chemoselective Synthesis of Folic Acid−Functionalized Magnetite Nanoparticles via Click Chemistry for Magnetic Hyperthermia. Chem. Mater. 2009,21 (7), 1318-1325.
16
CHAPTER 2 – SYNTHESIS OF METAL OXIDE NANOPARTICLES BY THERMAL DEGRADATION AND SOLVOTHERMAL ROUTES
2.1 Introduction
Synthesis of MOx nanoparticles can be done in a multitude of different ways, but no
method provides a universal way to create nanoparticles for all desired specifications1. Instead, each synthesis provides control over a small set of parameters, allowing for synthetic selection based on which properties are most important for the work at hand. For instance, our lab is interested in nanoparticles less than 10 nm in diameter. Once nanoparticles enter this size regime they begin to act less like clusters and more like individual molecules. Au25L18 is a remarkable
example of this. Due to its small size (1.1 nm in diameter) electrochemical detection can reveal the energy levels of the HOMO and LUMO gap2, something that would be nearly impossible to see in a large nanomaterial or a nanomaterial with a large size distribution. Therefore, in order study molecule like nanoparticles, a synthesis capable of generating small nanoparticles with great monodispersity is required.
17
are easy to perform and can produce very small “naked” nanoparticles but lack monodispersity and crystallinity. Thermal degradation makes reproducibly small nanoparticles with high monodispersity and crystallinity, but require difficult post-synthesis work to remove their protective surfactant shell. Solvothermal methods are also very easy to perform and produce small nanoparticles with an easy to remove protective layer, but have long reactions times (24-72 hrs). The majority of the work presented here uses a high temperature degradation synthesis; one experiment via a solvothermal synthesis will be briefly mentioned as well.
2.1.1 Metal Oxide Nanoparticles via Thermal Degradation Synthesis
Thermal degradation syntheses use very high temperatures (~ 250° C – 350° C) to cause the breakdown of an organometallic salt, often in the presence of a fatty surfactant to limit crystalline growth. Metal acetates and acetylacetonates are most frequently used as the metal precursor since the acetates and acetylacetonates are capable of condensation at high
temperatures. Other metallic salts have been shown work as well, but acetates and
acetylacetonates are favored. The literature also shows a wide range of surfactants in use; they often have a carboxylic acid or amine functional groups to interact with the metal oxide surface 3-6. These moieties passify the growth of specific crystalline planes, controlling nanoparticle
18
the ability to limit the energy put into the reaction. Reactions are often vacuum or argon purged at a lower temperature to remove excess oxygen and allow the reagents to sufficiently dissolve in the HBPS. At the end of the reaction the surfactant-capped nanoparticles form a colloidal
suspension with the HBPS and can be precipitated by adding a polar solvent like ethanol.
Thermal degradation has proven to be very versatile in regards to the number of materials it can be used for. The literature has shown successful synthesis of Fe2O3, Fe3O4, ITO, ZrO2,
CdSe, ZnO2, and Bi2S3. As long as a stable acetate or acetylacetonate exists for a chosen metal,
thermal degradation should be able to produce nanoparticles. Nearly all of these syntheses
produce nanoparticles with diameters less than 10 nm, with some nanoparticles measuring only 2 nm in diameter. The size of the nanoparticles can also be tuned by manipulating the parameters of the reaction. For instance, changing the solvent from diphenyl ether (Tbp = 258° C) to benzyl
ether (Tbp = 298° C) changes Fe3O4 nanoparticle products from 3 nm in diameter to 6 nm4.
Changing the surfactants or surfactant concentration, essentially the ability to limit crystalline growth, can also cause a significant change in size and shape7. Replacing oleylamine and oleic acid with myristic acid and octadecylamine shows ITO nanoparticle diameter changing from 5.6 nm5 to 6.5 nm8. With so many parameters to manipulate, a wide range of nanomaterials of varying sizes can be created with relative ease. The only major drawback of the thermal
degradation synthesis is also its defining feature - the surfactant shell. The shell protects the MOx
cores from interacting with each other, preventing flocculation and agglomeration. It also makes the nanoparticles insulated and non-polar which prevents them from being used in many
19
monodispersity and crystallinity make it a very attractive synthesis for analytically examining small nanoparticles.
2.1.2 Metal Oxide Nanoparticles via Solvothermal Synthesis
Solvothermal methods heavily rely on the slower reaction kinetics that occur in organic solvents9. The slower reactions allow for a higher degree of synthetic control during the
nanoparticle growth stage. Solvothermal nanoparticles are also “gently” capped, meaning their protective layer can easily be removed by repeated washing yielding a naked” nanoparticle10.
Solvothermal reactions utilize the same organometallic salts as high temperature thermal
degradations, but require a special reaction vessel commonly referred to as an autoclave. Though they share the same name, this is not the same device commonly used by biological scientists to sterilize equipment and waste. The autoclave used in these experiments is actually an acid digestion bomb, commonly associated with Parr Instruments. The metal precursors are
suspended in benzyl alcohol, which acts as a weak capping ligand, (other HBPS may be used) and placed into the acid digestion bomb. The bomb is then placed into a furnace and heated just below the boiling point of the solvent for 1-3 days. The solution is then centrifuged and excess chloroform added to remove excess benzyl alcohol. The result is a “naked” nanoparticle film with moderate yield (~50%).
Solvothermal syntheses are less versatile, compared to TD syntheses, due to fewer tunable parameters. The synthesis is primarily controlled by timing the experiment, changing the solvent, or manipulating starting concentrations. Even though there are fewer parameters,
synthetic control can still be achieved. ITO nanoparticles were found to vary from 6.2 nm to 12.7 nm based on a 12 hr to 48 hr reaction time11. The lack of numerous parameters does offer some
20
ideal labs with minimal synthetic capability. Simply place the reagents in the bomb, heat, and wait. These reactions are also highly reproducible since the reaction is dependent on 1) an oven with accurate temperature control and 2) a good timer. Accurate temperature control is important since if the solvent boils too vigorously, the pressure can warp the acid digestion bomb’s Teflon container, ruining the seal and requiring a costly replacement. Solvothermal syntheses are excellent for creating and characterizing nanoparticle films. The nanoparticle powder can easily be suspended and applied to glass or conductive slides. The “naked” nanoparticle surfaces also lends itself towards surface modification experiments, however they are nearly impossible to disperse in solution without prior modification. Their unpacified surface can also lead to flocculation which can make analytical surface measurements difficult. Ultimately, the time required to make solvothermal nanoparticles was judged too time consuming, and the TD method was chosen as the primary synthetic method.
2.2 Experimental
2.2.1 Chemicals and Materials
Indium(III) acetate (In(ac)3; 99.99%), tin(II) (acetate) (Sn(ac)2; 99.99%) were obtained
from Alfa Aeser, indium(III) acetylacetonate (In(acac)3; 99.99%), tin(IV) bis(acetylacetonate)
dichloride (Sn(acac)2Cl2; 98%), ruthenium(III) acetylacetonate (Ru(acac)3; 97%), iridium(III)
acetylacetonate (Ir(acac)3; 97%), zirconium(IV) acetate hydroxide (Zr(ac)xOHy), zirconium(IV)
acetylacetonate (Zr(acac)4; 98%), bismouth(III) acetate (Bi(acac)3; 99.99%), oleylamine
(C9H18=C9H17NH2; 80-90%), oleic acid (C9H18=C8H15COOH; 97%), myristic acid
(CH3(CH2)12COOH; 99%), octadecylamine (CH3(CH2)17NH2; 90%), sulfur (S; 99.5), octadecene
21
(CH3CN), absolute ethanol, hexanes, dichloromethane (DCM), petroleum ether, toluene, and
chloroform obtained from Fisher Scientific were dried over 4 Angstrom molecular sieves.
2.2.2 Instrumentation
Programmable Temperature Control Unit. A lab constructed device controlled by a CAL 9500P programmable process controller with attached to a thermal couple was used to accurately control synthesis temperatures.
High Resolution Transmission Electron Microscopy (TEM). TEM images were obtained on a JEOL 2010F FasTEM on nanoparticle samples prepared on copper grids (200 carbon mesh, carbon-coated Formvar; Ted Pella, Redding, CA)
Energy-Dispersive X-Ray Spectroscopy (EDS). EDS analysis was performed using Oxford INCA EnergyTEM 250 TEM microanalysis system attached to the JEOL 2010F FasTEM.
Centrifuge. Centrifugation was done with an Eppendorf 5810 centrifuge with a fixed-angle rotator at 3000-4000 rpm for 10 minutes.
X-Ray Photoelectric Spectroscopy (XPS). XPS data were taken on a Kratos Axis Ultra DLD system with monochromatic Al Kα x-ray source. High resolution scans were taken at pass energy = 20 eV, and the spectral energy axis was aligned at the C 1s peak at 284.6 eV.
Ultraviolet-Visible Spectroscopy (UV-Vis). UV-Vis spectra were taken on a Thermo Evolution Array UV-Vis spectrophotometer (Thermo, Waltham, MA)
2.2.3 Standard Thermal Degradation Synthesis of Metal Oxide Nanoparticles
22
wt/wt desired), oleic acid/myristic acid (1.9 mmol), oleylamine/octadecylamine (2.4 mmol), and optionally sulfur (3 mmol) were added to octadecene (5 mL) in a 50 mL 3-neck round bottom flask equipped with a magnetic stir bar, thermocouple and condenser, closing the third port with a septum. Using a 100 mL heating mantle packed with sand to promote even heating, the vessel was evacuated and heated 1 hr at 120˚ C with vigorous stirring. The temperature was then rapidly increased to 320˚ C and the mixture refluxed for an hour, then allowed to cool to room temperature. The cloudy suspension was transferred to a 50 mL centrifugation tube and 40 mL of absolute ethanol was added, precipitating the nanoparticles, followed by centrifugation at 3000 RPM for 10 minutes. This process was repeated three times. The nanoparticles were then taken up into 3 mL of either hexanes or chloroform and stored at room temperature. Solution colors varied dramatically based on the metal used.
2.2.4 Hot Injection Thermal Degradation Synthesis of Metal Oxide Nanoparticles
The procedure was modified from Sun et al.5 A metal acetate (ac) or acetylacetonates (acac) (0.20 mmol), a dopant metal ac or acac ( % wt/wt desired), and oleic acid/myristic acid (1.9 mmol) were added to octadecene (5 mL) in a 50 mL 3-neck round bottom flask equipped with a magnetic stir bar, thermocouple and condenser, closing the third port with a septum. Using a 100 mL heating mantle packed with sand to promote even heating, the vessel was evacuated and heated 1 hr at 120 ˚C with vigorous stirring. The temperature was then rapidly increased to 295˚ C at which point oleylamine/octadecylamine (2.4 mmol) (and sulfur (3 mmol) for Bi2S3 nanomaterials) in 0.2 mL octadecene was injected via syringe. The solution color
23
precipitating the nanoparticles, followed by centrifugation at 3000 RPM for 10 minutes. This process was repeated three times. The nanoparticles were then taken up into 3 mL of either hexanes or chloroform and stored at room temperature. Solution colors varied based on the MOx
material formed (ZrO2 = orange; IrOx = Dark Blue; Bi2S3/Bi2O3 = Black).
2.2.5 Solvothermal Synthesis of ITO Nanoparticles
The solvothermal synthesis used follows the procedure reported by Niederberger et. al.12 Indium(III) acetylacetonate (1.55 mmol) and a wt% (2-30%) tin(IV) acetylacetonate dichloride were placed in an argon purged scintillation vial and stirred for 1 hr. The turbid solution was transferred to a Teflon lined Parr acid digestion bomb and heated at 200° C for 24-48 hr. The cloudy suspension was transferred to a 50 mL centrifugation tube and centrifuged at 3000 RPM for 10 minutes. Excess chloroform was added and the nanoparticles were centrifuged to remove any remaining benzyl alcohol. This process was repeated twice more. The resulting blue powder was dried at 60° C overnight then transferred to a scintillation vial for storage.
2.2.6 Citrate Capped Nanoparticles.
This procedure was modified from Drofenik et. al.13 A 1 mL sample of the hexane dispersed nanoparticles was rotovapped to dryness, the nanoparticles weighed (~5-50 mg) and redissolved in 7.5 mL toluene in a scintillation vial. The toluene solution was added to a solution of citric acid (3 mmol, ~0.6 g) in 7.5 mL DMF which caused the solution to became turbid. The mixture was stirred vigorously at 100 ˚C for 24 hrs, then was transferred to 50 mL centrifuge tubes and the nanoparticles precipitated by adding diethyl ether. They were collected via
24
2.2.7 Estimations of Nanoparticle Mass and Composition
Nanoparticle mass and composition was estimated by using the average nanoparticle diameter. The average diameter was found by using TEM images to generate a histogram (n = 50). The nanoparticles were assumed to be completely spherical with a radius equal to ½ the average diameter. Volume was determined by
𝑉 =4 3𝜋𝑟3
where V is volume (nm3) and r is the radius (nm). The crystalline structure of the nanoparticles
was assumed to be similar to that of the bulk material (ZrO2 = monoclinic14; IrOx = rutile15; Bi2S3
= orthorhombic16; Bi2O3 = monoclinic16). The volume of the unit cell was calculated from a, b,
and c values collected from the literature for the above structures. The volume of the
nanoparticle was then divided by the unit cell volume to estimate the number of unit cells present in a single nanoparticle. The number of unit cells could then be related to the number of metal ions and oxygen ions present in the nanoparticle. The number of metal ions was multiplied by its atomic mass and added to the mass of oxygens present yielding a molecular weight for a mole of nanoparticles. Sample masses could be divided by this molecular weight to determine moles of nanoparticles and subsequently the number of nanoparticles present in the sample.
2.3 Results and Discussion
2.3.1 Characterization of ZrO2 Nanoparticles Prepared by Thermal Degradation Synthesis
ZrO2 nanoparticles were synthesized predominately by the hot injection method detailed
25
sample vials after about 24 hr., which is believed to be unreacted Zr(ac)OH. Zr(ac)OH has very poor solubility except in strongly acidic solutions, and unreacted material is visible in the final reaction mixture. Zr(acac)4 was tested as a replacement and proved to be an ideal metal
precursor. The acetylacetonate solubilizes nicely at high temperatures and produces the same orange-brown solution seen with the acetate with no visible precipitate.
The size of the nanoparticles is difficult to determine based on the TEM images. The ZrO2 nanoparticles have little contrast against the TEM grid at high magnification. The organic
surfactant that covers the nanoparticles also tends to evaporate under high beam intensity, decreasing resolution. As such, the size distribution of the as synthesized nanoparticles can only be estimated from low resolution images. To circumvent this problem, the nanoparticles were capped with citrate following a previously reported procedure13. This removes the surfactant layer, allowing higher quality images to be taken. The citrate-ZrO2 nanoparticles are 1.54 ± 0.26
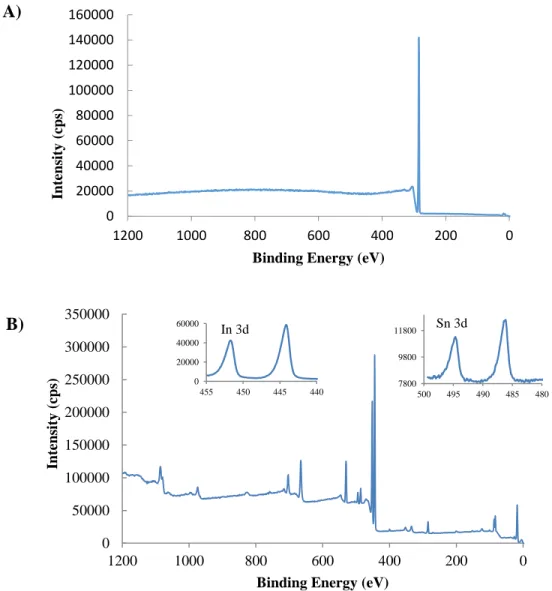
nm in diameter and are assumed to maintain the same size as the as-synthesized nanoparticles. XPS and EDX were both used to evaluate the elemental composition of the citrate-ZrO2
nanoparticles. Before citrate capping, XPS peaks are all masked due to photoelectron scattering by the surface surfactant (Fig 2.2a). After citrate capping, the spectrum shows clearly defined Zr 3d peaks at 182.1 and 184.6 eV (Fig. 2.2b). The citrate-ZrO2 sample shows significantly
26
Figure 2.1 –TEM Images of citrate-ZrO2 nanoparticles (1.5 ± 0.3 nm); panels A and B scale bars
are 50 nm and 10 nm, respectively. C shows a histogram of the nanoparticle size dispersion. 0
5 10 15 20
1
1
.2
5
1
.5
1
.7
5 2
2
.2
5
2
.5
Co
u
n
ts
Diameter (nm)
A) B)
27
Figure 2.2 – XPS of A) ZrO2 nanoparticles and B) citrate-ZrO2 nanoparticles. Insets show the Zr
3d peaks. 0 20000 40000 60000 80000 0 200 400 600 800 1000 1200 In te n sity (cps)
Binding Energy (eV)
0 40000 80000 120000 160000 200000 0 200 400 600 800 1000 1200 In te n sity (cps)
Binding Energy (eV)
150 200 250 300 350 173 178 183 188 Int ens it y (c ps )
Binding Energy (eV)
0 2000 4000 6000 8000 176 181 186 Int ens it y (c ps )
Binding Energy (eV) A)
28
Table 2.1 – XPS and EDX Atomic Values for ZrO2
Sample Name Method Zr Atomic Percent (%) Zr:O Ratio
ZrO XPS 0.13 0.15
29
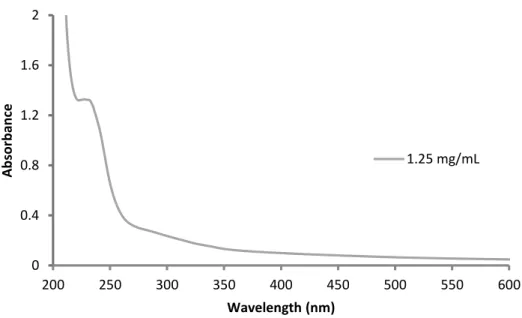
UV/Vis spectra (Fig. 2.3) of as synthesized ZrO nanoparticles in hexanes agree with previously reported spectra for ZrO2 nanoparticles of a similar size17. The nanoparticles have an
absorbance maximum at ~236 nm and a shoulder at ~298 nm. These optical band gaps are much lower than the 5.0 eV expected of bulk ZrO.
2.3.2 Characterization of IrO2 Nanoparticles Prepared by Thermal Degradation Synthesis
IrOx nanoparticles were synthesized by thermal degradation in an effort to compare the
resulting nanoparticles to those achieved by the literature prevalent hydrolytic method18. The
hydrolytic IrO2 nanoparticles have many properties of interest, chiefly their ability to lower the
overpotential of water oxidation, but tend to have wider size distributions than those achievable by thermal degradation. Ir(III) acetylacetonate was used as the metal precursor in the presence of oleylamine and oleic acid. The resulting dark black solution becomes midnight blue upon
sufficient dilution. TEM images (Fig 2.4) showed that the nanoparticles were similar in size to hydrolytic IrO2, with average diameters of 1.78 ± 0.28. Both XPS (Fig 2.5) and EDX (Fig 2.6)
confirm the presence of Ir in the as-synthesized IrO2 nanoparticles. As expected, the surfactant
shell causes the C 1s peaks to dominate the spectra, but high resolution scans show Ir 4f peaks at 61.2 and 64 eV. The EDX, which penetrates through the surfactant shell, shows a Ir:O ratio of 0.43; close to the expected 0.50.
2.3.3 Characterization of Bi2S3 and Bi2O3 Nanomaterials Prepared by Thermal
Degradation Synthesis
Bi2S3 nanomaterials were synthesized by both the hot injection method and the standard
method. Initial experiments used the hot injection method (HI-Bi2S3), where elemental sulfur
30
Figure 2.3 - UV/Vis spectrum of a 1.25 mg/mL solution of ZrO2 nanoparticles in hexanes. 0
0.4 0.8 1.2 1.6 2
200 250 300 350 400 450 500 550 600
A
b
sor
b
an
ce
Wavelength (nm)
31
Figure 2.4 – TEM Images of IrO2 nanoparticles (1.8 ± 0.3 nm); panels A and B scale bars are 10
nm and 5 nm, respectively. C shows a histogram of the nanoparticle size dispersion. 0
2 4 6 8 10 12 14 16
1 1.25 1.5 1.75 2 2.25 2.5
Cou
n
ts
Diameter (nm)
A) B)
32
Figure 2.5 – XPS of A) as-synthesized IrO2 nanoparticles. B shows a high resolution scan of the
Ir 4f region.
0 50000 100000 150000 200000 0 200 400 600 800 1000 1200 In ten sity (cp s)
Binding Energy (eV)
0 500 1000 1500 2000 2500 56 61 66 71 In ten sity (cp s)
33
34
Table 2.2 – XPS and EDX Atomic Values for IrO2
Sample Name Method Ir Atomic Percent (%) Ir:O Ratio
IrO2
XPS 0.85 0.24
35
precipitated using ethanol, but did not disperse in non-polar solvents as expected. Instead, this nanomaterial formed a hazy suspension for ca. 2 hrs. before precipitating out of solution. This behavior suggests an incomplete protective surfactant shell, which might mean that the
carboxylic acid and primary amine chosen (oleylamine and oleic acid) do not interact strongly with the crystalline planes of Bi2S3. TEM analysis of the suspension, as well as the unperturbed
solution, showed two separate nanomaterials existed in the suspended (Fig 2.7a), small nanorods and large ca. 200 nm nanoparticles. For comparison, two additional procedures were attempted, 1) where sulfur was hot injected without oleylamine (SI-Bi2S3) and 2) a standard TD synthesis
with sulfur added to the starting materials (Bi2S3). Hot injection of sulfur produced only the
Bi2S3 nanorods seen previously in HI-Bi2S3 (Fig. 2.7b) while the standard TD synthesis produced
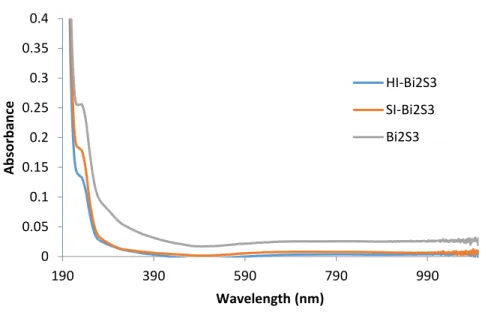
a nanostructure hybrid somewhere between a cube and a sphere (Fig. 2.7c). UV-Vis spectra of the Bi2S3 nanoparticles (Fig 2.9) show very similar absorbance with a predominate shoulder at
235 nm and minor absorbance at 290, 415, and 660 nm. The similarity in spectra suggests that the structure of the material has little effect on the absorbance.
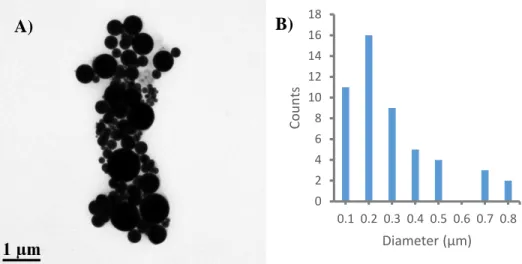
The Bi2O3 nanoparticles synthesized by the hot injection method proved to be anomalous
compared to other MOx nanoparticles made through this route. Instead of the small (<10 nm)
nanoparticles typically observed, the Bi2O3 nanoparticles are 270 ± 190 nm in diameter (Fig
2.10a). These nanoparticles are similar to the large nanoparticles present in the HI-Bi2S3 TEM
image suggesting that the large nanoparticles in that sample are likely Bi2O3 formed before the
hot injection of elemental sulfur, resulting in both materials presence in the sample. The Bi2O3
nanoparticles also exhibited the same precipitation from non-polar solvents as the Bi2S3 samples.
36
Figure 2.7 – TEM Images of Bi2S3 nanomaterials. A) shows HI- Bi2S3 (scale bar is 0.5 µm), B)
shows SI- Bi2S3 Bi2S3 (scale bar is 100 nm) and C) shows Bi2S3 (scale bar is 200 nm).
A) B)
37
38
Figure 2.9 – UV-Vis spectrum a of 1 mg/mL Bi2S3 nanoparticle solution in hexanes. 0
0.05 0.1 0.15 0.2 0.25 0.3 0.35 0.4
190 390 590 790 990
A
b
sor
b
an
ce
Wavelength (nm)
HI-Bi2S3
SI-Bi2S3
39
Figure 2.10 – TEM Images of Bi2O3 nanoparticles (290 ± 190 nm); panel A scale bar is 1 µm. B
shows a histogram of the nanoparticle size dispersion. 0
2 4 6 8 10 12 14 16 18
0.1 0.2 0.3 0.4 0.5 0.6 0.7 0.8
Cou
n
ts
Diameter (µm)
40
growth by passivating one or more crystalline planes. Without passivation, the nanoparticle growth is limited only by the reaction time. XPS and EDX of the Bi2O3 nanoparticles disagree in
this case. XPS shows very little Bi, even in the citrate capped sampled. The EDX shows substantial amounts of Bi, but very little oxygen yielding a Bi:O ratio of 16.5. Further investigation is needed to determine the composition of the “Bi2O3” nanoparticles.
2.3.4 Characterization of RuO2 Nanoparticles Prepared by Thermal Degradation Synthesis
Attempts were made to synthesize Ru2O3 nanoparticles using Ru(III) acetylacetonate in
the presence of oleylamine and oleic acid. During the reaction the solution turned from dark red to black, indicating a reaction had occurred. The reaction produced a material that was insoluble in ethanol, as would be expected for the surfactant capped nanoparticles. Analysis by TEM however, indicated no nanoparticles were present. The resultant nanoparticles were either too small to be resolved or unable to resolved due to the surfactant shell. No further analysis was attempted, but ruthenium was only metal acetylacetonate tested without evident nanoparticle formation.
2.3.5 Characterization of ITO Nanoparticles Prepared by Solvothermal Synthesis
41
Figure 2.11 - XPS of A) Bi2O3 and B) cit-Bi2O3. C) depicts a high resolution scan of the S 2p and
Bi 4f regions.
0 40000 80000 120000 160000 0 200 400 600 800 1000 1200 In ten sity (cp s)
Binding Energy (eV)
0 50000 100000 150000 200000 250000 0 200 400 600 800 1000 1200 In ten sity (cp s)
Binding Energy (eV)
6000 7000 8000 9000 158 163 168 173 In ten sity (cp s)
Binding Energy (eV) A)
B)
C)
SO3/SO4
42
43
Table 2.3 – XPS and EDX Atomic Values for Bi2O3 Sample Name Method Ir Atomic Percent (%) Bi:O Ratio
Bi2O3
XPS 0.00 -
EDS 22.32 16.53
44
type of controlled size distribution. Histograms for thermal degradation nanoparticles are Gaussian in nature, and the solvothermal distribution doesn’t appear to have any pattern. The images also show large amounts of flocculation, which is expected due to the unprotected nature of their surfaces. Solubility further limits the utility of solvothermal ITO nanoparticles. The powder was insoluble in all commonly used laboratory solvents. In order to solubilize them, an additional surface molecule, like citric acid or octanoic acid, was required. Ultimately,
solvothermal ITO did not offer enough advantages over the TD synthesis to make it worthwhile. The unpassivated surface was arguably more of hindrance than replacing the surfactant shell in TD. The reaction times were also substantially longer for nanoparticles with a poor size
distribution and lower yield.
2.4 Conclusions
These results clearly show the power and versatility of the thermal degradation synthesis. All of the MOx nanomaterials generated are currently undocumented in the literature and suggest
that MOx of almost any material can be generated assuming a metal aceylacetone is
commercially available. The TD nanoparticles also displayed a tight size distribution, compared to those generated through solvothermal routes. ZrO2 nanoparticles were further characterized by
surface modification (Chapter 4). Altering the capping ligands in the Bi2S3 and Bi2O3 systems
could ascertain more about ligand-surface interactions with regards to regulating nanoparticle size. Additional studies with Ru(acac)3 might also provide insight into synthetic limitations of
the TD route.
2.5 Acknowledgments
45
46
Figure 2.13 – TEM of solvothermal ITO nanoparticles (7.19 ± 1.42 nm); panels A and B scale bars are 50 nm and 5 nm, respectively. C shows a histogram of the nanoparticle size dispersion.
0 1 2 3 4 5 6 7 8 9
4.5 5.5 6.5 7.5 8.5 9.5
Cou
n
t
Diameter (nm) C)