*For correspondence: [email protected]
Competing interests:The authors declare that no competing interests exist.
Funding:See page 21 Received:09 January 2017 Accepted:21 August 2017 Published:24 August 2017 Reviewing editor: Ben Cooper, Mahidol Oxford Tropical Medicine Research Unit, Thailand
Copyright Watson et al. This article is distributed under the terms of theCreative Commons Attribution License,which permits unrestricted use and redistribution provided that the original author and source are credited.
Modelling the drivers of the spread of
Plasmodium falciparum hrp2
gene
deletions in sub-Saharan Africa
Oliver J Watson
1*, Hannah C Slater
1, Robert Verity
1, Jonathan B Parr
2,
Melchior K Mwandagalirwa
2,3, Antoinette Tshefu
3, Steven R Meshnick
2,
Azra C Ghani
11
Medical Research Council Centre for Outbreak Analysis and Modelling,
Department of Infectious Disease Epidemiology, Imperial College London, London,
United Kingdom;
2Division of Infectious Diseases, University of North Carolina,
Chapel Hill, United States;
3Ecole de Sante´ Publique, Faculte´ de Medecine,
Universite´ de Kinshasa, Kinshasa, Democratic Republic of the Congo
Abstract
Rapid diagnostic tests (RDTs) have transformed malaria diagnosis. The most prevalent P. falciparumRDTs detect histidine-rich protein 2 (PfHRP2). However,pfhrp2gene deletions yielding false-negative RDTs, first reported in South America in 2010, have been confirmed in Africa and Asia. We developed a mathematical model to explore the potential for RDT-led diagnosis to drive selection ofpfhrp2-deleted parasites. Low malaria prevalence and high frequencies of people seeking treatment resulted in the greatest selection pressure. Calibrating our model against confirmedpfhrp2-deletions in the Democratic Republic of Congo, we estimate a starting frequency of 6%pfhrp2-deletion prior to RDT introduction. Furthermore, the patterns observed necessitate a degree of selection driven by the introduction of PfHRP2-based RDT-guided treatment. Combining this with parasite prevalence and treatment coverage estimates, we map the model-predicted spread ofpfhrp2-deletion, and identify the geographic regions in which surveillance forpfhrp2 -deletion should be prioritised.DOI: https://doi.org/10.7554/eLife.25008.001
Introduction
Efforts to control malaria globally have made substantial progress in the last 15 years (World Health Organization, 2015a). This progress reflects the impact made by reinvigorated political commit-ment that has yielded a twenty-fold increase in international funding for the control and elimination of malaria (World Health Organization, 2015a). The World Health Organisation (WHO) Global Technical Strategy for Malaria 2016–2030 sets ambitious goals to further reduce incidence and mor-tality rates by 90% by 2030 (World Health Organization, 2015b). Central to achieving these goals is the need to test, treat and track all malaria (World Health Organization, 2010).
In sub-Saharan Africa (SSA), diagnostic testing of suspected malaria cases has risen from 36% to 60% between 2005 and 2014 (World Health Organization, 2015a). Microscopy was historically the most common method for diagnosis; however rapid diagnostic tests (RDTs) accounted for 71% of all diagnostic testing of suspected cases in 2014 (World Health Organization, 2015a). The most widely used RDTs target histidine-rich protein 2 (HRP2), which is expressed by thePlasmodium falciparum
False-negative RDT results due to a partial or complete deletion of thepfhrp2 gene have been reported in areas of South America since 2010, resulting in the recommendation against the use of PfHRP2-based RDTs in these areas (Akinyi et al., 2013;Abdallah et al., 2015;Cheng et al., 2014). Thesepfhrp2-deleted mutants may still possess a functioningpfhrp3gene; however, the cross reac-tivity between PfHRP2-based RDT antibodies and PfHRP3 epitopes is such that a positive result may only occur at very high parasitaemia (Baker et al., 2005). Confirmedpfhrp2-deleted mutants are rarer in Africa, with the first cases reported in Mali in 2012 (Koita et al., 2012). However, recently confirmed occurrences in Ghana, (Amoah et al., 2016) Zambia, (Laban et al., 2015) the Democratic Republic of Congo (DRC), (Parr et al., 2016) Rwanda (Kozycki et al., 2017) and Eritrea (Berhane et al., 2017) (Table 1) have prompted the WHO to host Technical Consultations on
pfhrp2/3-deletions and to issue interim guidance for malaria control programs (World Health Orga-nization, 2017; World Health Organization, 2016a; World Health Organization, 2016b). This raises the concern thatpfhrp2-deleted mutants may be selected for by RDT-guided treatment deci-sions – which if confirmed would be one of the first example of selection of a pathogen through diagnostic testing.
Here we use mathematical modelling to characterise the impact of introducing PfHRP2-based RDTs on the emergence and spread ofpfhrp2-deleted parasites. We adapt a previously published transmission model (Griffin et al., 2016), incorporating the transmission ofpfhrp2-deleted mutants and the contribution of PfHRP3 cross-reactivity to identify settings in which the selective pressure favouringpfhrp2-deleted strains is greatest. In addition, we conduct sensitivity analyses to character-ise the influence of assumptions within our model concerning adherence to RDT-guided treatment decisions, the use of microscopy-based diagnostic testing, fitness costs associated with the mutant parasite and the impact of non-malarial fevers upon the selective advantage ofpfhrp2 gene dele-tions. We continue by using a nationally representative cross-sectional study of pfrhp2-deletion in the DRC (Parr et al., 2016) to estimate the prevalence ofpfhrp2-deleted mutants prior to RDT intro-duction. This, in turn, allows us to map predicted geographical regions across SSA where
pfhrp2-eLife digest
Since the turn of the millennium, a large increase in international funding has helped to reduce the public health impact of malaria. The introduction of rapid diagnostic tests has played a central role in these efforts, particularly in remote areas that are heavily affected by the disease. These tests analyse human blood samples for specific proteins that are produced by malaria parasites.The most common rapid diagnostic tests for malaria detect a protein called HRP2, which is produced by the deadliest malaria parasite,Plasmodium falciparum. Recently, however, cases have emerged where the tests have failed to detect these malaria infections. The first occurred in South America, and were found to be because some malaria parasites no longer possessed the gene that produces HRP2. Since then, malaria parasites that lack this gene have been found in several
locations in Africa. This raises the question of whether using the tests favours the survival and spread of parasites that cannot produce the HRP2 protein.
Using mathematical modelling techniques, Watson et al. now present evidence that suggests that the use of HRP2-detecting rapid diagnostic tests over the past 10 years could have favoured the evolution of malaria parasites that lack this protein. Furthermore, the models suggest that the conditions that are most likely to cause such selection are places where malaria infections are not common but people seek treatment at high rates.
Using this information, Watson et al. created a map of 160 locations in Africa most at risk of rapid diagnostic test-driven selection against the gene that produces HRP2. Public health authorities could use these maps to determine where they should more closely monitor malaria parasites to see if they lack this gene.
Future genetic investigations will be required in the high-risk areas to confirm and refine the predictions. The development of rapid diagnostic tests that detect other malaria proteins will also be essential if malaria parasites that lack HRP2 continue to spread.
deletion surveillance should be focused. These mapped predictions are explored across a range of estimates of the prevalence ofpfhrp2-deleted mutants prior to RDT introduction.
Results
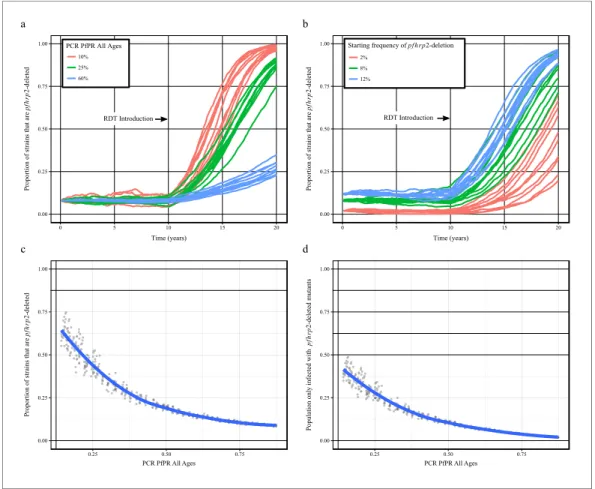
Using our newly adapted model incorporating the transmission ofpfhrp2-deleted mutants, we first explored the potential for RDT-guided treatment decisions to exert an evolutionary pressure on the prevalence of the mutant. Figure 1 shows the predicted proportion of strains that are pfhrp2 -deleted within the population after 10 years.
Within all settings that explored different transmission intensities and starting frequencies of
pfhrp2-deletion, RDT introduction is predicted to increase the proportion of pfhrp2-deleted mutants. The strength of selection is predicted to be greatest at low PfPR (Figure 1a); however, a selective pressure is still predicted at both high PfPR and at low startingpfhrp2-deletion frequencies (Figure 1b). The variance in the selection pressure exerted by RDTs is also predicted to be greatest at low PfPR (Figure 1c). A more gradual but analogous trend is predicted in the proportion of the population that were only infected with pfhrp2-deleted mutants (Figure 1d). The prevalence of malaria withinFigure 1a was also observed to increase after RDT introduction (Figure 1—figure supplement 1), with the greatest increase in lower transmission settings resulting from untreated infections due to false-negative RDT results.
Within the sensitivity analyses, a selective pressure is observed to exist at comparative fitness costs of greater than 90% (see Figure 1—figure supplement 2), however below this the
pfhrp2-deletion allele is quickly lost. Both the introduction of additional diagnosis with microscopy-based methods and non-adherence to RDT results decreased the selective pressure, slowing the rate of
pfhrp2-deletion emergence (seeFigure 1—figure supplement 3). The introduction of non-malarial fevers, however, increased the rate of pfhrp2-deletion emergence (see Figure 1—figure supple-ment 4), even at 25% below the mean estimated rate of non-malarial fever. When these opposing factors were combined, RDT introduction is still predicted to increase the proportion of pfhrp2 -deleted mutants (Figure 1—figure supplement 5).
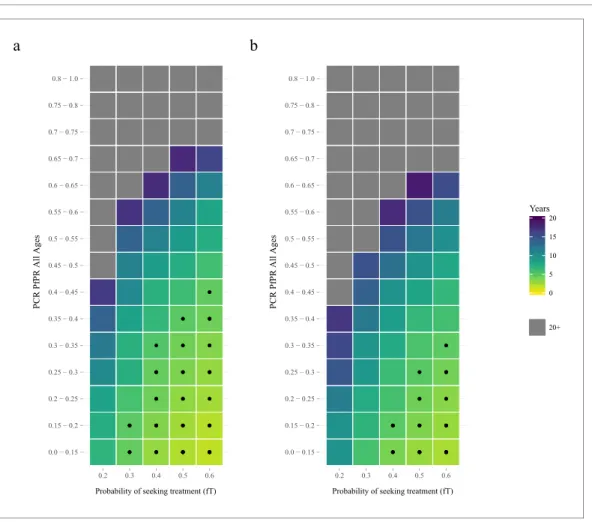
The proportion of clinical cases seeking treatment (assumed here to be treated on the basis of an RDT result) is also predicted to exert a strong selection pressure forpfhrp2-deletion (Figure 2). A consistent relationship was seen across comparable PfPR ranges, with the lowest treatment seeking rates (fT = 0.2) yielding the slowest increase in the proportion of infections due to only pfhrp2 -deleted mutants. Again, the lower PfPR categories show the greatest selection pressures forpfhrp2 -deletion, with treatment seeking rates >30% and PfPR <25% leading to 20% of infections due to onlypfhrp2-deleted mutants in fewer than five years (Figure 2a).
The selection pressure favouringpfhrp2-deletions is predicted to be weaker when PfHRP3 epito-pes are assumed to cause positive RDT results (Figure 2b). In settings where PfHRP3 epitopes are assumed to cause a positive RDT result in 25% of cases ("= 0.25), there are four fewer prevalence categories that reach 20% of infections due to onlypfhrp2-deleted mutants in fewer than five years. A similar effect is observed in the mean final frequency of pfhrp2-deletion, with 64% frequency recorded after 20 years when no PfHRP3 epitope effect is assumed in comparison to 56% when"is equal to 0.25 (Figure 2—figure supplement 1).
To estimate the starting frequency ofpfhrp2-deleted mutants, we used estimates of the propor-tion ofpfhrp2-deleted mutants from a national study in DRC (Parr et al., 2016) to calibrate the model. The calibration incorporated both the PfPR levels and estimates of the treatment rates in the 26 Divisions Provinciales de la Sante´ (DPS) that would drive selection of the mutant. We estimate a starting frequency ofpfhrp2-deleted P. falciparumof 6% in the DRC prior to any introduction of RDTs. The observed relationship between the proportion of infections due to pfhrp2-deleted mutants and PCR PfPR among children 6–59 months of age (Figure 3a) displays a similar trend to the simulations, however with a notably steeper increase at lower prevalence. Of note, the same relationship was not predicted in the absence of selection pressure due to RDT-based treatments (i.e. purely on the basis of the variation in monoclonal infections) (Figure 3b).
administrative units (Figure 4—figure supplement 1), which enabled us to project the potential increase of the mutant strain and its impact on RDT-guided treatment (Video 1). Our results suggest that 160 of 850 first-administrative regions may have over 20% of all infections due to onlypfhrp2 -deleted mutants by 2016 (Figure 4c). These areas, which we term of ‘high HRP2 concern’, are largely located in areas where PfPR2-10in 2010 was less than 25% (Figure 4a). A number of other regions,
PCR PfPR All Ages PCR PfPR All Ages
Figure 1.Predicted increase inpfhrp2-deletion upon RDT introduction after 10 years. Graphs show the time course ofpfhrp2-deletion emergence under (a) different transmission intensities (10%, 25% and 60% PfPR) and 8% starting frequency ofpfhrp2-deletion prior to RDT introduction and under (b) different assumed starting
frequencies ofpfhrp2-deletion prior to RDT introduction (2%, 8% and 12% starting frequency) and 25% PfPR. Five years after RDT introduction, the proportion of strains that arepfhrp2-deleted (c), and the proportion of the population that are infected with onlypfhrp2-deleted mutants (d) is recorded. The dark grey dots denote individual simulation runs with a LOESS regression fit shown in blue. Source data forFigure 1is provided within
Figure 1—source data 1.
DOI: https://doi.org/10.7554/eLife.25008.004
The following source data and figure supplements are available for figure 1:
Source data 1.Effect of transmission intensity andpfhrp2-deletion starting uponpfhrp2-deletion emergence.
DOI: https://doi.org/10.7554/eLife.25008.010
Figure supplement 1.Impact of increasepfhrp2-deletion upon malaria prevalence.
DOI: https://doi.org/10.7554/eLife.25008.005
Figure supplement 2.Impact ofpfhrp2-deletion fitness cost.
DOI: https://doi.org/10.7554/eLife.25008.006
Figure supplement 3.Impact of microscopy use and non-adherence to RDT results.
DOI: https://doi.org/10.7554/eLife.25008.007 Figure supplement 4.Impact of non-malarial fever.
DOI: https://doi.org/10.7554/eLife.25008.008
Figure supplement 5.Combined impact of model assumptions.
classified as ‘moderate HRP2 concern’ have high treatment rates, and hence potential selective pres-sure, despite having comparatively higher transmission (Figure 4b). Our results also illustrate that regions with low transmission may have low HRP2 concern if the frequency of people seeking treat-ment is very low.
Discussion
Our results demonstrate that the key drivers ofpfhrp2-deletion selection are low malaria transmis-sion and a high frequency of people seeking treatment and being correctly treated on the basis of diagnosis with a PfHRP2-based RDT. Based on Africa-wide estimates of parasite prevalence and treatment-seeking behaviour at the time of RDT-introduction, we identified 160 first-administrative units which we classify as ‘high HRP2 concern’. These are areas where thepfhrp2-deleted strain is
0.0 − 0.15 0.15 − 0.2 0.2 − 0.25 0.25 − 0.3 0.3 − 0.35 0.35 − 0.4 0.4 − 0.45 0.45 − 0.5 0.5 − 0.55 0.55 − 0.6 0.6 − 0.65 0.65 − 0.7 0.7 − 0.75 0.75 − 0.8 0.8 − 1.0
0.2 0.3 0.4 0.5 0.6
P
fP
R
a
0.0 − 0.15 0.15 − 0.2 0.2 − 0.25 0.25 − 0.3 0.3 − 0.35 0.35 − 0.4 0.4 − 0.45 0.45 − 0.5 0.5 − 0.55 0.55 − 0.6 0.6 − 0.65 0.65 − 0.7 0.7 − 0.75 0.75 − 0.8 0.8 − 1.0
0.2 0.3 0.4 0.5 0.6
b
0 5 10 15 20 Years
20+
Figure 2.The predicted rate at which the population is only infected withpfhrp2-deleted mutants. The graphs show the time in years after RDT introduction at which 20% of the population are only infected withpfhrp2 -deleted mutants up to a maximum follow-up time of 20 years post RDT introduction. PfHRP3 epitopes were assumed to cause a positive RDT result in (a) 0% or (b) 25% of individuals only infected withpfhrp2-deleted mutants. The plotted years represent the mean time grouped in each prevalence and treatment setting, with black dots representing where 20% was reached in less than five years. Each simulation had a startingpfhrp2-deletion frequency of 8% before RDT introduction. Source data forFigure 2is provided withinFigure 2—source data 1.
DOI: https://doi.org/10.7554/eLife.25008.011
The following source data and figure supplement are available for figure 2:
Source data 1.Years after RDT introduction at which 20% of the population are only infected withpfhrp2-deleted parasites, with an assumed PfHRP3 epitope effect equal to 0% and 0.25%.
DOI: https://doi.org/10.7554/eLife.25008.013
Figure supplement 1.Frequency ofpfhrp2-deletion after 20 years.
0 10 20 30 40
20 40 60 80
PCR PfPR 6 59 months
DHS Dataset
Simulation
a
0 10 20 30 40
20 40 60 80
PCR PfPR 6 59 months
DHS Dataset
Simulation
b
Figure 3.Simulated province level burden ofpfhrp2-deleted mutants within the DRC, with an assumed probability of a clinical case seeking treatment, who is only infected withpfhrp2-deleted mutants, producing a positive RDT result (") equal to 0.25. In (a) the mean simulated proportion of children aged 6–59 months who are infected with
onlypfhrp2-deleted mutants is shown in red. Each region had an assumed starting frequency of 6%pfhrp2
-deletion prior to RDT introduction in 2010 (2007 in North- and South-Kivu). The results in grey represent the recorded burden from the DHS survey (Figure 3—source data 1), with both datasets fitted with a LOESS regression. Error bars show the 95% confidence interval. In (b) the same simulation conditions were used as in (a) however it is assumed that no selection pressure is exerted by the introduction RDTs, i.e."= 1. Source data for
Figure 3is provided withinFigure 3—source data 1.
DOI: https://doi.org/10.7554/eLife.25008.014
The following source data and figure supplement are available for figure 3:
Source data 1.Estimates of the proportion of pfhrp2-deleted mutants from a national study in DRC.
expected to increase in frequency over a relatively short timescale, and hence where further surveil-lance efforts should be concentrated.
Our results are based on calibration to a large representative survey of malaria across DRC. Due to its size and location in the centre of SSA, the DRC is arguably one of the most representative countries for endemic malaria in Africa. That the model was able to predict the observed relationship in the DRC, despite variability at a province level, provides support for the hypothesis that the vari-ability inpfhrp2-deletion frequency with transmission is driven by selection. However, in contrast to other reported surveys, the samples in this survey were primarily drawn from asymptomatic infec-tions, and hence may not be representative of other reports ofpfhrp2-deletion in symptomatic cases with higher parasite density. However, it is interesting to note that our results show broad agree-ment with published data sets from Zambia (Laban et al., 2015) and Ghana (Amoah et al., 2016) (Table 1). In particular, our predictions confirm that the HRP2 concern would be greater in Ghana than in Southern Zambia. However, one study in Senegal found a lower prevalence ofpfhrp2- dele-tion than we predict (Wurtz et al., 2013).
A key uncertainty in predicting the potential spread ofpfhrp2-deletion due to RDT-induced selec-tive pressure is the extent of use of, and adherence to, RDT results and the availability of appropri-ate treatment. On the one hand, if adherence to RDT results is poor (for example, with patients who show continued clinical symptoms of malaria in the absence of a positive test) or additional micros-copy-based detection is used (Figure 1—figure supplement 3), if appropriate treatment is not avail-able (for example, due to stock-outs), or if treatment is not fully curative (for example, due to patient non-adherence, drug resistance or fake drugs) then the spread of these deletions will be slower than predicted. On the other hand, in areas in which active case detection occurs, or in which treatment is sought for non-malaria fevers (Figure 1—figure supplement 4), RDT-based treatment may also selectively clear non-deleted asymptomatic
infec-tions and hence increase the rate of spread of the deletion. However, when these factors, along with potential fitness costs associated with
pfhrp2-deletion, were investigated together we still observed an increase inpfhrp2-deletion ( Fig-ure 1—figFig-ure supplement 5), which showed a similar rate of increase to that predicted by our model. Further data on RDT usage and adher-ence, as well as on non-malarial fevers and the precise fitness cost of pfhrp2-deletion, however, could help to refine mapping of areas of HRP2 concern.
A second uncertainty relates to the underlying prevalence of the mutation prior to RDT introduc-tion. There is considerable variability in the esti-mates that have been measured both before and after RDT introduction, and it is entirely plausible that the presence of mutations could vary geo-graphically at a range of spatial scales. However, estimating this variation is difficult given the lack Figure 3 continued
DOI: https://doi.org/10.7554/eLife.25008.016
Source data 2.Simulated proportion of children aged 6–59 months who are only infected withpfhrp2-deleted parasites within the Democratic Republic of Congo, with an assumed PfHRP3 epitope effect equal to 0.25% and 1%, that is under no selection pressure.
DOI: https://doi.org/10.7554/eLife.25008.017
Figure supplement 1.Simulated province level burden ofpfhrp2-deleted mutants within DRC, with an assumed probability of a clinical case seeking treatment, who is only infected withpfhrp2-deleted mutants, producing a positive RDT result (") equal to 0.
DOI: https://doi.org/10.7554/eLife.25008.015
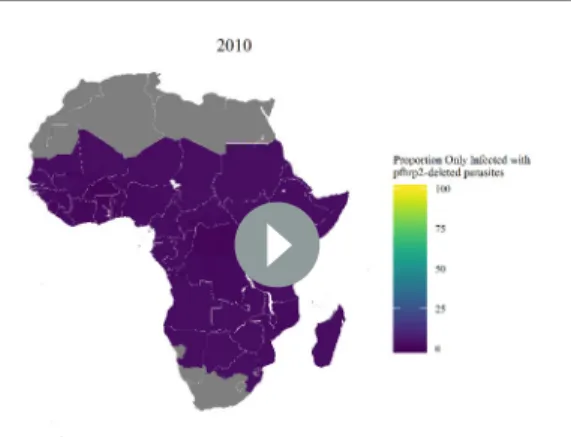
Video 1.The projected increase in individuals who are only infected withpfhrp2-deleted parasites, from 2010 to 2030, with an assumed starting frequency of 6%
pfhrp2-deletion, and an assumed PfHRP3 epitope
effect equal to 0.25%. The video relates directly to
Figure 4.
a
b
c
Microscopy PfPR 2−10
0%
25%
50%
75%
100%
3UREDELOLW\RIVHHNLQJ WUHDWPHQWI7
0%
25%
50%
75%
100%
HRP2 Concern
Marginal
Slight
Moderate
High
Figure 4.Predicted areas of HRP2 concern in comparison to recorded prevalence and treatment seeking rate, with an assumed probability of a clinical case seeking treatment, who is only infected withpfhrp2-deleted mutants, producing a positive RDT result (") equal to 0.25. The graphs show (a) the recorded malaria prevalence in children aged 2–10 by microscopy in 2010, (b) the frequency of people seeking treatment in 2010 and (c) the predicted concern for the impact ofpfhrp2-deleted mutants. In (c), high, moderate and slight risk represent >20% infection due to onlypfhrp2-deleted mutants by 2016, 2022 and 2030 respectively, and marginal risk represents <20% by 2030. In 2010, each region was assumed to have a starting frequency of 6%
pfhrp2-deletion. Source data forFigure 4is provided withinFigure 4—source data 1.
DOI: https://doi.org/10.7554/eLife.25008.018
The following source data and figure supplements are available for figure 4:
of a sampling framework in reports mainly based on clinical cases and given the relatively small sam-ple sizes. Thus our results should be interpreted not as predictions of the absolute levels of the gene deletion, but rather indicative of geographical areas in which surveillance should be focused. Simi-larly, these results should not be interpreted as predictions of the precise negative impact on malaria prevalence as a result of increased gene deletions (Figure 1—figure supplement 1), but illustrative of the potential impact of false-negative test results upon malaria prevalence and the importance of alternative diagnostic methods (Figure 1—figure supplement 3). At the same time, further data col-lated in the coming months and years can be incorporated to iteratively update and refine our projections.
As with any modelling exercise, there are a number of important limitations. Firstly, we did not capture seasonality or any fitness cost associated withpfhrp2-deletion. At a given transmission level, highly seasonal locations are likely to have a lower frequency of pfhrp2-deletion in comparison to regions with perennial transmission. Seasonality could however cause substantial bottlenecks which may result in repetitive founder effects that could affect selection, resulting in either a decreased chance ofpfhrp2-fixation or an accelerated fixation if it occurred (Aguile´e et al., 2009). In simula-tions incorporating a fitness cost the selection pressure was found to be considerably weaker ( Fig-ure 1—figFig-ure supplement 2). The exact fitness cost, despite being unknown, is likely subtle as our modelled fitness penalty would cause the strain to be eliminated at less than 90% comparative fit-ness. In addition, current theories concerning the role of PfHRP2 indicate a more minor role in heme detoxification than previously thought. Strains lacking PfHRP2 have been shown to be viable (Papalexis et al., 2001), with heme detoxification more dependent on the recently characterised haem detoxification protein (HDP) (Jani et al., 2008). Furthermore, in South America the first cases ofpfhrp2-deletedP. falciparumwere confirmed prior to the introduction of RDTs (Gamboa et al., 2010). This suggests that these mutants may possess sufficiently high fitness such that the frequency ofpfhrp2-deletion is maintained in the absence of a selective advantage exerted through the use of HRP2-based RDTs.
Secondly, our results depend on assumptions made regarding the contribution of PfHRP3 epi-tope reactivity and the potential for false-positive RDT results. We found that increased cross-reactivity with PfHRP3 epitopes decreases selection forpfhrp2-deletion and was investigated due to confirmed observations of PfHRP2-based RDTs detecting PfHRP3 epitopes at high parasitaemia (Baker et al., 2010). In simulations with no epitope effect, the model predicts the pattern in DRC well (Figure 3—figure supplement 1) and predicts a higher overall estimate of HRP2 concern ( Fig-ure 4—figFig-ure supplement 1), although the same regional patterns are identified (Figure 4—figure supplement 2). Furthermore, false-positive RDT results would decrease the strength of the selection pressure, withpfhrp2-monoclonal infections being treated. However, false-positivity rates observed within round 6 of WHO RDT product testing were found to be low, with the median false-positive rate on both clean negative samples and samples containing other infectious agents equal to 0%, Figure 4 continued
Source data 1.Recorded malaria prevalence in children aged 2–10 by microscopy in 2010 (sourced from the Malaria Atlas mapping project [see Meta-data - Datasets]), the frequency of people seeking treatment in 2010 (sourced fromCohen et al., 2012[see Metadata – Datasets]) and the simulated predicted concern for the impact ofpfhrp2-deleted mutants, with an assumed PfHRP3 epitope effect equal to 0.25%.
DOI: https://doi.org/10.7554/eLife.25008.024
Figure supplement 1.Model malaria prevalence output against Malaria Atlas Project prevalence 2010 (Bhatt et al., 2015).
DOI: https://doi.org/10.7554/eLife.25008.019 Figure supplement 2.HRP2 Concern heat maps.
DOI: https://doi.org/10.7554/eLife.25008.020
Figure supplement 3.Predicted areas of HRP2 concern in comparison to recorded prevalence and treatment coverage with an assumed probability of a clinical case seeking treatment, who is only infected with pfhrp2-deleted mutants, producing a positive RDT result (") equal to 0.
DOI: https://doi.org/10.7554/eLife.25008.021
Figure supplement 4.Impact of different assumptions about starting frequency ofpfhrp2-deletion upon the geographical pattern of selection-driven increase inpfhp2-deletion.
DOI: https://doi.org/10.7554/eLife.25008.022
Figure supplement 5.Years in which RDTs were used at community level in Sub-Saharan Africa.
and the overall false-positive rate on samples containing immunological factors equal to 0.9% (World Health Organization, 2015c).
Thirdly, in the absence of systematic country introduction data, we assumed introduction of RDTs in all countries from 2010 in accordance with the WHO recommendation of testing in 2010 (World Health Organization, 2010). The precise date from region to region is undoubtedly more complex, however 2010 is a sensible estimate given the reported years at which RDTs were available at the community level in SSA by the WHO (Figure 4—figure supplement 5) (World Health Organi-zation, 2012b). However, the ratio of testing via microscopy versus RDT is likely to have decreased over this period, and hence our estimate of RDT use (which our model assumes is 100% from intro-duction) is likely too high. The sensitivity of the output to this parameter is demonstrated in the data from the DRC, in which higher levels ofpfhrp2-deletion are observed in Kivu, an area in which RDT introduction likely occurred earlier than elsewhere in the country (Me´decins Sans Frontie`res, 2007). Fourthly, extrapolating the starting frequency of pfhrp2-deletion strains from the DRC across the rest of SSA is a clear oversimplification; however, in the absence of similar datasets, we feel it pro-vides a reasonable first estimate. To assess the implications of this estimate, we also considered how the pattern of geographical areas that we have recommended for priority surveillance changes under different assumed starting frequencies ofpfhrp2-deletion (Figure 4—figure supplement 4). Despite the expected changes in the final frequency ofpfhrp2-deletion in these settings, the overall pattern of areas with the highest selection-driven increase inpfhrp2-deletion remains the same. A final limi-tation is that we assumed that treatment rates and transmission of malaria remain constant from 2010. This is clearly not the case, with 30 countries in SSA reporting a decline in prevalence from 2010 to 2015 (Bhatt et al., 2015). These combined effects, however, would presumably cause an increase in monoclonal infections and subsequent false-negative RDTs due to pfhrp2-deleted parasites.
In summary, our modelling predicts that an increased emergence ofpfhrp2-deleted mutants may be explained by the introduction of testing by PfHRP2-based RDTs. If this is indeed the case, this would be, to our knowledge, one of the first examples of the emergence of resistance of a pathogen to a diagnostic test. The use of these RDTs will result in the greatest selection pressure in regions that have low malaria transmission and a high frequency of RDT-based treatment of clinical cases. Rapid and accurate diagnosis ofP. falciparuminfection, however, is essential for continued reduction in malaria transmission. In light of this, it may be sensible for public health bodies who are respond-ing to reports ofpfhrp2gene deletions to focus surveillance in the regions we have identified as hav-ing a high HRP2 concern. This work should proceed alongside further improvement of non-HRP2-based RDTs, such as those that detect lactate dehydrogenase, and the development of new alterna-tive diagnostics.
Materials and methods
P. falciparum
transmission model
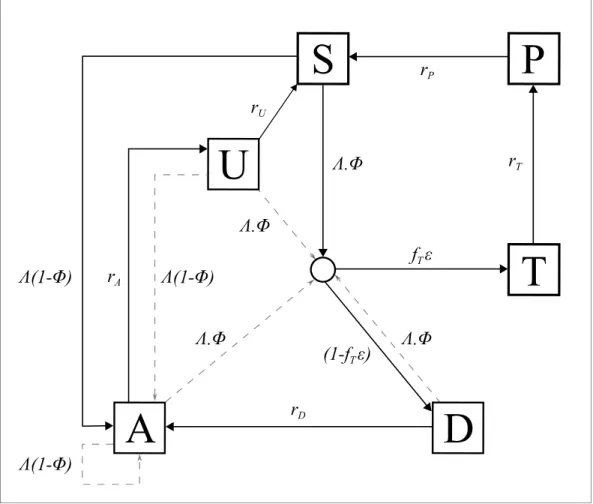
An individual-level stochastic model was developed to simulate the transmission dynamics of Plas-modium falciparum. The model is based upon previous modelling efforts (Griffin et al., 2016; Griffin et al., 2014;Griffin et al., 2015), and is described in full here before describing the exten-sions made with regards to PfHRP2 dynamics, and defining the parameters used and their sources. The model is implemented as stochastic individual-based model with a fixed daily time step, incor-porating the necessary delay terms where mentioned, which is described in greater detail later. In overview, the transmission model considers people to exist in one of six infection states (Figure 5): susceptible (S), clinical disease (D), clinically diseased and receiving treatment (T), asymptomatic infection (A), protective state of prophylaxis (P), and subpatent infection (U).
Individuals begin life susceptible to infection (state S). At birth, individuals possess a level of maternal immunity that decays exponentially over the first 6 months. Each day individualiis proba-bilistically exposed to infectious bites governed by their individual force of infection (Li).Liis
depen-dent on their pre-erythrocytic immunity, biting rate (dependepen-dent on both their age and their individual relative biting rate due to heterogeneous biting patterns in mosquitoes) and the mosquito population’s size and infectivity. Infected individuals, after a latent period of 12 days (dE), develop
their probability of acquiring clinical disease (f), which is dependent on their clinical immunity. Indi-viduals that develop disease have a fixed probability (fT) of seeking treatment (state T), and a vari-able probability ("i) that the clinical case yields a positive diagnostic result and subsequently receives
treatment. "i is dependent on the assumed role of PfHRP3 epitopes, and the strain profile of
infected individual i with respect to pfhrp2-deleted mutants. Treated individuals are assumed to always recover, i.e. fully-curative treatment, and then enter a protective state of prophylaxis (state P) at rate rT, before returning to susceptible at rate rS. Individuals that did not receive treatment recover to a state of asymptomatic infection at raterD.Asymptomatic individuals progress to a sub-patent infection (stage U) at raterA,before clearing infection and returning to susceptible at raterU. Additionally, superinfection is possible for all individuals in states D, A and U. Superinfected individu-als who receive treatment will move to state T. Individuindividu-als who are superinfected but do not receive treatment in response to the superinfection will either develop clinical disease, thus moving to state D, or develop an asymptomatic infection and move to state A (except for individuals who were previ-ously in state D, who will remain in state D).
The introduction of a fixed time step translates the waiting times at which individuals move from one infection state to another into a daily probability that this event occurs, with the probability drawn from the related exponential distribution. Thus the probability of a transition from state A to state B with hazard ratelis given by:
S
P
D
T
U
A
r
Ar
Ur
Pr
Tr
D(1- )
(1- )
(1- )
.
f
T.
(1-f
T)
.
.
Figure 5.Transmission Model. Flow diagram for the human component of the transmission model, with dashed arrows indicating superinfection. S, susceptible; T, treated clinical disease; D, untreated clinical disease; P, prophylaxis; A, asymptomatic patent infection; U, asymptomatic sub-patent infection. All parameters are described withinTable 2.
Prob Að !BÞ:1 expð lÞ
The set of state transitions for individuals and their associated hazard rates are given below.
Process Transition Hazard
Infection SfiI Liðt dEÞ
Progression of untreated disease to asymptomatic infection DfiA rD¼d1D
Progression of asymptomatic infection to subpatent infection AfiU rA¼d1A
Progression of subpatent infection to susceptible UfiS rU¼d1 U
Progression of treated disease to uninfected prophylactic period TfiP rT¼d1T
Progression from uninfected prophylactic period to susceptible PfiS rP¼d1P
Super-infection from untreated clinical disease, asymptomatic infection or subpatent infection
DfiI AfiI UfiI
Liðt dEÞ
Here stateIdenotes an infection state which is not tracked but which leads to either clinical dis-ease (D), treated clinical disease (T) or asymptomatic infection (A). In the original model the probabil-ity of entering these states is determined by drawing a sequence of Bernoulli trials for each infected individual as:
Prob Clinical Diseaseð Þ:Bernoullið Þfi
Prob Treated Clinical Diseaseð jClinical DiseaseÞ:Bernoulli fð ÞT
For our model here, in which treatment is guided by RDT-based diagnostics, we introduce. . .
Prob Treated Clinical Diseaseð jClinical DiseaseÞ:Bernoulli fðT"iÞ
We assume that each person has a unique biting rate, which is the product of their relative age dependent biting rate, i, given by
ið Þ ¼a
Pn i¼1 ið Þa
n 1 exp
a a0
and an assumed heterogeneity in biting patterns of mosquitoes, zi, which we assume persists throughout their lifetime and is drawn from a log-normal distribution with a mean of 1,
logð Þzi ~N
s2
2 ;s
2
where 1 is the relative biting rate at birth when compared to adults and a0 represents the
time-scale at which the biting rate increases with age. The product of these biting rates is subse-quently used to calculate an individual’s entomological inoculation rate, hi, and subsequently their
force of infection, which are given by
hi¼ akIMzi i
Li¼ hibi
whereak is the daily rate at which a mosquito takes a blood meal,IM is the size of the infected
mosquito population, andbiis the probability of infection given an infectious mosquito bite.
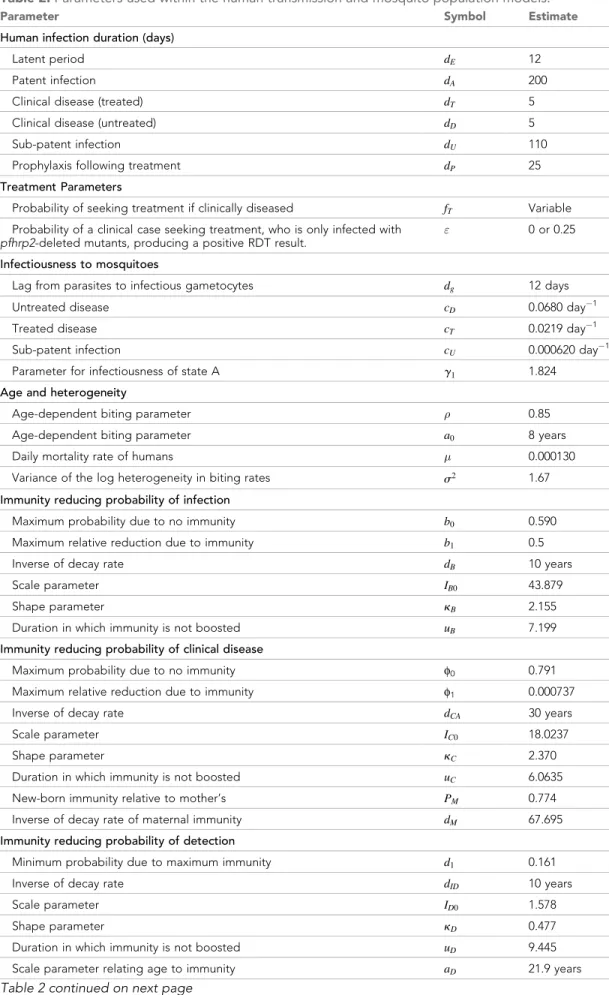
Table 2.Parameters used within the human transmission and mosquito population models.
Parameter Symbol Estimate
Human infection duration (days)
Latent period dE 12
Patent infection dA 200
Clinical disease (treated) dT 5
Clinical disease (untreated) dD 5
Sub-patent infection dU 110
Prophylaxis following treatment dP 25
Treatment Parameters
Probability of seeking treatment if clinically diseased fT Variable
Probability of a clinical case seeking treatment, who is only infected with
pfhrp2-deleted mutants, producing a positive RDT result.
" 0 or 0.25
Infectiousness to mosquitoes
Lag from parasites to infectious gametocytes dg 12 days
Untreated disease cD 0.0680 day 1
Treated disease cT 0.0219 day 1
Sub-patent infection cU 0.000620 day 1
Parameter for infectiousness of state A g1 1.824 Age and heterogeneity
Age-dependent biting parameter 0.85 Age-dependent biting parameter a0 8 years
Daily mortality rate of humans 0.000130 Variance of the log heterogeneity in biting rates s2 1.67 Immunity reducing probability of infection
Maximum probability due to no immunity b0 0.590
Maximum relative reduction due to immunity b1 0.5
Inverse of decay rate dB 10 years
Scale parameter IB0 43.879
Shape parameter kB 2.155
Duration in which immunity is not boosted uB 7.199
Immunity reducing probability of clinical disease
Maximum probability due to no immunity f0 0.791
Maximum relative reduction due to immunity f1 0.000737
Inverse of decay rate dCA 30 years
Scale parameter IC0 18.0237
Shape parameter kC 2.370
Duration in which immunity is not boosted uC 6.0635
New-born immunity relative to mother’s PM 0.774
Inverse of decay rate of maternal immunity dM 67.695
Immunity reducing probability of detection
Minimum probability due to maximum immunity d1 0.161
Inverse of decay rate dID 10 years
Scale parameter ID0 1.578
Shape parameter kD 0.477
Duration in which immunity is not boosted uD 9.445
Immunity and detection functions
We consider three stages at which immunity may impact transmission:
1. Pre-erythrocytic immunity,IB; reduction in the probability of infection given an infectious
mos-quito bite.
2. Acquired and Maternal Clinical Immunity,ICAandICM respectively; reduction in the probability
of clinical disease given an infection due to the effects of blood stage immunity.
3. Detection immunity, ID; reduction in the probability of detection and a reduction in the
onward infectivity towards mosquitoes due to the effects of blood stage immunity.
Maternal clinical immunity is assumed to be at birth a proportion,PM, of the acquired immunity
of a 20 year-old and to decay at rate 1
dM.
The probabilities of infection, detection and clinical disease are subsequently created by trans-forming each immunity function by Hill functions. An individual’s probability of infection,bi;is given
by
bi¼b0 b1þ
1 b1
1þ IB
IB0
kB
0
B @
1
C A
whereb0 is the maximum probability due to no immunity,b0b1 is the minimum probability and
IB0andkBare scale and shape parameters respectively.
An individual’s probability of clinical disease,fi, is given by
fi¼f0 f1þ
1 f1
1þ ICAþICM
IC0
kC
0
B @
1
C A
wheref0is the maximum probability due to no immunity,f1f0 is the minimum probability and
IC0andkCare scale and shape parameters respectively.
An individual’s probability of being detected by microscopy when asymptomatic,qi;is given by
qi¼d1þ
1 d1
1þ ID
ID0
kD
fD
0
B @
1
C A
whered1 is the minimum probability due to maximum immunity, andID0 andkD are scale and
shape parameters respectively.fDis dependent only on an individual’s age is given by
dfD
da¼1
1 fD0
1þ a
aD
gD
wherefD0represents the time-scale at which immunity changes with age, andaDandgDare scale
Table 2 continued
Parameter Symbol Estimate
Time-scale at which immunity changes with age fD0 0.00706
Shape parameter relating age to immunity gD 4.818 PCR detection probability parameters state A aA 0.757 PCR detection probability parameters state U aU 0.186
Mosquito Population Model
and shape parameters respectively. Lastly,aAandaU are parameters that determine the probability
that an individual in states A and U are detectable by PCR, which are given by qaA and qaU
respectively.
The contribution made by each infected individual towards the overall infectiousness of the human population towards mosquitoes is proportional to both their infectious state and their proba-bility of detection, with a lower probaproba-bility of detection assumed to correlate with a lower parasite density. Individuals who are in state D (clinically diseased), state U (sub-patent infection) and state T (receiving treatment) contributecD,cUandcT. In stateA, infectious contribution,cA;is given bycUþ
cD CU
ð ÞqgI whereqis the probability of being detected by microscopy when asymptomatic, andg
I
is a parameter that controls how quickly infectiousness falls within the asymptomatic state.
Stochastic model equations
Given the definitions above, the full stochastic individual-based human component of the model can be formally described by its Kolmogorov forward equations. As before, letiindex individuals in the population. Then the state of individualiat time tis given by fj;k;tk;l;tl;m;tm;cm;a;tg, whereais
age,jrepresents infection status (S;D;A;U; T orP),kis the level of infection-blocking immunity and
tk is the time at which infection blocking immunity was last boosted. Similarly, landtl denote the
level and time of last boosting of clinical immunity, respectively, whilemandtmdo likewise for
para-site detection immunity, andcmrepresents maternal immunity. Letdp;q denote the Kronecker delta
(dp;q¼1 if p¼q and 0 otherwise) and dð Þx denote the Dirac delta function. Defining
Pi(j;k;tk;l;tl;m;tm;cm;a;t) as the probability density function for individual i being in state
j;k;tk;l;tl;m;tm;cm;a;t
f gat timet, the time evolution of the system is governed by the following for-ward equation:
qPiðj;k;tk;l;tl;m;tm;cm;a;tÞ
qt þ
qPiðj;k;tk;l;tl;m;tm;cm;a;tÞ
qa ¼ (1)
dj;S½rPPiðP;k;tk;l;tl;m;tm;cm;a;tÞ þrUPiðU;k;tk;l;tl;m;tm;cm;a;tÞ (2)
þdj;A½rDPiðD;k;tk;l;tl;m;tm;cm;a;tÞ (3)
þdj;U½rAPiðA;k;tk;l;tl;m;tm;cm;a;tÞ (4)
þdj;P½rTPiðT;k;tk;l;tl;m;tm;cm;a;tÞ (5)
þð1 biÞhiðt dEÞdj;Sþdj;Dþdj;Aþdj;U
ObPiðj;k;tk;l;tl;m;tm;cm;a;tÞ (6)
þbihiðt dEÞ dj;Að1 fiÞ þdj;Dfið1 "ifTÞ þdj;Tfi"ifT
ObOcObPj02fS;A;UgPi j
0
;k;tk;l;tl;m;tm;cm;a;t
(7)
þbihiðt dEÞ þdj;Dfið1 "ifTÞ þdj;Tfi"ifT
ObOcOdPi D;k;tk;l;t;m;tm;cm;a;t
(8)
þ rBk
q
qkþrCAl
q
qlþrIDm
q
qmþrCMcm
q
qcm
Piðj;k;tk;l;tl;m;tm;cm;a;tÞ (9)
þdð Þad tkþTbig
d tlþTbig
d tmþTbig
dj;Sdk;0dl;0dm;0
j0
P
Piðj0;k;tk;l;tl;m;tm;cm;a;tÞ (10)
½þrPdj;PþrUdj;UþrDdj;DþrAdj;AþrTdj;P
þhiðt dEÞ½dj;Sþdj;Dþdj;Aþdj;UPi j;k;tk;l;t;m;tm;cm;a;t
Here Ob, Ocand Odare commutative integral operators with the following action on an arbitrary
densityf jð;k;tk;l;tl;m;tm;cm;a;tÞ:
Obf¼ dðt tkÞ
Z ¥
0
f jð ;k 1;t uB t;l;tl;m;tm;cm;a;tÞdtþ t tk
uB
f jð;k;tk;l;tl;m;tm;cm;a;tÞ
Ocf¼ dðt tlÞ
Z ¥
0
f jð;k;tk;l 1;t uC t;m;tm;cm;a;tÞdtþ
t tl
uC
f jð ;k;tk;l;tl;m;tm;cm;a;tÞ
Odf¼ dðt tmÞ
Z ¥
0
f jð ;k;tk;l;tl;m 1;t uD t;cm;a;tÞdtþ
t tm
uD
f jð ;k;tk;l;tl;m;tm;cm;a;tÞ:
Finally,ð Þx is an indicator function such thatð Þ ¼x 1ifx<1and 0 otherwise. These functions allow the fixed periods of time in which immunities are not boosted after a previous boost to be included within the stochastic equations, while also allowing superinfection events to be incorporated.
For simulation, a discrete time approximation of this stochastic model was used, with a time-step of 1 day. For each individualk,landmare set to zero at birth, whiletk,tlandtm are set to a large
negative value Tbig (to represent never having been exposed or infected). Each immunity term
increases by 1 for an individual whenever that individual receives an infectious bite (k), or is infected (landmÞ, if the previous boost tok,landmoccurred more thanuB,uC and uDdays earlier,
respec-tively. Immunity levels decay exponentially at raterB,rCA and rID, whererB,rCA andrID are equal
to 1
dB, 1
dCAand 1
dIDrespectively.
The stochastic model equations detailed above can be explained as follows. The first line is the total time derivative ofPi(j;k;tk;l;tl;m;tm;cm;a;t). The next four lines describe the flows into states S,
A, U and P due to progression through infection states.
The sixth line describes exposure to malaria that boosts pre-erythrocytic immunity but does not lead to an infection. The first term within the commutative integral operator Obhere considers the
density of individuals who are in immunity classk-1 and whose last boost to their pre-erythrocytic immunity was more thanuBdays earlier, and thus will be flowing into the considered density,k, from
a lower pre-erythrocytic immunity. The second term in the integral will equate to 1 when considering individuals who are in immunity classkand whose last boost to their pre-erythrocytic immunity was less thanuBdays earlier and thus do not see their immunity boosted and hence remain in class k.
This is needed to represent the current density of individuals in the considered density. There is no term for individuals in immunity classkwhose last boost to their pre-erythrocytic immunity occurred more thanuB days earlier as they would move out of the considered density (into classk+ 1) and
hence the indicator function will equate to 0 for these individuals.
The seventh line describes exposure events occurring to individuals in states S, A and U which do result in patent (blood-stage) infection, resulting in transition into states A, D or T. The force of infec-tion acting on the density in state D is not included here but rather in the eighth line since these indi-viduals may only move to states T or D and not A. In both the seventh and eighth lines, the commutative operators here function as described earlier. This tracks the density of individuals in immunity states one lower whose last boost to any of the three immunity types occurred a sufficient number of days earlier to flow into the considered density, while also considering the individuals already at the same immunity as the considered density to remain in their current combined infec-tion/immunity state (when the indicator function equates to 1) or to move to a new infection/immu-nity state (when the indicator function equates to 0).
The ninth line (effectively a first order wave equation) represents deterministic exponential decay of the four different types of immunity. The tenth line represents the birth process. We assume a constant population size, so upon death, individuals flow into the state with no immunity and last immunity boosting times are set to Tbig, chosen to be sufficiently early to allow immediate boosting
Mosquito population dynamics
The adult stage of mosquito development was modelled in a compartmental formulation. Suscepti-ble adult mosquitoes (SM) become infected at a rate which is proportional to the infectiousness of the human population lagged bydg days, which represents the delay from emergence of asexual
blood-stage parasites to sexual gametocytes that contribute towards onward infectivity. The force of infection towards mosquitoes on a given day,LM;is represented by the sum of the contributions
from each infected human, delayed bydg, towards the overall infectiousness of the human
popula-tion, which is given by
LM¼
ak N
P
SD i¼1
zi icDþP
ST i¼1
zi icTþP
SA i¼1
zi icAþP
SU i¼1
zi icU
t dg
ð Þ
Infected mosquitoes then pass through a latent stage (EM) of durationdEM; before becoming
infectious to humans (IM). Infectious mosquitoes remain infectious until they die. The differential equations governing the adult stage of mosquitoes are given by
dSM
dt ¼MMv MSM LMSM
dEM
dt¼LMSM MEM LMðt dEMÞSMðt dEMÞexpM dEM dIM
dt¼LMðt dEMÞSMðt dEMÞexpM dEM MIM
whereM is the daily death rate of adult mosquitoes, andMvis the total mosquito population, i.e.
SMþEMþIM.
PfHRP2 dynamics
Individuals that are newly infected receive either apfhrp2-deleted mutant or a wild type, determined probabilistically by the ratio ofpfhrp2-deleted mutants in the contribution to onwards infectiousness governed by the human infectious population delayed by dEM. An individual with clinical disease (state D), who possesses an equal number of wild type andpfhrp2-deleted mutants will for example contribute ½cDto both the wild type and the mutant profile of the onwards infectiousness to mos-quitos. In simulations incorporating a fitness cost associated withpfhrp2-deletion the contribution terms (cD, cT, cA and cU) required to calculate the contribution to the human infectious reservoir made by the deletion strains are comparatively decreased relevant to the wild type strains in order to represent an assumed decrease in parasitaemia and onward transmission. This effect would also capture if thepfhrp2-deleted strain is comparatively less fit within the mosquito. This would be of importance when considering blood meals taken by mosquitoes feeding on polyclonally infected individuals, in which we would expect the fitter wild-type parasite to be probabilistically more likely to be onwardly transmitted.
If a newly infected individual is only infected withpfhrp2-deleted mutants the probability that they enter the treated class is"fT, where"is equal to the cross reactivity contribution of PfHRP3
epit-opes. If, however, they contain any wild type strains,"is assumed to always equal 1. Additionally, if a subpatent individual is superinfected resulting in clinical disease,"is assumed to equal the cross reactivity contribution of PfHRP3 epitopes if the acquired strain from superinfection is
pfhrp2-deleted. Analogously,"is assumed to always equal 1 if the acquired strain was wild type. This is to reflect the inability of RDTs to detect any of the strains that were previously present within the sub-patent individual.
Individuals that clear infection lose all strains, and infected individuals clear a random strain at ratenrC, wherenis the total number of strains andrC is the rate at which one strain is cleared in a
monoinfected individual, that is 1
dAþdU. This introduces a carrying capacity on the number of strains
Model code availability and parameter values
The model code was developed using the R language (RRID:SCR_001905), (R Core Team, 2016) and is available with shape files and plotting scripts through an open source MIT license athttps://
github.com/OJWatson/hrp2malaRia(Watson, 2017). A copy is archived at
https://github.com/elifes-ciences-publications/hrp2malaRia. The model is also written out in full as a pseudocode model using
mathematical syntax (Supplementary file 1). Parameter estimates used within the model were taken fromGriffin et al. (2014), (2015) and (Griffin et al., 2016) however have been included inTable 2 for clarity.
Characterising the epidemiological and clinical drivers of selection for
pfhrp2
-deletion
The rate ofpfhrp2-deleted mutant emergence after the introduction of RDTs was examined across a range of malaria transmission intensities (10%, 25% and 60% parasite prevalence across all ages [PfPR]) and starting proportions ofpfhrp2-deleted mutants (2%, 8% and 12% mutants). For all simu-lations conducted, the proportion of clinically diseased cases seeking treatment was equal to 40% (fT= 0.4). In all simulations ten stochastic realisations of 100,000 individuals were simulated for 60 years to reach equilibrium first, before exploring different parameter settings. RDTs were then intro-duced and the proportion of strains that arepfhrp2-deleted recorded over the following 10 years. The effect of transmission intensities (0%–90% PfPR) was explored further by recording both the pro-portion of strains that are pfhrp2-deleted and the proportion of individuals only infected with
pfhrp2-deleted mutants at 5 years after RDT introduction. In these simulations PfHRP3 epitopes were assumed to never yield a positive RDT result ("= 0.0).
The rate of emergence was further examined under different assumptions about the proportion of people seeking treatment (fT= 0.2–0.6), recording the time taken for the proportion of individuals only infected with pfhrp2-deleted mutants to reach 20%. For each simulation we assumed 8% of strains carriedpfhrp2-deleted mutants prior to RDT introduction. We also considered the role that PfHRP3 antigens may have in the performance of PfHRP2-based RDTs, assuming that 25% of individ-uals only infected with pfhrp2-deleted mutants receive treatment due to the presence of PfHRP3 epitopes ("=0.25), based on an estimate of PfHRP2-based RDT cross-reactivity (Baker et al., 2005). A series of analyses were additionally conducted to characterise the impact of a number of assumptions within the model. These sensitivity analyses were conducted at 20% PCR PfPR across all ages, with the proportion of clinically diseased cases seeking treatment equal to 40% (fT= 0.4), and an assumed starting frequency ofpfhrp2-deletion equal to 10%. As before, in all simulations ten sto-chastic realisations of 100,000 individuals were simulated for 60 years to reach equilibrium first, before exploring different parameter settings.
for the fever. From this survey an age-bracketed annual rate of fever that led to treatment being sought was calculated, with smaller age brackets used at younger ages to capture the rapid change in fever rates at younger ages. This annual estimate was then scaled by 57% to represent the likely NMF rate, as estimated from a large scale estimate across Africa (Gething et al., 2010). We subse-quently incorporated this rate to explore the impact of NMF upon selection. Within these simula-tions, we assume that individuals currently treated or in prophylaxis will not receive further antimalarial treatment when presenting with a NMF. Susceptible and subpatent individuals who seek treatment due to a NMF will only receive treatment due to non-adherence to test results. Lastly, asymptomatic and diseased individuals who seek treatment due to a NMF will always receive treat-ment, unless they are monoinfected withpfhrp2-deleted parasites in which case they will only be treated due to potential PfHRP3 epitope contributions, non-adherence to RDT results or if they were diagnosed with microscopy-based diagnosis.
Estimating the starting frequency and geographic spread of
pfhrp2
-deletion
To estimate the current and future proportion ofpfhrp2-deleted mutants across SSA, we require a starting frequency of pfhrp2-deletion. We used estimates of the proportion of pfhrp2-deleted mutants (Parr et al., 2016) from the 2013–2014 DRC Demographic and Health Survey (DHS) (Meshnick et al., 2015) to infer the starting frequency before RDTs were introduced in 2010–2011, (Meshnick et al., 2015) using the weighted PCR prevalence of malaria in children aged 6–59 months (PCR PfPR 6–59 months) and the reported frequency of people seeking treatment in the 26 Divisions Provinciales de la Sante´ (DPS). The DHS survey was a nationally representative cross-sectional study of 7137 children aged 6–59 months and 783 subjects with RDT-/PCR+ results were tested using PCR assays to detect and confirmpfhrp2-deletion.
We explored 50 starting frequencies between 0.1%–10%, with an assumed probability of a clinical case seeking treatment, who is only infected withpfhrp2-deleted mutants, producing a positive RDT result (") equal to 0.25. RDTs were assumed to be introduced in 2010 except for North- and South-Kivu where the use of RDTs occurred from 2007 in the refugee camps. (Me´decins Sans Frontie`res, 2007;United Nations High Commissioner for Refugees, 2013) For each starting frequency, ten stochastic realisations of 100,000 individuals were simulated for each DPS at malaria prevalence lev-els aligned to the observed weighted PCR prevalence of malaria in children aged 6–59 months for these provinces. These simulations were run for 60 years prior to the introduction of RDTs to ensure equilibrium was reached. The output from each set of simulations at a given starting frequency was smoothed using a local regression (LOESS) model, and the starting frequency identified as the set of simulations with the smallest residual sum of squares when compared to the recorded relationship from the DHS survey. It is important to highlight that due to the non-spatial nature of the model, each geographical region simulated occurs independently to neighbouring regions, i.e. there is no spatial spread of parasites between regions. Additionally, novel mutation emergence was not mod-elled explicitly and thus stochastic loss of the pfhrp2-deletion genotype would always yield a final
pfhrp2-deletion frequency of 0%.
The estimated starting frequency was then used to simulate trends in the prevalence ofpfhrp2 -deleted mutants across SSA, exploring a range of treatment coverages and transmission intensities, with"=0.25. These simulations considered populations of 100,000 individuals that were simulated for 20 years from 2010 to 2030, with the introduction of RDTs assumed across all regions in 2010. These outputs were matched to the mean microscopy-based PfPR in 2–10 year olds (PfPR2-10) in 2010 by first administrative unit and estimates of the proportion of cases seeking treatment from
Table 3.HRP2 classifiers used in sub-Saharan Africa mapping assuming RDT introduction in 2010.
Proportion of population only infected withpfhrp2-deleted mutants Concern classifier
>20% by 2016 High
>20% by 2022 Moderate
>20% by 2030 Slight
<20% by 2030 Marginal
previously modelled estimates using the DHS and the Malaria Indicator Cluster Surveys (Cohen et al., 2012). The time taken for the proportion of infections due to only pfhrp2-deleted mutants to reach 20% was recorded and classified to map areas of HRP2 concern under four qualita-tive classifications shown inTable 3.
Additional information
Funding
Funder Grant reference number Author
Wellcome 109312/Z/15/Z Oliver John Watson National Institute of Allergy
and Infectious Diseases
5R01AI107949 Steven R Meshnick
Imperial College London Hannah C Slater Medical Research Council MR/N01507X/1 Robert Verity Department for International
Development
Azra C Ghani
National Institute of Allergy and Infectious Diseases
5T32AI007151 Jonathan B Parr
The funders had no role in study design, data collection and interpretation, or the decision to submit the work for publication.
Author contributions
Oliver J Watson, Conceptualization, Software, Formal analysis, Methodology, Writing—original draft, Writing—review and editing; Hannah C Slater, Robert Verity, Conceptualization, Formal analysis, Supervision, Methodology, Writing—review and editing; Jonathan B Parr, Conceptualization, Resources, Formal analysis, Supervision, Methodology, Writing—review and editing; Melchior K Mwandagalirwa, Steven R Meshnick, Resources, Formal analysis, Writing—review and editing; Antoi-nette Tshefu, Resources, Writing—review and editing; Azra C Ghani, Conceptualization, Resources, Formal analysis, Supervision, Methodology, Project administration, Writing—review and editing
Author ORCIDs
Oliver J Watson http://orcid.org/0000-0003-2374-0741
Decision letter and Author response
Decision letterhttps://doi.org/10.7554/eLife.25008.033 Author responsehttps://doi.org/10.7554/eLife.25008.034
Additional files
Supplementary files
.Supplementary file 1: Simulation model pseudocode. Mathematical style pseudocode description
of the simulation model.
DOI: https://doi.org/10.7554/eLife.25008.029
.Transparent reporting form
DOI: https://doi.org/10.7554/eLife.25008.031
Major datasets
Author(s) Year Dataset title Dataset URL
Database, license, and accessibility information
Bhatt S, Weiss DJ, Cameron E, Bisan-zio D, Mappin B, Dalrymple U, Battle KE, Moyes CL, Henry A, Eckhoff PA, Wenger EA, Brie¨t O, Penny MA, Smith TA, Bennett A, Yukich J, Eisele TP, Griffin JT, Fer-gus CA, Lynch M, Lindgren F, Cohen JM, Murray CLJ, Smith DL, Hay SI, Cibulskis RE, Ge-thing PW
2015 PfPR2-10 in Africa 2000-2015 http://www.map.ox.ac. uk/static/africa-now/ data_downloads/preva-lence/tables/admin1/ PfPR_population_ weighted.zip
Publicly available at the Malaria Atlas Project under a Creative Commons license (http://www. map.ox.ac.uk/)
References
Abdallah JF, Okoth S, Fontecha GA, Torres R, Banegas EI, Matute M, Bucheli S, Goldman IF, de Oliveira A, Barnwell JW, Udhayakumar V. 2015. Prevalence of pfhrp2 and pfhrp3 gene deletions in Puerto Lempira, Honduras.Malaria Journal14:19.DOI: https://doi.org/10.1186/s12936-014-0537-7
Aguile´e R, Claessen D, Lambert A. 2009. Allele fixation in a dynamic metapopulation: Founder effects vs refuge effects.Theoretical Population Biology76:105–117.DOI: https://doi.org/10.1016/j.tpb.2009.05.003
Akinyi S, Hayden T, Gamboa D, Torres K, Bendezu J, Abdallah JF, Griffing SM, Quezada WM, Arrospide N, De Oliveira AM, Lucas C, Magill AJ, Bacon DJ, Barnwell JW, Udhayakumar V. 2013. Multiple genetic origins of histidine-rich protein 2 gene deletion in Plasmodium falciparum parasites from Peru.Scientific Reports3:1–8. DOI: https://doi.org/10.1038/srep02797
Amoah LE, Abankwa J, Oppong A. 2016. Plasmodium falciparum histidine rich protein-2 diversity and the implications for PfHRP 2: based malaria rapid diagnostic tests in Ghana.Malaria Journal15:1–8.DOI: https:// doi.org/10.1186/s12936-016-1159-z
Baker J, Ho M-F, Pelecanos A, Gatton M, Chen N, Abdullah S, Albertini A, Ariey F, Barnwell J, Bell D,
Cunningham J, Djalle D, Echeverry DF, Gamboa D, Hii J, Kyaw MP, Luchavez J, Membi C, Menard D, Murillo C, et al. 2010. Global sequence variation in the histidine-rich proteins 2 and 3 of Plasmodium falciparum:
implications for the performance of malaria rapid diagnostic tests.Malaria Journal9:129.DOI: https://doi.org/ 10.1186/1475-2875-9-129
Baker J, McCarthy J, Gatton M, Kyle DE, Belizario V, Luchavez J, Bell D, Cheng Q. 2005. Genetic Diversity of
Plasmodium falciparumHistidine-Rich Protein 2 (PfHRP2) and Its Effect on the Performance of PfHRP2-Based
Rapid Diagnostic Tests.The Journal of Infectious Diseases192:870–877.DOI: https://doi.org/10.1086/432010 Berhane A, Russom M, Bahta I, Hagos F, Ghirmai M, Uqubay S. 2017. Rapid diagnostic tests failing to detect
Plasmodium falciparum infections in Eritrea: an investigation of reported false negative RDT results.Malaria Journal16:105.DOI: https://doi.org/10.1186/s12936-017-1752-9
Bhatt S, Weiss DJ, Cameron E, Bisanzio D, Mappin B, Dalrymple U, Battle KE, Moyes CL, Henry A, Eckhoff PA, Wenger EA, Brie¨t O, Penny MA, Smith TA, Bennett A, Yukich J, Eisele TP, Griffin JT, Fergus CA, Lynch M, et al. 2015. The effect of malaria control on Plasmodium falciparum in Africa between 2000 and 2015.Nature526: 207–211.DOI: https://doi.org/10.1038/nature15535
Cheng Q, Gatton ML, Barnwell J, Chiodini P, McCarthy J, Bell D, Cunningham J. 2014. Plasmodium falciparum parasites lacking histidine-rich protein 2 and 3: a review and recommendations for accurate reporting.Malaria Journal13:283.DOI: https://doi.org/10.1186/1475-2875-13-283
Cohen JM, Woolsey AM, Sabot OJ, Gething PW, Tatem AJ, Moonen B. 2012. Optimizing Investments in Malaria Treatment and Diagnosis.Science338:612–614.DOI: https://doi.org/10.1126/science.1229045
D’Acremont V, Bosman A,Global Malaria Programme W. 2013. WHO Informal Consultation on Fever Management in Peripheral Health Care Settings : A Global Review of Evidence and Practice. Malaria Policy Advisory Committee Meeting, 13-15 March 2013.
Gamboa D, Ho MF, Bendezu J, Torres K, Chiodini PL, Barnwell JW, Incardona S, Perkins M, Bell D, McCarthy J, Cheng Q. 2010. A large proportion of P. falciparum isolates in the Amazon region of Peru lack pfhrp2 and pfhrp3: implications for malaria rapid diagnostic tests.PLoS One5:e8091.DOI: https://doi.org/10.1371/journal. pone.0008091,PMID: 20111602
Gething PW, Kirui VC, Alegana VA, Okiro EA, Noor AM, Snow RW. 2010. Estimating the Number of Paediatric Fevers Associated with Malaria Infection Presenting to Africa’s Public Health Sector in 2007.PLoS Medicine7: e1000301.DOI: https://doi.org/10.1371/journal.pmed.1000301