R E S E A R C H A R T I C L E
Structural and functional changes of the visual cortex in early
Huntington
’
s disease
Emma M. Coppen
1| Jeroen van der Grond
2| Anne Hafkemeijer
2,3,4|
Jurriaan J. H. Barkey Wolf
2,5| Raymund A. C. Roos
11
Department of Neurology, Leiden University Medical Center, Leiden, the Netherlands 2
Department of Radiology, Leiden University Medical Center, Leiden, the Netherlands 3
Department of Methodology and Statistics, Institute of Psychology, Leiden University, Leiden, the Netherlands
4
Leiden Institute for Brain and Cognition, Leiden University, Leiden, the Netherlands 5
Department of Molecular Epidemiology, Leiden University Medical Center, Leiden, the Netherlands
Correspondence
E. M. Coppen, Department of Neurology (J3-R-162), Leiden University Medical Center, P.O. Box 9600, 2300 RC, Leiden,
the Netherlands. Email: [email protected]
Abstract
Huntington's disease (HD) is an autosomal-dominant inherited neurodegenerative disorder
characterized by motor disturbances, psychiatric disturbances, and cognitive impairment. Visual
cognitive deficits and atrophy of the posterior cerebral cortex are additionally present in early
disease stages. This study aimed to assess the extent of structural and functional brain
alterations of the visual cortex in HD gene carriers using different neuroimaging modalities.
Structural and functional magnetic resonance imaging data were acquired from 18 healthy
controls, 21 premanifest, and 20 manifest HD gene carriers. Voxel-based morphometry (VBM)
analysis and cortical thickness measurements were performed to assess structural changes in
the visual cortex. Brain function was measured by assessing neuronal connectivity changes in
response to visual stimulation and at rest in visual resting-state networks. Multiple linear
regres-sion analyses were performed to examine the relationship between visual cognitive function
and structural imaging measures. Compared to controls, pronounced atrophy and decreased
neuronal function at rest were present in associative visual cortices in manifest HD. The primary
visual cortex did not show group differences in cortical thickness and in vascular activity after
visual stimulation. Thinning of the associative visual cortex was related to worse visual
percep-tual function. Premanifest HD gene carriers did not show any differences in brain structure or
function compared to controls. This study improves the knowledge on posterior brain changes
in HD, as our findings suggest that the primary visual cortex remains preserved, both structurally
and functionally, while atrophy of associative visual cortices is present in early HD and linked to
clinical visual deficits.
K E Y W O R D S
brain atrophy, functional MRI, Huntington's disease, structural MRI, visual cognition, visual
cortex
1
|
I N T R O D U C T I O N
Visual processing is involved in routine daily functioning, such as
walking, driving a car, and in social communication. In the human
brain, transmission of incoming stimuli from the retina pass the
affer-ent visual pathway via the optic nerve, optic tract, lateral geniculate
nucleus in the thalamus, and optic radiation to the primary visual
(stri-ate) cortex in the occipital lobe and higher posterior cortical areas
(Prasad & Galetta, 2011). Higher level visual processing occurs in the
associative extra-striate regions surrounding the primary visual
cor-tex, from the secondary visual cortex to the ventral occipital-temporal
pathway and dorsal occipital-parietal pathway (Ungerleider & Haxby,
1994). In Huntington's disease (HD), an autosomal-dominant
inher-ited neurodegenerative disorder, progressive structural changes in
the posterior cerebral cortex can be detected in early stages of the
disease, while frontal and temporal regions remain less affected
(Johnson et al., 2015; Nana, Kim, Thu, Oorschot, & Tippett, 2014;
Nopoulos et al., 2010; Rosas et al., 2008; Rüb et al., 2015; Tabrizi
DOI: 10.1002/hbm.24322
This is an open access article under the terms of the Creative Commons Attribution License, which permits use, distribution and reproduction in any medium, provided the original work is properly cited.
© 2018 The Authors.Human Brain Mappingpublished by Wiley Periodicals, Inc.
et al., 2009). The manifest stage of HD is clinically characterized by
progressive motor disturbances such as chorea and dystonia,
cogni-tive decline, and psychiatric symptoms (Bates et al., 2015; Roos,
2010). Cognitive decline mainly involves progressive impairment in
executive function (Dumas, van den Bogaard, Middelkoop, & Roos,
2013). Nonetheless, neuropsychological studies assessing visual
cog-nitive function in HD reported impairments in several visual domains,
specifically tasks involving visual object perception (Gómez-Tortosa,
del Barrio, Barroso, & García Ruiz, 1996; Lemiere, Decruyenaere,
Evers-Kiebooms, Vandenbussche, & Dom, 2004), facial emotion
recognition (Bora, Velakoulis, & Walterfang, 2016; Kordsachia,
Labuschagne, & Stout, 2017), visuospatial processing, and visual
working memory (E. Dumas et al., 2012; Johnson et al., 2015;
Labuschagne et al., 2016).
Striatal atrophy is considered to be the origin of the characteristic
choreatic motor signs, but it is suggested that other symptoms of HD
might be related to cortical degeneration (Nana et al., 2014; Thu et al.,
2010; Waldvogel, Kim, Thu, Tippett, & Faull, 2012). Thinning of
regions in the occipital lobe has been linked to worse performance on
cognitive visuospatial tasks, which implies a distinct association
between higher level cognitive performance and occipital
degenera-tion in HD gene carriers (Johnson et al., 2015; Rosas et al., 2008).
In contrast to many structural magnetic resonance imaging (MRI)
studies that showed neurodegenerative changes of the posterior
cere-bral cortex, only one study has assessed the functional aspects of
visual brain function in HD using resting-state functional MRI (Wolf
et al., 2014). Here, functional connectivity changes were limited to
the fusiform cortex in patients with HD, despite the presence of
wide-spread posterior cortical atrophy. Still, little is known about brain
func-tion in patients with HD, and the link between structural cortical brain
changes and functional impairments has not yet been fully
investi-gated. Using different neuroimaging modalities and a visual cognitive
test battery, this study aimed to improve the understanding of
func-tional and structural alterations in the visual cortex in premanifest
individuals (i.e., before the presence of motor symptoms) and in
patients with early stage HD and investigate if there is an association
between brain changes and visual cognitive task performance.
2
|
M E T H O D S
2.1
|
Participants
A total of 59 participants (18 healthy controls, 20 premanifest HD
gene carriers, and 20 premanifest HD gene carriers) were included in
this cross-sectional, observational study (Table 1).
Individuals were recruited from the outpatient clinic of the
Neu-rology department at the Leiden University Medical Center between
January 2017 and September 2017. HD gene carriers required a
posi-tive genetic test with a cytosine, adenine, guanine (CAG) repeat
expansion of 36 or more on the Huntingtin gene. Partners and HD
gene-negative relatives were recruited as healthy controls. All
partici-pants were between 18 and 65 years of age at the time of visit. To
ensure an optimal primary visual acuity, individuals with an impaired
primary visual ability (measured as below 0.5; i.e., 20/40 vision) on the
visual acuity test or ophthalmic disorders were excluded from the
study. Other exclusion criteria were additional major comorbidities
not related to HD (including cardiovascular diseases, hypertension,
diabetes mellitus, and other neurological disorders), the inability to
undergo MRI scanning (due to metallic implants, claustrophobia, or
pregnancy), or the participation in intervention trials. The Medical
Eth-ical Committee of the Leiden University MedEth-ical Center approved this
study, and written informed consent according to the Declaration of
Helsinki was obtained from all participants.
2.2
|
Clinical assessments
Demographic information, CAG repeat length (for HD gene carriers
only), and medical history was collected. Primary visual ability was
measured with a visual acuity test. To assess the ability to perceive
color differences the Ishihara Color Test was performed. Trained
investigators assessed the degree of motor disturbances using the
Unified Huntington's Disease Rating Scale - Total Motor Score
(UHDRS-TMS), a scale that measures different domains that are
char-acteristically impaired in HD, including the oculomotor function, the
tongue protrusion, the gait and postural stability, and the presence of
choreatic or dystonic movements (Huntington Study Group, 1996).
Higher scores indicate increased motor impairment. Based on the
UHDRS-TMS, HD gene carriers were divided into 21 premanifest
indi-viduals, with a score of 5 or less, and 20 manifest indiindi-viduals, with a
score of more than 5 (Huntington Study Group, 1996). The UHDRS
Total Functional Capacity (TFC) score was administered to assess five
components of global daily functioning, including capacity to work,
management of finances, ability to perform domestic chores,
indepen-dency in activities of daily living (such as eating, bathing, and dressing),
and care environment. Here, lower TFC scores indicate more impaired
function. In manifest HD, the TFC score is used to divide participants
into disease stages, in which Stages 1 and 2 represent an early disease
stage and Stage 5 the most advanced stage (Shoulson & Fahn, 1979).
The cognitive battery used in this study consisted of specific
neu-ropsychological assessments with a large visual component. All
cogni-tive tasks were administered by certified neuropsychological
investigators and lasted approximately 30 min.
The selection of cognitive assessments was based on findings
from previous studies that focused on cognitive dysfunction in
premanifest and manifest HD gene carriers (Lawrence, Watkins,
Sahakian, Hodges, & Robbins, 2000; Lemiere et al., 2004; O'Rourke
et al., 2011; Stout et al., 2012). The symbol digit modalities test
(SDMT), stroop word reading test, and trail making test (TMT) were
administered to assess visuospatial function, such as visual scanning
and visual attention (O'Rourke et al., 2011; Smith, 1973; Stroop,
1935). Visual object perception was measured using subtests from the
visual object and space perception battery and the Groningen
intelli-gence test (Luteijn & Barelds, 2004; Warrington & James, 1991).
Indi-vidual scores on each cognitive assessment were converted to
standardized Z-scores. These Z-scores were summed and averaged
resulting in cognitive domain scores to assess overall visuospatial and
2.3
|
Image acquisition
All participants underwent structural and functional MRI scanning on
a 3.0 Tesla MRI scanner (Philips Achieva, Best, the Netherlands). Both
structural and functional MRI data were acquired using a standard
32-channel whole head coil. MRI proof glasses or lenses were used
during scanning if participants had a visual acuity below 0.5 (20/40
vision) without correction, to ensure optimal primary visual ability
dur-ing task performance. Anatomical three-dimensional T1-weighted
images were acquired with the following parameters: TE = 3.3 ms,
TR = 7.2 ms, flip angle = 9, FOV = 256 × 240 × 176 mm and
176 slices with a slice thickness of 1 mm and no gap between slices,
resulting in a voxel size of 1.00×1.00×1.00 mm, and scan duration
of 9 min. All functional blood oxygen level-dependent
(BOLD)-weighted echo-planar imaging whole brain volumes were obtained
with the following parameters: TE = 30 ms, TR = 3,000 ms, FOV =
212×198×158 mm, flip angle = 80, and 48 slices with a slice
thick-ness of 2.81 mm and slice gap of 0.5 mm, resulting in a voxel size of
3.31×3.31×2.81 mm, and scan duration of 5.42 min for the task
fMRI, and 8 min for the resting state fMRI.
2.4
|
Image processing
2.4.1
|
Structural MRI
Cortical morphology was examined using volumetric and thickness
outcome measures. Gray matter density alterations of the visual
cor-tex in premanifest and manifest HD gene carriers compared to
con-trols were examined using VBM analysis, which involves a voxel-wise
comparison of the local concentration of gray matter between groups,
including cortical surface area and cortical folding (Good et al., 2001).
In addition, to investigate subtle brain changes, the cortical thickness
of specific brain regions in the visual cortex were measured (Desikan
et al., 2006).
2.4.2
|
Voxel-based morphometry
To assess structural voxel-wise gray matter density differences of the
visual cortex between groups, we used a standardized VBM analysis
protocol (Good et al., 2001), using the FMRIB's Software Library (FSL,
version 5.0.10, Oxford, United Kingdom) tools (Douaud et al., 2007;
Smith et al., 2004). First, nonbrain tissue from all T1-weighted images
was removed using the semiautomated brain extraction tool (Smith,
2002). Then, these brain-extracted images were segmented into
different tissue types (i.e., gray matter, white matter, and
cerebrospi-nal fluid). Quality control was performed on the brain extraction and
gray matter segmentation images, and no data were excluded for
fur-ther analyses. The gray matter images were aligned to the 2 mm
Mon-treal Neurological Institute (MNI)-152 standard space image, using
nonlinear registration (Andersson, Jenkinson, & Smith, 2007;
Jenkin-son, Bannister, Brady, & Smith, 2002). An averaged study-specific 4D
template was subsequently created. Then, all native gray matter
images were nonlinear registered to this study specific template and
modulated to correct for local enlargements and contractions due to
the nonlinear component of the spatial transformation (Good et al.,
2001). Finally, the modulated gray matter images were smoothed with
an isotropic Gaussian kernel with a sigma of 3 mm, which corresponds
to a full width at half maximum (FWHM) smoothing kernel of 7 mm.
2.4.3
|
Cortical thickness
Cortical thickness of specific regions of interest was measured using
cortical parcellation implemented in FreeSurfer version 5.3.0 (Fischl &
Dale, 2000). The FreeSurfer algorithm automatically parcellates the
cortex and assigns a neuroanatomical label to each location on a
corti-cal surface model, based on probabilistic information. Four occipital
regions (lingual gyrus, pericalcarine cortex, cuneus, and lateral occipital
cortex), one parietal region (superior parietal cortex), and three
tempo-ral regions (tempotempo-ral pole, fusiform gyrus, inferior tempotempo-ral gyrus)
defined by the Desikan–Killiany atlas were selected for further
ana-lyses (Desikan et al., 2006), because these regions are all involved in
the processing of visual stimuli (Prasad & Galetta, 2011). As there
were no differences in cortical thickness between left and right
hemi-sphere for any cortical region in our cohort, thickness was averaged
across the two hemispheres for each region (see Supporting
Informa-tion Table S1).
2.4.4
|
Functional MRI
Alterations in brain function were assessed using task-based and
resting-state fMRI. For the task-based fMRI, changes in BOLD signal
in response to a visual stimulus were calculated as a proxy for cortical
neuronalconnectivity(A. Dumas et al., 2012). In addition, brain
func-tion at rest was examined using resting-state funcfunc-tional connectivity
analysis with predefined visual resting-state networks of interest
(NOI; Beckmann, DeLuca, Devlin, & Smith, 2005).
2.4.5
|
Task design
The visual stimulus for the task-based fMRI scan consisted of seven
blocks with an 8 Hz flashing black-and-white checkerboard pattern
for 20 s, followed by 28 s of a gray screen with a red dot in the center
of the screen. The visual stimuli were projected onto a screen, which
the participant observed through a mirror attached to the head coil.
To maintain attention and fixation to the checkerboard, each
partici-pant was asked to push on a button when the red dot position in the
center of the screen changed from lighter to darker red, occurring at
random intervals throughout the stimulus run. For the resting-state
fMRI measures, participants were asked to close their eyes, not to fall
asleep, and not to speak during the complete scanning time.
2.4.6
|
Preprocessing
All functional images were pre-processed using the FEAT tool
imple-mented in FSL (Smith et al., 2004). Pre-processing steps included
motion correction, (Jenkinson et al., 2002) spatial smoothing using a
Gaussian kernel of 8 mm FWHM, high-pass temporal filtering (with a
cutoff of 48 s for task-fMRI images, and 100 s for resting-state fMRI
images), and distortion correction of B0 inhomogeneity's. The
prepro-cessed functional images were nonlinear registered to individual
brain-extracted T1-weighted scans, which were registered to
MNI-152 standard space with boundary-based-registration (Jenkinson
2.4.7
|
Vascular reactivity
Preprocessed task-based functional MRI scans were further processed
to measure cortical vascular reactivity in response to visual
stimula-tion. For this analysis, BOLD timeseries had to be extracted from the
preprocessed scans. To this end, a region of interest (ROI) was created
for each participant based on the results of an initial subject-level
analysis. During this subject-level analysis, brain regions were
identi-fied that reacted to the stimulus train using the general linear
model-ing approach implemented in FSL's FEAT (Smith et al., 2004). The
degree to which each voxel responded to the stimulus train was
expressed in a Z-statistic map.
To obtain the functional ROI for each participant, a binary mask
was constructed by taking the top 20% most activated voxels from
this Z-statistic activation map. Using this mask, an average BOLD
timeseries was calculated for each participant by averaging across all
masked voxels. The resulting timeseries was cut up into blocks that
each contained stimulus period (20 s) and a subsequent rest period
(28 s). Then, the timeseries of each block were expressed as
percent-age BOLD change using the mean value of all blocks. To minimize the
effect of nonphysiologic noise on the block response, blocks with a
percentage BOLD change greater than 3% were discarded.
Based on the method previously described by A. Dumas
et al. (2012), a trapezoidal function was fit to the vascular reactivity
response (i.e., percentage BOLD signal change) in the average BOLD
timeseries, to describe the time-to-peak response, time-to-baseline
and amplitude of the response. The time-to-peak was calculated from
the beginning of the block att= 0 to onset of the trapezoid ceiling.
The time-to-baseline is defined as the duration from the end of the
stimulus att= 20 s to the baseline. Response amplitude was defined
as the distance from baseline to the peak response. The entire
algo-rithm described above was implemented in R (the R foundation for
Statistical Computing, Vienna, Austria), version 3.4.2. The full source
code, along with additional mathematical details, has been published
on GitHub (https://github.com/jjhbw/TrapFit/).
2.4.8
|
Functional connectivity
After preprocessing of the functional resting state images,
indepen-dent component analysis-based automated removal of motion
arti-facts was used as a data-driven method to identify and remove
motion-related independent components from our resting state fMRI
data (Pruim et al., 2015). Then, functional connectivity analysis was
performed using the dual regression method implemented in FSL,
previously described by Filippini et al. (2009) and Hafkemeijer
et al. (2015).
For the dual regression method, we used standardized resting
state NOI to measure functional connectivity as BOLD signal changes
in the brain in relation to similar alterations in predefined resting state
networks (Beckmann et al., 2005). As we focused on the visual cortex,
we used two templates of standardized resting state networks,
namely the medial visual network (including the calcarine sulcus,
pre-cuneus, lateral geniculate nucleus, and primary visual cortex) and the
lateral visual network (including the occipital pole, lateral occipital
cor-tex, fusiform areas, and superior parietal regions; Beckmann et al.,
2005). To account for noise, white matter and cerebrospinal fluid
tem-plates were also included in the analyses (Birn, 2012).
2.4.9
|
Statistical analysis
Group differences in demographic and clinical outcome measures
were analyzed using ANOVA,χ2test, and Kruskal–Wallis test when
applicable for continuous, categorical and skewed data respectively.
Analysis of Covariance (ANCOVA), with group as factor and a simple
contrast, was used to analyze differences in cortical thickness,
task-based fMRI response parameters and cognitive task performance in
premanifest and manifest HD compared to controls. Age, gender, and
years of education were included as covariates. Multiple linear
regres-sion analyses in HD gene carriers (i.e., premanifest and manifest HD)
were performed to assess the relationship between neuroimaging
(dependent variable) and cognitive outcome measures (independent
variable), adjusted for age, gender, years of education, and CAG repeat
length. All independent variables were entered in one block. Separate
linear regression models were used for each neuroimaging measure.
An alpha-level of <0.05 was used to determine significance. To
account for multiple comparisons in this analysis, an adjustedpvalue
was set based on the number of comparisons made for the analysis.
Statistical analyses were performed using the Statistical Package for
Social Sciences (SPSS for Mac, version 23, SPSS Inc.).
For the structural VBM and resting state functional connectivity
data, statistical analyses to detect group differences between controls,
and premanifest and manifest HD were performed using a general
lin-ear model in FSL with age and gender as covariates. FSL-randomize
was used for voxel-wise nonpermutation testing with 5,000
permuta-tions (Winkler, Ridgway, Webster, Smith, & Nichols, 2014). For the
VBM analysis, a binary mask of the visual cortex extracted from the
MNI-152 standard space image was used. For the functional
connec-tivity analysis, analyses of varianceF tests were first performed to
assess if the group averages accounted for a significant effect in each
NOI. Then, two-samplettests were applied to obtain specific group
differences (i.e., an increase or decrease) in functional connectivity. To
account for the potential effects of local structural gray matter
differ-ences within and between the groups, individual gray matter density
maps were used as additional voxel-dependent covariate in the
statis-tical design. The threshold-free cluster enhancement (TFCE) technique
was used to correct for multiple comparisons across voxels with
fam-ily wise error (Smith & Nichols, 2009), with a significantpvalue of
<0.05 as significant threshold. Brain structures that showed a
signifi-cant difference between groups were identified on the TFCE-statistic
image using the Harvard–Oxford atlas and the cluster tool integrated
in FSL.
3
|
R E S U L T S
3.1
|
Clinical characteristics
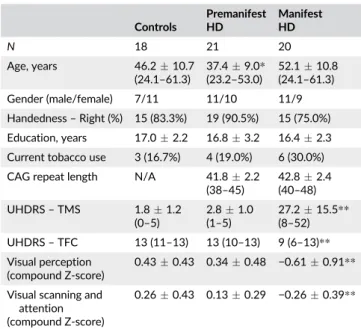
Demographic group characteristics are displayed in Table 1. Based on
their functional capacity, manifest HD were in an early to moderate
disease stage (4 patients in Stage 1, 15 patients in Stage 2, and
There were no significant group differences for gender,
handed-ness, education level, and use of tobacco. CAG repeat length did not
differ between premanifest and manifest HD. Premanifest HD were
younger (F[2,56] = 10.90) compared to controls (p= .028) and
mani-fest HD (p< .001). Furthermore, manifest HD had a higher
UHDRS-TMS compared to controls and premanifest HD (F[2,56] = 49.41, both
p< .001) and a lower UHDRS-TFC score compared to controls and
premanifest HD (H[2] = 41.24, p< .001). On all visuospatial and
visual perceptual tasks, manifest HD performed worse compared to
controls. There were no significant differences in cognitive task
per-formance between controls and premanifest HD.
3.2
|
Structure of the visual cortex
3.2.1
|
Voxel-based morphometry
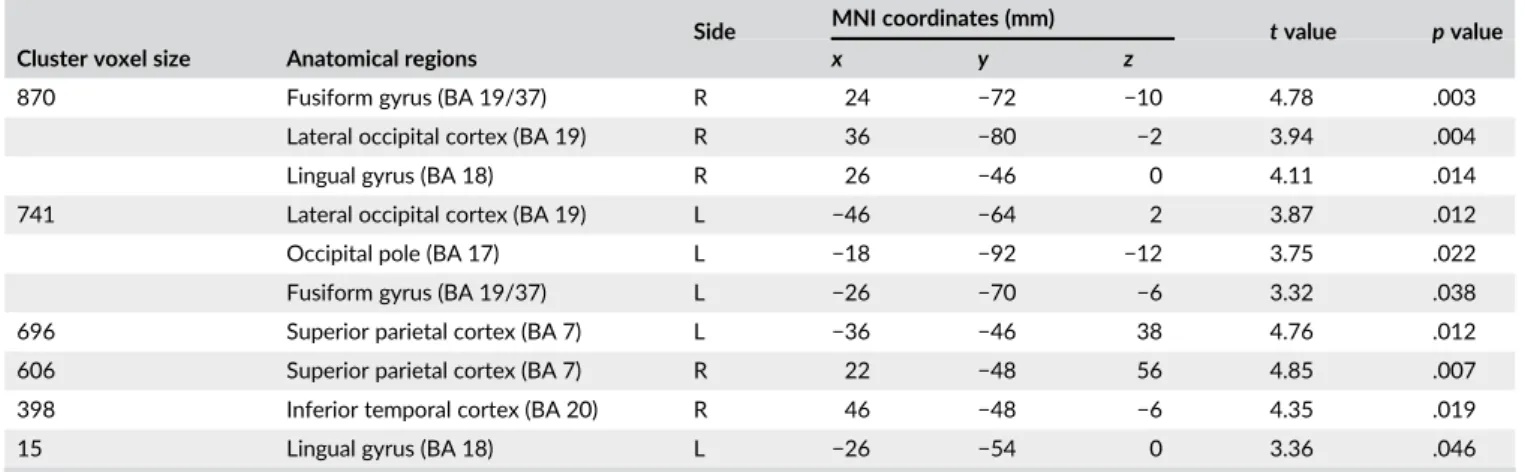
Regional VBM analysis of the visual cortex was used to assess gray
matter volume differences between groups. In manifest HD,
signifi-cant cortical volume loss was identified bilateral in the fusiform gyrus,
lingual gyrus, lateral occipital cortex and superior parietal cortex
(Figure 1 and Table 2). Furthermore, the left occipital pole and right
inferior temporal cortex showed volume loss in manifest HD
com-pared to controls. No significant differences in gray matter volume
were found between controls and premanifest HD.
3.2.2
|
Cortical thickness
To determine subtle cortical changes in the visual cortex, the cortical
thickness of eight regions of interest (cuneus, fusiform gyrus, inferior
temporal cortex, lateral occipital cortex, lingual gyrus, pericalcarine
FIGURE 1 Gray matter volume loss in the visual cortex in manifest HD. VBM analysis. The significant family-wise-error corrected gray matter differences between manifest HD and controls (p< .05) are presented in red-yellow, overlaid on sagittal, coronal, and transversal slices of Montreal-neurological-Institute-152 standard T1-weighted images. Green: Mask of visual cortex. Correspondingx,y, andzcoordinates are given [Color figure can be viewed at wileyonlinelibrary.com]
TABLE 1 Demographic and clinical characteristics
Controls
Premanifest HD
Manifest HD
N 18 21 20
Age, years 46.210.7 (24.1–61.3)
37.49.0* (23.2–53.0)
52.110.8 (24.1–61.3)
Gender (male/female) 7/11 11/10 11/9
Handedness–Right (%) 15 (83.3%) 19 (90.5%) 15 (75.0%)
Education, years 17.02.2 16.83.2 16.42.3
Current tobacco use 3 (16.7%) 4 (19.0%) 6 (30.0%)
CAG repeat length N/A 41.82.2 (38–45)
42.82.4 (40–48)
UHDRS–TMS 1.81.2 (0–5)
2.81.0 (1–5)
27.215.5** (8–52)
UHDRS–TFC 13 (11–13) 13 (10–13) 9 (6–13)**
Visual perception (compound Z-score)
0.430.43 0.340.48 −0.610.91**
Visual scanning and attention (compound Z-score)
0.260.43 0.130.29 −0.260.39**
Abbreviations: N/A = Not applicable; CAG = Cytosine, Adenine, Guanine; UHDRS-TFC = Unified Huntington'’s Disease Rating Scale Total Func-tional Capacity; UHDRS-TMS = Unified Huntington's Disease Rating Scale Total Motor Score. Data are meanSD (range) for age, CAG repeat length, years of education, and UHDRS-TMS. Numbers (%) are presented for handedness and tobacco use. Median (range) is given for UHDRS-TFC. Compound standardized Z-scores on visual cognitive tasks were calcu-lated. Scaled Z-scores were summed and averaged resulting in Z-scores per visual cognitive domain. Mean Z-scoresSD per domain are pre-sented. ANCOVA with group as simple contrast was used to assess differ-ences in Z-scores compared to controls, with age, gender, and years of education as covariates.
*Significant different compared to controlsp< .05.
cortex, superior parietal cortex, and temporal pole) were additionally
measured. Except for the pericalcarine cortex and temporal pole,
sig-nificant cortical thinning was present in manifest HD in the cuneus,
fusiform, and lingual gyri, and inferior temporal, lateral occipital and
superior parietal cortices compared to controls (Table 3). Premanifest
HD did not show any significant differences in cortical thickness for
all regions of interest compared to controls.
Multiple linear regression analysis was performed to assess the
relationship between cortical thickness and cognitive function in HD
gene carriers (i.e., both premanifest and manifest HD). Besides the
inferior temporal cortex, all regions showed significant associations
with visual perceptual function, in which a decrease in cortical
thick-ness was associated with worse cognitive function (Table 4).
Visuo-spatial function was not related with changes in cortical thickness.
The pericalcarine cortex and temporal pole were not included in these
analyses as there were no significant group differences in cortical
thickness.
The multiple linear regression analysis was subsequently
per-formed in the manifest HD group. Significant associations were found
between visual perceptual function and thickness of the fusiform
gyrus (B= 0.136, SE= 0.036, p< .002) and lateral occipital cortex
(B= 0.145,SE= 0.038,p< .002), corrected for multiple comparisons.
There was no significant association between visuospatial function
and cortical thickness.
3.3
|
Function of the visual cortex
3.3.1
|
Vascular reactivity
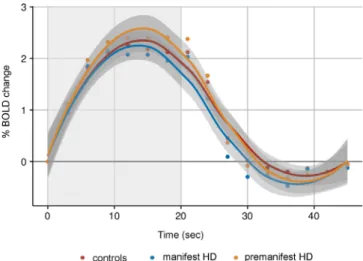
Vascular brain function of the visual cortex was examined by
quantify-ing alterations in BOLD signal in response to visual stimulation.
Rela-tive to baseline (i.e., prior to the start of the stimulus), there were no
significant group differences in changes of the average BOLD
response for the time to peak, time to baseline and amplitude
response (Figure 2).
3.3.2
|
Functional connectivity
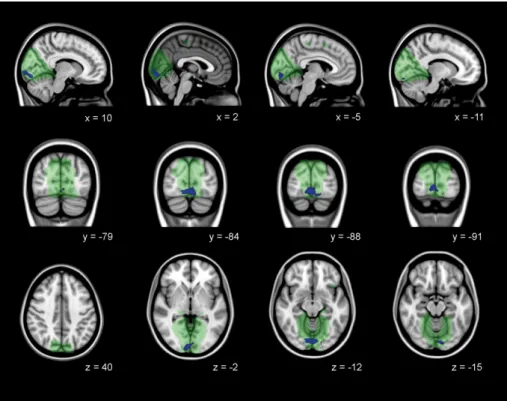
Brain function at rest was assessed to detect disease specific
func-tional connectivity network changes within the medial visual network
and lateral visual network. Decreased functional connectivity between
the bilateral lingual gyrus, occipital pole, and occipital fusiform gyrus
and the medial visual network was present in manifest HD compared
to controls, independent of local gray matter atrophy (Figure 3 and
TABLE 2 Gray matter volume loss in the visual cortex in manifest HD
Cluster voxel size Anatomical regions
Side MNI coordinates (mm) tvalue pvalue
x y z
870 Fusiform gyrus (BA 19/37) R 24 −72 −10 4.78 .003
Lateral occipital cortex (BA 19) R 36 −80 −2 3.94 .004
Lingual gyrus (BA 18) R 26 −46 0 4.11 .014
741 Lateral occipital cortex (BA 19) L −46 −64 2 3.87 .012
Occipital pole (BA 17) L −18 −92 −12 3.75 .022
Fusiform gyrus (BA 19/37) L −26 −70 −6 3.32 .038
696 Superior parietal cortex (BA 7) L −36 −46 38 4.76 .012
606 Superior parietal cortex (BA 7) R 22 −48 56 4.85 .007
398 Inferior temporal cortex (BA 20) R 46 −48 −6 4.35 .019
15 Lingual gyrus (BA 18) L −26 −54 0 3.36 .046
Abbreviations: BA = Brodmann area; R = right hemisphere; L = left hemisphere. Voxel-wise identified regions of significant cortical volume loss in manifest HD compared to controls. All anatomical regions were identified using the Harvard–Oxford Subcortical and Cortical atlases and the cluster tool implemen-ted in FSL. T-statistics and correspondingpvalues are presented (with a TFCE-family wise correctedpvalue ofp< .05).
TABLE 3 Cortical thickness in visual cortical regions
Controls Premanifest HD Manifest HD
Premanifest HD versus controls Manifest HD versus controls Estimated difference
[95% CI] pvalue
Estimated difference
[95% CI] pvalue
Cuneus 1.950.14 1.930.13 1.820.15 −0.05 [−0.14, 0.05] 0.344 −0.13 [−0.23,−0.04] .005 Fusiform gyrus 2.710.16 2.720.11 2.550.21 −0.03 [−0.15, 0.08] 0.539 −0.14 [−0.25,−0.04] .010 Inferior temporal cortex 2.700.13 2.730.13 2.580.18 −0.02 [−0.12, 0.09] 0.760 −0.10 [−0.20,−0.01] .039 Lateral occipital cortex 2.110.13 2.170.11 1.990.22 0.02 [−0.09, 0.13] 0.750 −0.11 [−0.21, 0.00] .048 Lingual gyrus 2.100.16 2.080.09 1.960.18 −0.07 [−0.17, 0.02] 0.143 −0.14 [−0.23,−0.05] .004 Pericalcarine cortex 1.740.16 1.710.13 1.670.16 −0.06 [−0.16, 0.05] 0.287 −0.06 [−0.16, 0.04] .233
Superior parietal cortex 2.210.16 2.190.10 2.020.19 −0.07 [−0.17, 0.03] 0.178 −0.18 [−0.27,−0.08] <.001 Temporal pole 3.600.36 3.770.21 3.590.40 0.15 [−0.08, 0.38] 0.206 0.02 [−0.21, 0.25] .854
Table 5). No differences in functional connectivity with the medial
visual network were observed between premanifest HD and controls.
In addition, there were no group differences in lateral visual network
functional connectivity.
4
|
D I S C U S S I O N
This study showed that changes in the visual cortex and visual
cogni-tive deficits are present in early manifest HD gene carriers, but not in
premanifest gene carriers.
The most pronounced volume loss and cortical thinning in
mani-fest HD was found in the associative visual cortices, namely the
lin-gual and fusiform gyri and lateral occipital cortex. Thinning of these
cortical regions in the ventral occipital-temporal pathway was
associ-ated with impaired visual perceptual function (i.e., object recognition
tasks), suggesting that the neurodegenerative processes in the cortex
might play a role in the visual deficits found in HD. Interestingly, the
primary visual cortex (i.e., pericalcarine region and occipital pole) did
not show neurodegenerative alterations and neuronal activity after
visual stimulation also did not differ between groups, which suggest
that basic visual processing remains preserved in early stages of the
disease.
Our findings that cortical morphology of the primary visual cortex
in early HD remained unaffected is in line with other studies that did
not found atrophy of the primary visual cortex in both early and
advanced disease stages (Johnson et al., 2015; Nana et al., 2014;
Nopoulos et al., 2010). Still, our study is the first study that provides
evidence of preserved basic visual processing function in early stages
of HD using task-based fMRI that involved a black-and-white
check-erboard stimulus. The BOLD response to visual stimulation in the
pri-mary visual cortex was not different from controls in both manifest
and premanifest HD, which suggests that incoming stimuli from the
optic radiation and lateral geniculate nucleus in the thalamus are
prop-erly received and transmitted by the primary visual cortex to higher
visual cortical areas.
TABLE 4 Assoc iations betwe en cor tical thick ness and vis ual cogn itive task perfo rmance in HD gene carrier s Cuneus Fusiform gyrus Inferior temporal cortex Lateral occipital cortex Lingual gyrus Superior parietal cortex BS E η 2 pB SE η 2 pB SE η 2 pB SE η 2 pB SE η 2 pB SE η 2 p Visual perception (compound Z-score) 0.111 0.027 0.33 <.001 0.106 0.027 0.28 <.001 0.075 0.031 0.10 .020 0.130 0.030 0.39 <.001 0.097 0.022 0.24 <.001 0.130 0.027 0.57 <.001 Visual scanning and attention (compound Z-score) 0.008 0.062 0.05 .893 0.061 0.060 0.01 .314 0.082 0.061 0.00 .185 0.022 0.069 0.04 .752 0.057 0.051 0.00 .275 0.008 0.065 0.03 .908 Unstandardized Beta ( B ), Standard Error ( SE ), and partial eta squared ( η 2) are presented adjusted for age, gender, years of education, and CAG. Unstandardized Beta represents change in cortical thickness (mm) for every 1-point change in Z-score for each cognitive domain. Significant p values ( p < .004) are presented in bold.
In general, visual stimuli that are received by the primary visual
cortex (V1) are then projected to the secondary visual cortex (V2),
which plays a role in the color perception and orientation (Tootell,
Tsao, & Vanduffel, 2003). Then, visual processing proceeds along the
associative cortices, which can be divided into the ventral
occipito-temporal pathway (V4) involved in color processing and the
recogni-tion of objects and shapes, and the dorsal occipito-parietal pathway
(V3 and V5), involved in the processing of spatial information and
movement perception (Kravitz, Saleem, Baker, Ungerleider, & Mishkin,
2013; Ungerleider & Haxby, 1994).
Visual scanning, attention, and visual object and shape
recogni-tion was measured using visuospatial and visual perceptual tasks
respectively. Manifest HD gene carriers showed impairments in these
domains, but only visual perceptual function was associated with
cor-tical thickness. The SDMT and TMT were used to measure
visuospa-tial function, as these tasks require visual scanning and attention skills
(O'Rourke et al., 2011; Smith, 1973). However, these tasks also
require a high motor demand and processing speed, which are known
to be impaired in patients with HD. This might explain that no
signifi-cant relationship was found between visuospatial task performance
and thickness of the visual cortex.
The secondary visual cortex is located in the cuneus and lingual
gyrus, which is involved in color discrimination and visual working
memory (Tootell et al., 2003). From here, stimuli proceed towards the
fusiform gyrus and lateral occipital cortex that are known to play a
role in object and face recognition (Grill-Spector, Kourtzi, &
Kanw-isher, 2001; KanwKanw-isher, Mcdermott, & Chun, 1997). This supports our
findings that an impaired visual perceptual function in HD was
associ-ated with reduced cortical thickness in these regions.
Other studies reported similar findings in early manifest HD, such
as a reduced nerve cell number in the secondary visual cortex (Nana
et al., 2014), volume loss of the occipital lobe (Tabrizi et al., 2009;
Wolf et al., 2014), and thinning of the cuneus, lingual gyrus, and lateral
occipital cortex that were associated with worse performance on
cog-nitive tasks involving a visual component (Johnson et al., 2015; Rosas
et al., 2008). Contrary to our findings, thinning and volume loss of the
occipital lobe has also been observed in premanifest HD gene carriers
(Johnson et al., 2015; Nopoulos et al., 2010; Rosas et al., 2005; Tabrizi
et al., 2009). This process seems to occur in premanifest HD gene
FIGURE 3 Decreased functional connectivity in medial visual network in manifest HD. Decreased functional connectivity independent of gray matter atrophy in manifest HD compared to controls in the medial visual network (green). Significant family-wise-error corrected regions are presented in blue overlaid on sagittal, coronal, and transversal slices of Montreal-neurological-Institue-152 standard T1-weighted images. Correspondingx,y, andzcoordinates are given [Color figure can be viewed at wileyonlinelibrary.com]
TABLE 5 Decreased functional connectivity in medial visual network in manifest HD
Brain structure
Side MNI coordinates (mm) tvalue pvalue
x y z
Lingual gyrus (BA 18) Occipital fusiform gyrus
(BA 19/37)
R 12 −86 −14 4.65 0.013
Occipital pole (BA 17) R 12 −98 −6 4.27 0.016
Lingual gyrus (BA 18) Occipital pole (BA 17)
L 0 −88 −14 4.43 0.015
Occipital fusiform gyrus (BA 19/37)
L −14 −90 −16 3.39 0.035
carriers that are within a decade or nearer to disease onset, suggesting
a sudden increase in the rate of thinning around disease onset
(Johnson et al., 2015; Nopoulos et al., 2010), but there are no
longitu-dinal studies that can confirm this hypothesis. The difference with our
findings might be explained by the fact that our cohort consisted of a
heterogeneous, relatively young group of premanifest HD gene
car-riers with a median estimated time to disease onset of 16 years, based
on the survival analysis of (Langbehn, Brinkman, Falush, Paulsen, &
Hayden, 2004). In contrast, the multicenter TRACK-HD and
PREDICT-HD studies included large cohorts of premanifest HD gene
carriers which were divided into close (e.g., below 9 or 10 years) and
far (above 10 to 15 years) from estimated disease onset. (Johnson
et al., 2015; Nopoulos et al., 2010; Tabrizi et al., 2009) Only six
pre-manifest participants in our study were within a decade or nearer to
disease onset, which might explain the fact that we found no
differ-ences between controls and premanifest HD.
Function of the posterior cerebral cortex has been studied less
extensively in HD. Our study examined brain function at rest, in
addi-tion to the assessment of brain funcaddi-tion during task performance.
Resting state fMRI can be used to study functional interactions
between brain regions at rest (i.e., connectivity), and as no active input
is required during resting state fMRI, the influence of the disease on
task performance is not of concern (Biswal et al., 2010; Dumas, van
den Bogaard, Hart, et al., 2013). Despite normal brain function after
visual task stimulation, decreased functional connectivity at rest of
the lingual and fusiform gyri, and occipital pole was found in manifest
HD compared to controls within the medial visual network. One other
study specifically focused on the visual cortex at rest using resting
state fMRI in manifest HD and found only reduced connectivity in the
left fusiform gyrus, despite widespread volume loss in the occipital
cortex (Wolf et al., 2014). Our findings of reduced functional
connec-tivity were also independent of gray matter atrophy in these regions,
which might suggest that regional atrophy does not cause abnormal
neural connectivity at rest.
To improve the understanding of functional alterations in
differ-ent disease stages, we additionally examined brain function at rest in
premanifest individuals. Compared to controls, we found no
differ-ences in functional connectivity for both medial and visual networks,
which is contrary to a previous study that showed reduced
connectiv-ity in the right parietal and bilateral visual cortices of the medial visual
network in premanifest HD gene carriers (Dumas, van den Bogaard,
Hart, et al., 2013). Although using several methodological approaches,
these reductions in whole brain functional connectivity in premanifest
HD were not detectable over time in longitudinal studies (Odish et al.,
2014; Seibert, Majid, Aron, Corey-Bloom, & Brewer, 2012). A possible
explanation for these discrepancies can be a selection bias, as
partici-pants with a faster rate of clinical decline might withdraw earlier from
the study, leaving a relatively fitter premanifest group for longitudinal
analyses (Odish et al., 2014).
Still, our study provides evidence of preserved brain function of
the primary visual cortex at rest and after visual stimulation in
mani-fest HD, but reduced function in the ventral occipito-temporal
path-way at rest. Structural alterations of the visual cortex seem,
nevertheless, to be more pronounced and widespread than
func-tional alterations in early manifest HD, even extending to the
inferior temporal and superior parietal cortices. Together with
previ-ous studies that additionally found evidence of cortical thinning and
volume loss in these regions in premanifest HD gene carriers that
are within a decade to disease onset (Johnson et al., 2015;
Nopou-los et al., 2010; Rosas et al., 2005; Tabrizi et al., 2009), this implies
that structural alterations might precede functional alterations in
HD. Future studies with larger sample sizes are, however, needed to
examine brain function using tasks that involve other visual
cogni-tive domains, such as object or facial emotion recognition, or
visuo-motor function.
A limitation of this study is that due to the cross-sectional design
and our heterogeneous group of premanifest HD gene carriers, it
remains uncertain how the posterior cerebral cortex changes over time.
It would be interesting to assess the progression of posterior cortical
volume loss longitudinally and in addition measure the effect of volume
loss on changes in neural connectivity. In this way, potential cortical
bio-markers can be identified that can be used in future clinical trials.
Another limitation of this study is the relative small sample size of our
cohort, which additionally prevents examining the role of gender.
In conclusion, the ventral visual pathway, specifically the lingual
and fusiform gyri and the lateral occipital cortex, showed most
pro-nounced structural and functional alterations in early manifest
HD. Our study is the first to provide evidence of preserved basic
visual function in early disease stages after visual stimulation.
Clini-cally, visual perceptual function was impaired and related to reduced
cortical thickness of the ventral posterior brain regions. Still, changes
in the visual cortex were not detectable in our premanifest HD group.
Our findings suggest that clinical visual deficits in HD are linked
to atrophy of the posterior cerebral cortex, while basic visual function
remains preserved in early disease stages.
A C K N O W L E D G M E N T S
The authors thank all patients and relatives who have participated in
this study. The authors also thank all investigators who have assisted
in data collection.
C O N F L I C T O F I N T E R E S T S
E. M. Coppen, J. van der Grond, A. Hafkemeijer, and J. Barkey Wolf
report no conflict of interests. R. A. C. Roos receives research grants
from TEVA Pharmaceuticals and is advisor for UniQure.
O R C I D
Emma M. Coppen https://orcid.org/0000-0003-3273-3017
R E F E R E N C E S
Andersson, J. L. R., Jenkinson, M., & Smith, S. (2007).Non-linear registration aka spatial normalisation(FMRIB Technical Report TRO7JA2). Oxford, United Kingdom: FMRIB Centre. Retrieved from http://fmrib.medsci. ox.ac.uk/analysis/techrep/tr07ja2/tr07ja2.pdf
Bates, G. P., Dorsey, R., Gusella, J. F., Hayden, M. R., Kay, C., Leavitt, B. R., … Tabrizi, S. J. (2015). Huntington disease. Nature Reviews Disease Primers,1, 15005.
analysis. Philosophical Transactions of the Royal Society, 360, 1001–1013.
Birn, R. M. (2012). The role of physiological noise in resting-state func-tional connectivity.NeuroImage,62, 864–870.
Biswal, B. B., Mennes, M., Zuo, X.-N., Gohel, S., Kelly, C., Smith, S. M.,… Milham, M. P. (2010). Toward discovery science of human brain func-tion. Proceedings of the National Academy of Sciences of the United States of America,107, 4734–4739.
Bora, E., Velakoulis, D., & Walterfang, M. (2016). Social cognition in Hun-tington’s disease: A meta-analysis. Behavioural Brain Research, 297, 131–140.
Desikan, R. S., Se, F., Fischl, B., Quinn, B. T., Dickerson, B. C., Blacker, D.,… Killiany, R. J. (2006). An automated labeling system for subdividing the human cerebral cortex on MRI scans into gyral based regions of inter-est.NeuroImage,31, 968–980.
Douaud, G., Smith, S., Jenkinson, M., Behrens, T., Johansen-Berg, H., Vickers, J.,… James, A. (2007). Anatomically related grey and white matter abnormalities in adolescent-onset schizophrenia. Brain, 130, 2375–2386.
Dumas, A., Dierksen, G. A., Gurol, M. E., Halpin, A., Martinez-Ramirez, S., Schwab, K.,…Greenberg, S. M. (2012). Functional magnetic resonance imaging detection of vascular reactivity in cerebral amyloid angiopathy. Annals of Neurology,72, 76–81.
Dumas, E., Say, M., Jones, R., Labuschagne, I., Regan, A., Hart, E., … Tabrizi, S. (2012). Visual working memory impairment in Premanifest gene-carriers and early Huntington's disease. Journal of Huntington's Disease,1, 97–106.
Dumas, E., van den Bogaard, S., Hart, E., Soeter, R., Van Buchem, M., Van Der Grond, J.,…Roos, R. (2013). Reduced functional brain connectivity prior to and after disease onset in Huntington's disease.NeuroImage: Clinical,2, 377–384.
Dumas, E., van den Bogaard, S., Middelkoop, H., & Roos, R. (2013). A review of cognition in Huntington's disease. Frontiers in Bioscience, 5, 1–18.
Filippini, N., Macintosh, B. J., Hough, M. G., Goodwin, G. M., Frisoni, G. B., Smith, S. M.,…Mackay, C. E. (2009). Distinct patterns of brain activity in young carriers of the APOE-e4 allele. Proceedings of the National Academy of Sciences of the United States of America,106, 7209–7214. Fischl, B., & Dale, A. M. (2000). Measuring the thickness of the human
cerebral cortex from magnetic resonance images. Proceedings of the National Academy of Sciences of the United States of America, 97, 11050–11055.
Gómez-Tortosa, E., del Barrio, A., Barroso, T., & García Ruiz, P. J. (1996). Visual processing disorders in patients with Huntington's disease and asymptomatic carriers.Journal of Neurology,243, 286–292.
Good, C., Johnsrude, I., Ashburner, J., Henson, R., Friston, K., & Frackowiak, R. (2001). A voxel-based morphometric study of ageing in 465 normal adult human brains.NeuroImage,14, 21–36.
Grill-Spector, K., Kourtzi, Z., & Kanwisher, N. (2001). The lateral occipital complex and its role in object recognition. Vision Research, 41, 1409–1422.
Hafkemeijer, A., Möller, C., Dopper, E. G. P., Jiskoot, L. C., Schouten, T. M., van Swieten, J. C.,…Rombouts, S. A. R. B. (2015). Resting state func-tional connectivity differences between behavioral variant frontotem-poral dementia and Alzheimer's disease. Frontiers in Human Neuroscience,9, 474.
Huntington Study Group. (1996). Unified Huntington's disease rating scale: Reliability and consistency.Movement Disorders,11, 136–142. Jenkinson, M., Bannister, P., Brady, M., & Smith, S. (2002). Improved
opti-mization for the robust and accurate linear registration and motion cor-rection of brain images.NeuroImage,17, 825–841.
Johnson, E. B., Rees, E. M., Labuschagne, I., Durr, A., Leavitt, B. R., Roos, R. A. C.,…Wang, C. (2015). The impact of occipital lobe cortical thickness on cognitive task performance: An investigation in Hunting-ton's disease.Neuropsychologia,79, 138–146.
Kanwisher, N., Mcdermott, J., & Chun, M. M. (1997). The fusiform face area: A module in human extrastriate cortex specialized for face per-ception.The Journal of Neuroscience,17, 4302–4311.
Kordsachia, C. C., Labuschagne, I., & Stout, J. C. (2017). Beyond emotion recognition deficits: A theory guided analysis of emotion processing in
Huntington's disease. Neuroscience and Biobehavioral Reviews, 73, 276–292.
Kravitz, D. J., Saleem, K. S., Baker, C. I., Ungerleider, L. G., & Mishkin, M. (2013). The ventral visual pathway: An expanded neural framework for the processing of object quality. Trends in Cognitive Sciences, 17, 26–49.
Labuschagne, I., Cassidy, A. M., Scahill, R. I., Johnson, E. B., Rees, E., Regan, A. O.,…Investigators, T. (2016). Visuospatial processing deficits linked to posterior brain regions in premanifest and early stage Hun-tington's disease.Journal of the International Neuropsychological Society, 22, 595–608.
Langbehn, D. R., Brinkman, R. R., Falush, D., Paulsen, J. S., & Hayden, M. R. (2004). A new model for prediction of the age of onset and penetrance for Huntington's disease based on CAG length.Clinical Genetics,65, 267–277. Lawrence, A. D., Watkins, L. H., Sahakian, B. J., Hodges, J. R., &
Robbins, T. W. (2000). Visual object and visuospatial cognition in Hun-tington's disease: Implications for information processing in corticos-triatal circuits.Brain,123, 1349–1364.
Lemiere, J., Decruyenaere, M., Evers-Kiebooms, G., Vandenbussche, E., & Dom, R. (2004). Cognitive changes in patients with Huntington's dis-ease (HD) and asymptomatic carriers of the HD mutation.Journal of Neurology,251, 935–942.
Luteijn, F., & Barelds, D. P. (2004).Handleiding groninger intelligentietest 2 (GIT)[Manual Groningen intelligence test]. Lisse, the Netherlands: Swets & Zeitlinger.
Nana, A. L., Kim, E. H., Thu, D. C. V., Oorschot, D. E., & Tippett, L. J. (2014). Widespread heterogeneous neuronal loss across the cerebral cortex in Huntington's.Journal of Huntington's Disease,3, 45–64. Nopoulos, P. C., Aylward, E. H., Ross, C. a., Johnson, H. J., Magnotta, V. a.,
Juhl, A. R.,…Paulsen, J. S. (2010). Cerebral cortex structure in prodro-mal Huntington disease.Neurobiology of Disease,40, 544–554. Odish, O. F. F., van den Berg-Huysmans, A. A., van den Bogaard, S. J. A.,
Dumas, E. M., Hart, E. P., Rombouts, S. A. R. B.,…Roos, R. A. C. (2014). Longitudinal resting state fMRI analysis in healthy controls and pre-manifest Huntington's disease gene carriers: A three-year follow-up study.Human Brain Mapping,119, 110–119.
O'Rourke, J. J. F., Beglinger, L. J., Smith, M. M., Mills, J., David, J., Rowe, K. C.,…Paulsen, J. S. (2011). The trail making test in prodromal Huntington disease: Contributions of disease progression to test per-formance. Journal of Clinical and Experimental Neuropsychology, 33, 567–579.
Prasad, S., & Galetta, S. L. (2011). Anatomy and physiology of the afferent visual system.Handbook of Clinical Neurology,102, 3–19.
Pruim, R. H. R., Mennes, M., Van, R. D., Llera, A., Buitelaar, J. K., & Beckmann, C. F. (2015). ICA-AROMA: A robust ICA-based strategy for removing motion artifacts from fMRI data.NeuroImage,112, 267–277. Roos, R. A. C. (2010). Huntington's disease: A clinical review.Orphanet
Journal of Rare Diseases,5, 40.
Rosas, H. D., Hevelone, N. D., Zaleta, A. K., Greve, D. N., Salat, D. H., & Fischl, B. (2005). Regional cortical thinning in pre-clinical Huntington disease and its relationship to cognition. Neurol-ogy,65, 745–747.
Rosas, H. D., Salat, D. H., Lee, S. Y., Zaleta, A. K., Pappu, V., Fischl, B.,… Hersch, S. M. (2008). Cerebral cortex and the clinical expression of Hun-tington's disease: Complexity and heterogeneity.Brain,131, 1057–1068. Rüb, U., Seidel, K., Vonsattel, J. P., Lange, H. W., Eisenmenger, W.,
Götz, M.,…Heinsen, H. (2015). Huntington's disease (HD): neurode-generation of Brodmann's primary visual area 17 (BA17).Brain Pathol-ogy,25, 701–711.
Seibert, T. M., Majid, D. S. A., Aron, A. R., Corey-Bloom, J., & Brewer, J. B. (2012). Stability of resting fMRI interregional correlations analyzed in subject-native space: A one-year longitudinal study in healthy adults and premanifest Huntington's disease.NeuroImage,59, 2452–2463. Shoulson, I., & Fahn, S. (1979). Huntington disease: Clinical care and
evalu-ation.Neurology,29, 1–3.
Smith, A. (1973). Symbol digit modalities test manual. Los Angeles, CA: Western Psychological Services.
Smith, S. M. (2002). Fast robust automated brain extraction.Human Brain Mapping,17, 143–155.
Advances in functional and structural MR image analysis and imple-mentation as FSL.NeuroImage,23, S208–S219.
Smith, S. M., & Nichols, T. E. (2009). Threshold-free cluster enhancement: Addressing problems of smoothing, threshold dependence and localisa-tion in cluster inference.NeuroImage,44, 83–98.
Stout, J., Jones, R., Labuschagne, I., O'Regan, A., Say, M., Dumas, E., … Frost, C. (2012). Evaluation of longitudinal 12 and 24 month cognitive outcomes in premanifest and early Huntington's disease. Journal of Neurology, Neurosurgery, and Psychiatry,83, 687–694.
Stroop, J. (1935). Studies of interference in serial verbal reactions.Journal of Experimental Psychology,18, 643–662.
Tabrizi, S. J., Langbehn, D. R., Leavitt, B. R., Roos, R. A. C., Durr, A., Craufurd, D.,…Stout, J. C. (2009). Biological and clinical manifestations of Huntington's disease in the longitudinal TRACK-HD study: Cross-sectional analysis of baseline data.Lancet Neurology,8, 791–801. Thu, D. C. V., Oorschot, D. E., Tippett, L. J., Nana, A. L., Hogg, V. M.,
Synek, B. J.,…Faull, R. L. M. (2010). Cell loss in the motor and cingu-late cortex correcingu-lates with symptomatology in Huntington's disease. Brain,133, 1094–1110.
Tootell, R. B. H., Tsao, D., & Vanduffel, W. (2003). Neuroimaging weighs in: Humans meet macaques in“primate”visual cortex.The Journal of Neuroscience,23, 3981–3989.
Ungerleider, L. G., & Haxby, J. V. (1994).“What”and“where”in the human brain.Current Opinion in Neurobiology,4, 157–165.
Waldvogel, H. J., Kim, E. H., Thu, D. C. V., Tippett, L. J., & Faull, R. L. M. (2012). New perspectives on the neuropathology in Huntington's
disease in the human brain and its relation to symptom variation.J Huntingtons Dis,1, 143–153.
Warrington, E., & James, M. (1991).Visual object and space perception bat-tery. Bury St. Edmunds, UK: Thames Valley Test Company.
Winkler, A. M., Ridgway, G. R., Webster, M. A., Smith, S. M., & Nichols, T. E. (2014). Permutation inference for the general linear model.NeuroImage,92, 381–397.
Wolf, R. C., Sambataro, F., Vasic, N., Baldas, E.-M., Ratheiser, I., Bernhard Landwehrmeyer, G.,… Orth, M. (2014). Visual system integrity and cognition in early Huntington's disease.The European Journal of Neuro-science,40, 2417–2426.
S U P P O R T I N G I N F O R M A T I O N
Additional supporting information may be found online in the
Sup-porting Information section at the end of the article.
How to cite this article: Coppen EM, Grond Jeroen van der, Hafkemeijer A, Barkey Wolf JJH, Roos RAC. Structural and
functional changes of the visual cortex in early Huntington’s
disease. Hum Brain Mapp. 2018;39:4776–4786. https://doi.