Title: Structures of C1-IgG1 provide insights into how danger pattern
recognition activates complement
Authors: Deniz Ugurlar1, Stuart C. Howes2, Bart-Jan de Kreuk3, Roman I. Koning2,4, Rob N. de
Jong3, Frank J. Beurskens3, Janine Schuurman3, Abraham J. Koster2,4, Thomas H. Sharp2*, Paul
W.H.I. Parren3,5*, Piet Gros1*
Affiliations:
1Crystal and Structural Chemistry, Bijvoet Center for Biomolecular Research, Department of
Chemistry, Faculty of Science, Utrecht University, Padualaan 8, 3584 CH Utrecht, The Netherlands.
2Section Electron Microscopy, Department of Molecular Cell Biology, Leiden University
Medical Center, Einthovenweg 20, 2300 RC Leiden, The Netherlands.
3Genmab, Yalelaan 60, 3584 CM Utrecht, The Netherlands.
4NeCEN, Gorlaeus Laboratories, Leiden University, 2333 CC Leiden, The Netherlands
5Department of Immunohematology and Blood Transfusion, Leiden University Medical Center,
Albinusdreef 2, 2333 ZA Leiden, the Netherlands
Abstract: Danger patterns on microbes or damaged host cells bind and activate C1, inducing innate immune responses and clearance through the complement cascade. How these patterns trigger complement initiation remains elusive. Here, we present cryo-EM analyses of C1 bound to monoclonal antibodies in which we observed heterogeneous structures of single and clustered C1-IgG1 hexamer complexes. Distinct C1q binding sites are observed on the two Fc-CH2 domains of each IgG molecule. These are consistent with known interactions and also reveal additional interactions, which are supported by functional IgG1-mutant analysis. Upon antibody binding, the C1q arms condense, inducing rearrangements of the C1r2s2 proteases and tilting
C1q’s cone-shaped stalk. The data suggest that C1r may activate C1s within single, strained C1 complexes or between neighboring C1 complexes on surfaces.
One Sentence Summary: Cryo-EM structures of C1 bound to antibodies suggest mechanisms for how danger patterns on cell membranes trigger an immune response.
Main Text: The complement system is part of our innate immune system. The classical
complement pathway is triggered by activation of the C1 initiation complex upon binding to cell surfaces. C1, or C1qr2s2, consists of four proteases, C1r and C1s, that associate with C1q, which
Previously, we demonstrated that IgG molecules, bound to their cognate antigens on liposomes or cell membranes, oligomerize through interactions between their Fc regions and form
hexameric, high avidity, C1-binding structure reminiscent of multimeric IgM antibodies (Fig. S1D) (5). Mutagenesis studies (6–8) showed that amino-acid residues in IgG1 important for direct C1 binding are situated in the CH2 domains near the Fab-Fc hinge at the periphery of these Fc-platforms (Fig. S1C). In C1q, globular head residues of predominantly C1q B mediate IgG binding (4, 9, 10). However, the molecular sequence of events leading to C1 activation by IgG hexamers remains poorly understood (11). Here, we used IgG monoclonal antibodies (mAb) oligomerized through antigen-binding on liposomes or preformed antibody-complexes in
solution and applied tomography and single-particle cryo-electron microscopy (EM) to resolve the mechanisms of C1 binding and activation.
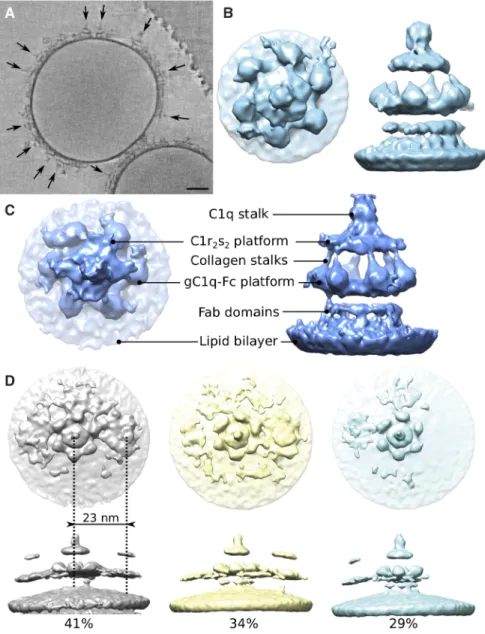
Liposomes carrying di-nitrophenyl (DNP) haptens were incubated with an anti-DNP chimeric IgG1 mAb and C1 to allow extensive formation of surface-bound C1-IgG1 complexes (Fig. 1A). Tomograms showed marked structural variations in C1 binding to antibodies on these liposomes (Fig. 1A, Fig S2A,B). Alignment and classification of single membrane-bound C1-IgG1
complexes (Fig. 1B) yielded a reconstruction at ~25-Å resolution (Fig. S2C,D). Focused alignment and classification on the Fc-C1 complex (excluding the membrane and Fab domains; Fig. S2B,E) revealed six densities corresponding to gC1q domains binding an Fc-platform formed by six IgG1 molecules, a rhomboidal platform accounting for bound C1r2s2 proteases and
nearest neighbors varied from approx. 11-40 nm center-to-center, with a peak at 23 nm (Fig. S2F), reflecting a variation of arrangements of neighboring complexes. The C1 complexes are not evenly distributed across the surfaces of the liposomes, suggesting that there is preference for the complexes to associate, rather than occupy all available liposome surface (Fig. 1A, S2A). Soluble C1-IgG16 complexes of 1.7 MDa were obtained (Fig. S3A,B) by incubating C1, with
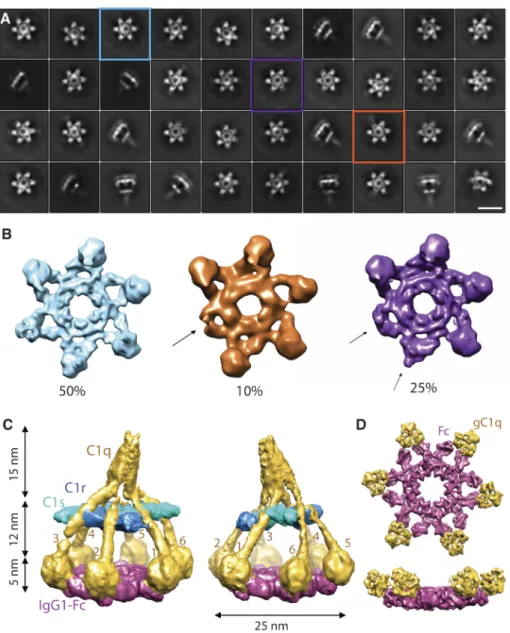
catalytically inactive proteases C1r (S654A) and C1s (S632A), with a human IgG1 mAb containing three mutations that drive the formation of IgG hexamers in solution (i.e. IgG1-E345R, E430G and S440Y) (5, 13, 14). Classification and averaging of single-particle densities yielded separate classes with four, five or six gC1q domains in contact with the Fc platforms (Fig. 2A,B, Fig. S4C). One class containing ~79,000 particles with six gC1q domains bound to the Fc platform yielded a map at 10-Å resolution (Fig. S4D), resulting in an overall structure 32 nm high and 25 nm wide that is consistent with densities observed in tomography (Fig. S5). The reconstruction reveals densities for all C1q collagen-like triple helices and gC1q modules, C1r and C1s proteases and IgG1-Fc regions (Fig. 2C,D).
Imposing six-fold symmetry on the IgG1 platform bound to gC1q yielded a density map at 7.3-Å resolution (Fig. 3A, Fig. S4D). Crystal structures of Fc CH2 and CH3 domains (pdb-code 1HZH) (15) and gC1q (1PK6) (16) were modeled in this density map (Fig. 3A). In the resulting model, each gC1q domain contacts peripheral areas on both CH2 and CH2’ domains of an IgG-Fc dimeric segment, burying ~540 Å2 surface area (Fig. S6A). The Fc segments adopt an open
both of which exhibit a six-fold (crystal) packing of their Fc portions, that have Pro329-Pro329’ distances of 24 and 29 Å, respectively. Densities are present for N-linked glycans at Asn297 and Asn297’ (Fig. 3A). However, no direct contact is observed between the glycans and gC1q, supporting the idea that glycosylation affects C1 binding through IgG hexamerization (13). Fitting of hetero-trimeric gC1q to the density yielded similar correlation coefficients for three possible A-B-C domain orientations, with a marginally higher score for chains B and C facing the antibodies, consistent with mutation data that has identified chains B and C harboring the antibody-binding sites (9).
The Fc-gC1q structure identified distinct C1q-binding sites on the two Fc-CH2 domains of an IgG1. The observed binding sites are corroborated by extensive mutagenesis, which shows that both previously established amino acid contacts and contacts newly identified in our structure modulate complement activation (Fig. 3B,C; Fig. S6C)(6–8, 18). Mutations were introduced in the CD20 mAb IgG1-7D8 and the impact on complement-dependent cytotoxicity (CDC) of CD20-expressing Raji cells was assessed (Fig. 3C, Table S1). The first binding site is formed by loop FG (residues 325–331) of Fc CH2, known to be involved in binding both C1q and Fcg -receptors (18–20). Critical residues Pro329-Ala330-Pro331 (3, 6, 18) form the tip of the FG loop with Pro329 making contact with hydrophobic C1q-B residue Phe178 (Fig. 3B). IgG1 CH2 residue Lys322 (21) provides additional charged interactions with C1q-C residue Asp195 (Fig. 3B). Mutation of Ala327 into a positively charged lysine decreased CDC, whereas the mutation Ala327Gly enhanced CDC (Fig. 3C). Consistent with previous observations, variant
charge at residues Glu269, Glu294 or Tyr300 abolished CDC (Fig. 3C). In contrast, the mutation Tyr300Asp enhanced CDC (Fig. 3C). Mutations Asn297Gln and Ser298Lys decreased CDC, likely due to absence of glycosylation. Furthermore, Fab-Fc hinge region residues Glu233, Leu234, Leu235, Gly236 and Gly237, contributed to C1q binding and CDC (Fig. S6C). Alanine substitutions of these residues decreased CDC, whereas Gly236Asp enhanced CDC, suggesting a possible charge interaction with C1q-B Arg150. The Fab regions themselves are positioned flexibly below the Fc platform, as is apparent in the tomography reconstructions (Fig. 1B,C, Fig. S5), and appear not to contribute directly to C1q binding and CDC.
We fitted structural models of C1q, C1r and C1s into the density reconstruction of C1-IgG16
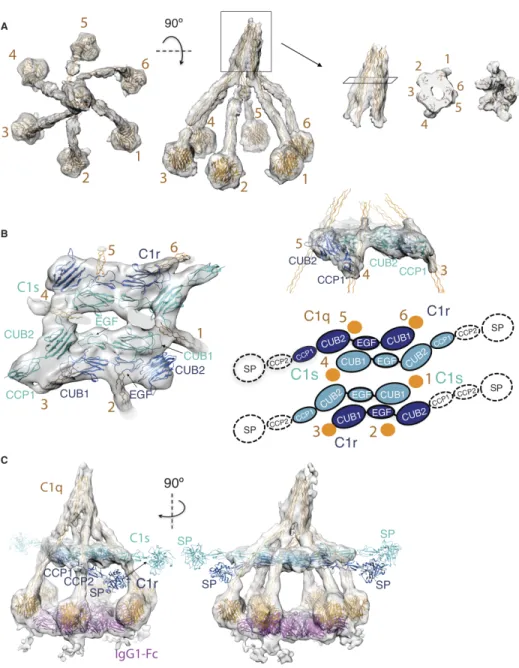
(Fig. 4, Fig. S7). On top of the C1 structure, the six C1q-A, B and C collagen-like triple helices form a stalk that adopts a continuous, hollow cone-shaped structure, which is tilted by 15° from the vertical axis. Six triple helices emerge from the stalk, extend downwards (with an irregular small right-handed supercoil) and connect to the gC1q modules that bind the IgG1-Fc hexamer platform. In particular, the collagen-like helices 3 and 6 display a marked bending (Fig. 4A). Density positioned in between the collagen-like helices is consistent with previously proposed binding of N-terminal domains of C1r2C1s2 between the C1q arms, with arms 2, 3, 5 and 6
which C1r CCP1 orients CCP2-SP to curve around the C1q collagen-like helix towards C1s and in which C1s CCP1-CCP2-SP sticks outwards, consistent with their proteolytic functions in the complement cascade (Fig. 4C Fig. S7D).
The observed arrangement of the C1r and C1s hetero-tetramer differs from predictions based on a tetrameric C1s arrangement (25, 31) The CUB2 domains of C1r and C1s are rotated and the C1r-C1s dimers are shifted along each other, shortening the contact sites of C1q-collagen helices 2 and 5 from 14 (31) to 11 nm in C1-IgG16 (Fig. S7A-C). The arrangement of the C1q arms,
induced upon binding the Fc hexamer, is also indicative of a compaction. The gC1q domains in unbound C1 are spread apart up to 30-35 nm (31). Bending of the collagen-like helices of arms 3 and 6, which embrace C1r2s2 in the longest dimension, and incomplete binding of the gC1q
heads (on arms 5 and 6) to Fc platforms support the notion of a surface-induced conformational change.
The affinity of gC1q modules for single IgG antibody molecules is very low. For IgG antibody molecules to form a recognition pattern therefore requires their clustering or aggregation, allowing the formation of a multivalent complex with C1. IgM molecules are already multivalent, but require their occluded C1 binding sites to be revealed upon interacting with surface antigen. Here we show that the multivalent binding of C1 to IgG hexamers results in compaction of C1q arms, which rearranges the N-terminal (CUB1-EGF-CUB2) platform of the C1r2s2 proteases, that may allow the catalytic SP domain of the C1r CCP1-CCP2-SP arm to
reach the scissile loop in C1s CCP1-CCP2-SP. Alternatively, the extended conformations of the CCP1-CCP2-SP domains may allow inter-complex proteolysis induced by neighboring
been proposed for MBL-MASP22 complexes of the lectin-binding complement pathway, in
which MASP1 proteases present in separate MBL-MASP12 complexes mediate activation (31,
32). Direct binding of C1 to ubiquitous and fluid ligands in a membrane, such as
phosphatidylserines on apoptotic cells, would likely not induce compaction of the C1q arms and activation may depend on intercomplex proteolysis of surface-bound C1 complexes. Our data suggest that danger pattern recognition by C1 may lead to proteolysis and activation within an isolated complex through a conformational change as suggested by an observed bending of C1q arms and the arrangement of proteases. Close interactions observed between separate C1-IgG complexes however suggest that proteolysis may also result from intercomplex activation.
References
1. G. J. Arlaud et al., Structural biology of C1: dissection of a complex molecular machinery. Immunol. Rev. 180, 136–145 (2001).
2. N. C. Hughes-Jones, B. Gardner, Reaction between the isolated globular sub-units of the complement component Clq and IgG-complexes. Mol. Immunol. 16, 697–701 (1979). 3. D. R. Burton et al., The Clq receptor site on immunoglobulin G. Nature. 288, 338–344
(1980).
4. L. T. Roumenina et al., Interaction of C1q with IgG1, C-reactive protein and pentraxin 3: mutational studies using recombinant globular head modules of human C1q A, B, and C chains. Biochemistry. 45, 4093–4104 (2006).
6. E. E. Idusogie et al., Engineered antibodies with increased activity to recruit complement. J. Immunol. 166, 2571–2575 (2001).
7. A. R. Duncan, G. Winter, The binding site for C1q on IgG. Nature. 332, 738–740 (1988). 8. G. L. Moore, H. Chen, S. Karki, G. A. Lazar, Engineered Fc variant antibodies with
enhanced ability to recruit complement and mediate effector functions. MAbs. 2, 181–189 (2010).
9. M. S. Kojouharova et al., Mutational analyses of the recombinant globular regions of human C1q A, B, and C chains suggest an essential role for arginine and histidine residues in the C1q-IgG interaction. J. Immunol. 172, 4351–4358 (2004).
10. U. Kishore et al., Structural and functional anatomy of the globular domain of complement protein C1q. Immunol. Lett. 95, 113–28 (2004).
11. C. Gaboriaud, W. L. Ling, N. M. Thielens, I. Bally, V. Rossi, Deciphering the fine details of C1 assembly and activation mechanisms: “Mission impossible”? Front. Immunol. 5, 565 (2014).
12. T. H. Sharp, F. G. A. Faas, A. J. Koster, P. Gros, Imaging complement by phase-plate cryo-electron tomography from initiation to pore formation. J. Struct. Biol. 197, 155–162 (2016).
13. G. Wang et al., Molecular basis of assembly and activation of complement component C1 in complex with immunoglobulin G1 and antigen. Mol. Cell. 63, 135–145 (2016).
14. R. N. de Jong et al., A novel platform for the potentiation of therapeutic antibodies based on antigen-dependent formation of IgG hexamers at the cell surface. PLoS Biol. 14 (2016), doi:10.1371/journal.pbio.1002344.
template for vaccine design. Science. 293, 1155–1159 (2001).
16. C. Gaboriaud et al., The crystal structure of the globular head of complement protein C1q provides a basis for its versatile recognition properties. J. Biol. Chem. 278, 46974–82 (2003).
17. A. M. Davies, R. Jefferis, B. J. Sutton, Crystal structure of deglycosylated human IgG4-Fc. Mol. Immunol. 62, 46–53 (2014).
18. E. E. Idusogie et al., Mapping of the C1q binding site on rituxan, a chimeric antibody with a human IgG1 Fc. J. Immunol. 164, 4178–84 (2000).
19. M. H. Tao, R. I. Smith, S. L. Morrison, Structural features of human immunoglobulin G that determine isotype-specific differences in complement activation. J. Exp. Med. 178, 661–667 (1993).
20. S. M. Canfield, S. L. Morrison, The binding affinity of human IgG for its high affinity Fc receptor is determined by multiple amino acids in the CH2 domain and is modulated by the hinge region. J. Exp. Med. 173 (1991).
21. T. E. Michaelsen et al., A mutant human IgG molecule with only one C1q binding site can activate complement and induce lysis of target cells. Eur. J. Immunol. 36, 129–138
(2006).
22. M. S. Kojouharova, I. G. Tsacheva, M. I. Tchorbadjieva, K. B. M. Reid, U. Kishore, Localization of ligand-binding sites on human C1q globular head region using
recombinant globular head fragments and single-chain antibodies. Biochim. Biophys. Acta. 1652, 64–74 (2003).
(2009).
24. A. E. Phillips et al., Analogous interactions in initiating complexes of the classical and lectin pathways of complement. J. Immunol. 182, 7708–17 (2009).
25. V. U. Girija, A. R. Gingras, J. E. Marshall, R. Panchal, A. Sheikh, Structural basis of the C1q/C1s interaction and its central role in assembly of the C1 complex of complement activation. Proc. Natl. Acad. Sci. 110, 13916–20 (2013).
26. M. Budayova-Spano et al., Monomeric structures of the zymogen and active catalytic domain of complement protease c1r: further insights into the c1 activation mechanism. Struct. London Engl. 1993. 10, 1509–1519 (2002).
27. M. Budayova-Spano et al., The crystal structure of the zymogen catalytic domain of complement protease C1r reveals that a disruptive mechanical stress is required to trigger activation of the C1 complex. Eur. Mol. Biol. Organ. J. 21, 231–239 (2002).
28. A. J. Perry et al., A molecular switch governs the interaction between the human complement protease C1s and its substrate, complement C4. J. Biol. Chem. 288, 15821– 15829 (2013).
29. A. R. Gingras et al., Structural basis of mannan-binding lectin recognition by its associated serine protease MASP-1: implications for complement activation. Structure. 19, 1635–43 (2011).
30. H. Feinberg et al., Crystal structure of the CUB1-EGF-CUB2 region of mannose-binding protein associated serine protease-2. EMBO J. 22, 2348–59 (2003).
31. S. A. Mortensen et al., Structure and activation of C1, the complex initiating the classical pathway of the complement cascade. Proc. Natl. Acad. Sci. 114, 986–991 (2017).
Acknowledgements
Electron density maps are deposited in the EMBD. We gratefully acknowledge helpful
discussions with Laura van Bezouwen, Dimphna Meijer, Friedrich Förster (Utrecht, Netherlands) and Sjors Scheres (Cambridge, UK) and technical assistance from Chris Schneijdenberg and Hans Meeldijk (EM-square, Utrecht). This research was supported by grants from the
Netherlands Organization for Scientific Research (NWO) (project numbers CW 714.013.002, 700.57.010 and STW 13711), the Institute of Chemical Immunology (NWO 024.002.009) and the European Research Council (project 233229). This work was supported by the Netherlands Centre for Electron Nanoscopy (NeCEN), Leiden (NWO 175.010.2009.001).
Conflict of interests
JS, FJB, BJdK, RNdJ and PWHIP are inventors on patent applications related to complement activation by therapeutic antibodies. JS, FJB,BJdK and RNdJ are Genmab employees and own Genmab warrants and/or stock. PWHIP owns Genmab stock.
Author contributions
DU generated and purified mutant C1r and C1s, generated C1-IgG16, prepared grids, collected
single-particle micrographs and processed data. DU and PG analysed single-particle data. RNdJ and DU designed Ab mutants and BJdK performed CDC and CD20 binding assays. SCH, RIK, AJK, and THS prepared liposomes and grids, and collected, processed and analysed tomography data. DU, RNdJ, THS, PWHIP and PG wrote the manuscript. All authors commented on
Fig. 1. C1-mAb complexes observed on liposomes by tomography.
(A) A 10 nm-thick slice through a dual-axis tomogram showing C1 complexes (arrows) bound to surface-associated antibody complexes. Scale bar indicates 20 nm. (B) Reconstruction of a single C1-IgG1 complex shown from the top (left) and side (right) at 25 Å resolution. (C) Focused alignment and classification of the complexes excluding the membrane and Fab regions (see also Fig. S2E for masks used in focused reconstructions) revealed density from the C1r2s2 platform
Fig. 2. Soluble C1-IgG16 complexes display heterogeneous structures.
(A) Representative 2D class averages. Colored boxes indicate three classes corresponding to main 3D classes, as shown below. Scale bar represents 25 nm. (B) Main 3D classes after focused 3D classification and 3D refinement, showing the ‘bottom platform’ segment of the
Fig. 3. Fc-gC1q interactions in C1-IgG16.
Fig. 4. Structural model of C1 fitted into C1-IgG16 density.
(A) Model for C1q-A, B and C hexamer indicating collagen-like segments forming a N-terminal stalk region, six collagen-like triple helices and C-terminal trimeric gC1q modules. Shown are top and side views (left and middle) of C1q and side, sliced-through top and bottom view (3rd
(top right), with the latter revealing density for the CCP1 domain of C1r. A cartoon
representation of the domain arrangement is shown for clarity (bottom right). (C) Overall C1-IgG16 models in density. CCP2-SP domains lacking density have been added, using orientations
Supplementary Materials contents:
Materials and Methods
Figs. S1 to S7
Tables S1
References
Materials and Methods
Expression and Purification of the Proteins
Plasma-purified human C1q was purchased from Complement Technology, Inc. (Tyler, TX, USA). IgG1-RGY variant (E345R, E430G, and S440Y), IgG1-b12 and IgG1-7D8 were described previously (5, 15, 33). IgG1-DNP consisted of the murine variable domain of antibody G2a2 fused to a human IgG1 constant domain (34). IgG1-DNP and IgG1-7D8 antibody variants were created by gene synthesis of codon optimized open reading frames (Geneart Thermo Scientific, Regensburg, Germany), subcloned into pcDNA3.3-derived expression vectors. All antibodies were expressed, purified and characterized as described (14). C1q-depleted serum was obtained from Quidel (San Diego, CA).
C1r (S654A) and C1s (S632A) mutants were generated using the Quikchange mutagenesis kit (Agilent Genomics, Santa Clara, CA) on TOPO clones inserted in pCR8 vectors (Thermo Fisher Scientific, Waltham, MA). All C1r and C1s constructs were sub-cloned into
mammalian expression vectors carrying either a hexa-histidine tag or StrepII3-tag provided by U-Protein Express BV (U-PE), Utrecht, The Netherlands. C1r and C1s constructs were co-expressed in N-acetylglucosaminyltransferase I (GnTI)-deficient human embryonic kidney 293 cells that stably express Epstein-Bar virus nuclear antigen EBNA1 (HEK293-ES supplied by U-Protein Express BV). The supernatant was harvested on the 5th day of the expression, concentrated and dia-filtrated using a Quixstand system (GE Healthcare, Chicago, IL). C1r2s2 was purified by Ni-NTA affinity chromatography (GE Healthcare) followed by a size-exclusion chromatography step on a Superdex 200 column (GE
Healthcare). C1-IgG16 complexes were prepared by mixing C1r2s2, C1q and IgG1-RGY in 4:1:6 molar ratio. The complex was purified by gel filtration column BioSep 4000 15 ml column.
Raji cells (human Burkitt’s lymphoma) were obtained from the American Type Culture Collection (ATCC no. CLL-86; Rockville, MD) and cultured according to the supplied instructions. Cells were routinely tested for mycoplasma contamination.
Tomography sample preparation and data collection
Liposomes were prepared from dried films of cholesterol, DMPC, DMPG and cap-DNP-PE (all sourced from Avanti Polar Lipids, Alabaster, AL) at a molar ratio of 100:90:10:1, respectively. Films were hydrated in buffer (50 mM HEPES, pH 8.0, 145 mM NaCl, and 3 mM CaCl2) at 37°C for 4 hours and extruded through 200 nm pore filters at 45°C.
Liposomes, IgG1-DNP, and plasma-purified human C1 complex (Complement Technology Inc., Tyler, TX) were mixed on ice at final concentrations of 1.3 mg/ml, 0.025 mg/ml and 0.017 mg/ml, respectively, then brought to room temperature and allowed to equilibrate for approximately 30 minutes. Gold fiducials coated in bovine serum albumin (Aurion,
Wageningen, The Netherlands) were added to the samples immediately before 3 µl of the mixture was applied to freshly glow-discharged Quantifoil R2/1 300 mesh holey carbon grids in the chamber of a Leica EM-GP plunge-freezer (Leica, Germany) set at 96% humidity and 21°C. Grids were blotted for 1 sec and plunged into liquid ethane.
Tomograms were collected at NeCEN (Leiden, The Netherlands) on a Titan Krios (Thermo Fisher Scientific) operating at 300 kV equipped with a phase plate (Thermo Fisher Scientific) heated to 225°C. Zero-energy-loss images were acquired using the software program FEI Tomography 4 (Thermo Fisher Scientific), using a GIF-Quantum LS energy filter (Gatan, Pleasanton, CA) with a slit width of 20 eV. A K2 Summit direct electron detector (Gatan) was used in counting mode at a nominal magnification of 53,000× for a pixel size of 2.69 Å at the sample. Tomographic tilt series were collected from ±50° in 2° increments with a dose rate of 0.9 electrons per Å2 per sec for a total dose of 60 electrons per Å2 per tilt axis (dual-axis tomograms received a total dose 120 electrons per Å2). Exposures of 0.9 seconds were dose-fractionated into 6 movie frames per tilt angle. Before each tilt series, the Volta phase plate was advanced and conditioned for 5 minutes to generate an approximate phase shift of 90°. The phase plate was also conditioned for an additional 5 s between every fifth tilt image. Defocus values were set to -0.3 µm after tilting and before each image acquisition, which is sufficient to maintain negative phase contrast up to ~19 Å (35).
IMOD (37) after binning the aligned frames by 2 (final pixel size of 5.38 Å). Single- and dual-axis tomograms were processed using the same workflow for the reconstruction of each axis. Axes for dual-axis tomograms were combined using IMOD. The surfaces of liposomes were manually segmented from simultaneous iterative reconstruction technique (SIRT) reconstructions using Dynamo (38) and equally spaced boxes across the surface were extracted from weighted back-projection reconstructions for further processing. Dynamo tracks the orientation for each particle, and thereby allows for Fourier-space masks to be constructed for each sub-volume to account for missing information caused by selected tilt geometries (38). An initial model was generated by manually aligning 107 sub-volumes from the dual-axis tomograms and low pass filtered to 6 nm (Fig. S2C). White noise was added using EMAN2 (39) to five copies of the filtered initial model, which were then used for the classification and alignment of all the axis sub-volumes. The best average from the dual-axis alignments was again low pass filtered to 6 nm and four noisy copies used for the
classification and alignment of the single-axis sub-volumes. Initial rounds of classification for bare or decorated membrane surfaces were performed using data further binned by 2 (binned by 4 from the raw images) and low pass filtered, using the membrane orientation as a constraint on the alignment parameters (±30° maximum deviation in the sub-volume’s
inclination from the starting orientation and full freedom to rotate in the azimuthal direction). If the aligned sub-volumes were not separated by at least 10 nm in the original tomogram, the sub-volume with the lower correlation score was discarded from further processing. From classes that were not bare membrane, sub-volumes containing C1 complexes (often mixed with antibody-alone sub-volumes) were manually selected and the correct orientation verified from individual volume projections. These coordinates were used to re-extract the sub-volumes from weighted-back projection tomograms. The sub-sub-volumes were then subjected to a global orientation search again using binned and low-pass filtered data for the initial rounds and refined following gold-standard procedures. Sub-volumes that did not align correctly were again manually discarded by inspecting projections of the sub-volumes after the
orientation determined by the alignment procedure was applied. The C1-mAb complex shape and the membrane provide obvious features to verify the alignment. The final stack of
verified C1-mAb sub-volumes was then subjected to further classification using the
of 168 was used to investigate the neighboring C1-mAb complexes using a biased ellipsoid mask that fitted three mAb-C1 complexes in a line (Fig. S2E). The nearest neighbor distances were determined by computing the distance between aligned sub-volumes within each
tomogram. The x-, y- and z-shifts were added to the original coordinates of the sub-volume to calculate the C1 complex centre. The center-to-center distance for all particles was calculated and the minimum pairwise value was taken as the nearest neighbour distance shown in Fig. S2F. The final number of sub-volumes was 564 dual-axis and 3,190 single-axis. The final number of particles that contributed to the average shown in Fig. 1B is 1,660.
Sample preparation and data collection for single-particle cryo-EM
A volume of 3 µl of purified C1-IgG16 at a concentration of 0.2 mg/ml was applied to freshly glow discharged R1.2/1.3 holey carbon grids (Quantifoil). The grids were blotted for 1 s at 99% humidity in a Vitrobot plunge-freezer (Thermo Fisher Scientific). Cryo-EM images were collected at EM-square (Utrecht, The Netherlands) on a Talos Arctica (Thermo Fisher Scientific) operating at 200 kV equipped with a Falcon II direct detector (Thermo Fisher Scientific) operating in movie mode. Images were recorded manually at a nominal magnification of 42,000× yielding a pixel size at the specimen of 2.27 Å. Using the EPU software (Thermo Fisher Scientific), 3,493 micrographs were recorded. Movies were collected for 3 s with a total of 52 frames with a calibrated dose of 10.4 e−/ Å2 per frame, a total dose of ~53 e-/Å2, and at defocus values between -1.8 and -3 µm. An example
micrograph is shown in Fig. S4A.
Single Particle Analysis
initial model. The map was low-pass filtered and used as a reference for 3D classification on the gC1q-Fc platform. A soft mask in Relion around gC1q-Fc platform was generated by extending 3 pixels and softening the edge by further 10 pixels. Focused classification using this mask yielded five classes with a resolution up to 15 Å. 3D refinement of a selection of 126,372 particles in Relion resulted in a 14 Å map. Two masks were generated using this map around the full C1-IgG6 complex (extended by 3 pixels and softening by 10 pixels) and around gC1q-Fc platform (extended by 2 pixels and softening by 20 pixels). The initial selected class of 79,120 particles was used for 3D refinement in Cryosparc (homogenous refinement option) with the 14 Å map used as a reference and the mask around full C1-IgG16 complex. After 3D refinement in Cryosparc and postprocessing in Relion, the resolution was 10 Å. 3D refinement applying C6 symmetry with the mask around gC1q-Fc platform and subsequent post-processing resulted in 7.3 Å map. The resolutions were estimated by Fourier shell correlation between two half maps (each calculated independently) as a function of resolution and using the gold-standard FSC = 0.143 criterion. For classification and
refinement, a box size of 224 pixels was used. Particle-polishing procedure implemented in Relion software did not improve the resolution (data not shown). The second set of particles (right column in Fig.S4C) were used for 3D classsification using a mask around gC1q-Fc platform. 44,121 particles showing 4 gC1q domains abound to Fc platform was reconstructed by 3D refinement and postprocessing. 12,781 particles showing 5 gC1q domains bound to Fc platform was reconstructed by 3D refinement and postprocessing.
Modeling C1 structure into density map
Crystal structures were fitted into densities using the “Fit in Map” routine from Chimera (44) Fc CH2, CH3, CH2’ and CH3’ domains were taken from the IgG1 b12 structure (pdb-code 1HZH) (15) and fitted independently into the density map obtained at 7.3-Å resolution. gC1q globular heads (1PK6) (16) were fitted in the same map in three orientations for the C1q-A, B and C domains and the orientation with the highest correlation coefficient (0.95) calculated by Chimera was selected. The serine proteases C1r and C1s were fit into the map using previously modelled arrangements of C1r2s2 bound to C1q (23–25) see Fig. S7A. The hetero-dimer C1rs started from the C1s homo-hetero-dimer structure of CUB1-EGF-CUB2 (4LMF) (25). One C1s copy was modified into C1r CUB1-EGF-CUB2 using homology modeling
CUB2 interaction with collagen of C1q arm 2 was modeled using the crystal structure of MASP CUB2 bound to collagen peptide (3POB) (29). This model of the C1rs hetero-dimer, C1r CUB1-EGF-CUB2 and C1s CUB1-EGF-CUB2, was placed into the density map
obtained at 10-Å resolution and adjusted to fit the density (Fig. S7A). Available densities for C1r and C1s CCP1 domains were modeled using the C1s CUB2-CCP1 structure (4LOS) (25). The model of C1rs CUB1-EGF-CUB2-CCP1 heterodimer was duplicated and rotated by 180° to model the other half of the density and minor adjustments were made to fit the density. Finally, we predicted the positions for the CCP2-SP domains of C1r and C1s, for which no densities were observed in the map. Starting from the positions and orientations of CUB-CCP1 domains, the model was extended using CCP1-CCP2-SP from the structure of zymogen C1r (1GPZ and 1MD7) (26, 27) and zymogen C1s (4J1Y) (28), and aligning them according to the arrangement observed in the structure of the C1s CUB2-CCP1-CCP2 fragment (4LOT) (25). The cross-correlation coefficient of C1-IgG16 model and the final map was 0.78 and gC1q-Fc and the bottom platform was 0.65 according to the scoring assessment tool of TEMPy (46).
Complement-dependent cytotoxicity assay
Supplementary Fig. S1. Domain compositions and prior structural information.
(A) Domain compositions of C1r and C1s, indicating the first ‘Complement C1r/C1s, Uegf, Bmp1’ (CUB1), epidermal growth factor-like (EGF), second CUB (CUB2), first
and CL, resp.) and heavy chain variable, constant-1, 2 and 3 domains (VH, CH1, CH2 and CH3, resp.), antigen-binding fragment (Fab), Fc and hinge region. Shown are a cartoon (left) and crystal structure 1HZH (15). Residues involved in C1q binding are schematically shown by yellow dots. (D) Six-fold arrangements of IgG1 Fc domains as observed in the crystal packing contacts in pdb 1HZH. The hexamer is shown in black with the Fc domain of a single IgG molecules highlighted in red (left). Model of the Fc arrangement in a single pentameric IgM molecule (right) (47).
Supplementary Fig. S2. Cryo-EM tomography of C1 bound to IgG1 on liposomal
B
C D
E
F A
surfaces and image analysis workflow.
(A) A 10.8 nm-thick slice through a single-tilt tomogram of liposomes decorated with a chimeric anti-DNP IgG1 monoclonal antibody and C1 complexes. The scale bar indicates 20 nm. (B) Raw images of IgG1-C1 complexes from single-tilt tomograms after coarse
alignment. The scale bar indicates 10 nm. (C) Sub-volume alignment and classification workflow. A subset of 107 sub-volumes from dual-axis tomograms were manually aligned to generate an initial model. The initial model was used to align and classify the dual-axis sub-volumes. The resulting average from the dual-axis data was used to process the single-axis sub-volumes. Due to the extensive flexibility, all assignments into the decorated class and final orientation of the aligned sub-volume were manually verified. Multi-reference
refinement using five classes (dual-tilt) and four classes (single-tilt) revealed classes showing flexibility of the structure and consistent presence of six IgG1-Fc and gC1q
domain-containing densities. The percentage of sub-volumes assigned to each class is shown below the image. From the single-axis sub-volumes, two of these classes were nearly identical and contained the majority of particles (54% total), which were subjected to a final alignment round, which yielded the density map shown in Fig. 1B. Focussed alignment and
classification on the Fc domains and C1 complex yielded the reconstruction shown in Fig. 1C. (D) Fourier shell correlation (FSC) curve for the complete IgG1-C1 complex showing FSC0.143 = 25 Å. (E) Masks used during sub-volume alignment and classification of complete mAb-C1 complexes (left), focussed refinement of the Fc-C1 complex (middle), and to
Supplementary Fig. S3.Sample preparation for single-particle cryo-EM.
(A) Gel-filtration profile of C1r2s2 purified with a Superose 6 16/60 column. A Coomassie-stained reducing SDS-PAGE gel is shown on the right. (B) Gel-filtration profile of C1-IgG16 purified with a BioSep 4000 column. Silver-stained reducing SDS-PAGE gel shows C1r, C1s, IgG1 heavy chain (IgGh) and light chain(IgGl), C1q-A, B and C chains on the right.
5 10 15
0 20 40 60 80 100 120 V (ml) UV (mAU ) A B C1r C1s IgGh C1qA-B C1qC IgGl 75 50 37 25
30 60 90 120
0 100 200 300 V (ml) UV (mAU
) 5075
Supplementary Fig. S4. Cryo-EM single particle analysis of C1-IgG16 and single
particle analysis workflow.
!"#
$$%"&'()*+,*-./0 12134%5&.-*6()780 19&)7-00(:()-6(+;
4<23$!4&.-*6()780
=<&,>4?&@+'-(;0&A+B;@C =!3&%&,>4?&@+'-(;0&A+B;@C<%3"<2&.-*6()780&
!"#$%$&$'#'+@877(;, (;&>*D+E.-*) $9&)7-00(:()-6(+; F(6/&,>4?GH)&'-0I %$# $9&)7-00(:()-6(+;& F(6/&,>4?GH)&'-0I $9&*8:(;8'8;6 4<23$!4&.-*6()780
41<3$"1&.-*6()780 $9&*8:(;8'8;6&(;&>*D+E.-*)"J3415&.-*6()780
$9&*8:(;8'8;6&(;&>*D+E.-*) F(6/&,>4?GH)&'-0I $9&*8:(;8'8;6 K L+06.*+)800(;, $9&*8:(;8'8;6 K L+06.*+)800(;, L+06G.*+)800(;, L+06G.*+)800(;, !&,>4?&A+B;@ %&,>4?&A+B;@ 413"24&.-*6()780 !!3414&.-*6()780
J# 45# $1# $!# 4%#
<%# $# 2# !# 15# B A
C
E F
(A) Representative micrograph of with a pixel size of 2.27 Å and a defocus value of -2.2 µm. (B) Direction distribution plots of particles for non-symmetric C1-IgG16 map and
C6-symmetry imposed gC1q-Fc map. (C) Single particle reconstruction workflow. 2D
Supplementary Fig. S5. Comparing cryo-EM tomography and single-particle reconstructions.
Supplementary Fig. S6. Identification of residues participating in gC1q-Fc interactions.
(A) Surface-area representation of Fc (magenta) with binding sites on CH2 and CH2’ as footprint of gC1q (orange) (left). Alignment of CH2 and CH2’ in cartoon representation (right) (B) Fc (magenta) with a distance of 31 Å between Pro329-Pro329’ and Fc arrangement as observed in the IgG1- b12 crystal structure (1HZH) exhibiting Pro329-Pro329’ distance 23.8 Å (green). (C) The Fab-Fc hinge region contributes to C1q binding.
A
B
C
CH2 site1 CH2’ site2
Supplementary Fig. S7. C1r and C1s arrangements.
each structure is shown on the left. The manual changes applied for fitting are shown by arrows. Final models (inside and outside the density) are shown on the right. (B)
Superposition of the N-terminal CUB1-EGF-CUB2 domains of C1r (blue) and C1s (cyan) in C1-IgG16 onto the C1s CUB1-EGF-CUB2 arrangement (beige) observed in crystal structure 4LMF (25), indicating different orientations of CUB2 domains. (C) Comparison of C1s-C1s arrangements in C1-IgG16 and the tetrameric packing of C1s observed in crystal structure 4LMF. Cartoon representations of the N-terminal CUB1-EGF-CUB2 arrangement for the C1r-C1s hetero-dimer in C1-IgG16 (left), with dashed line indicating the orientation of CUB2 domains in 4LMF, arrangement of the CUB1-EGF-CUB2 of C1r-C1s-C1s-C1r in C1-IgG16 (middle) and superposition of C1s CUB1-EGF-CUB2 stacking observed in 4LMF (right). Parallelograms in red solid and dashed lines indicate the effect of shifting the central C1s molecules by ca. 20 Å sideways. (D)Hypothetical model obtained by extending CCP2-SP outwards in side (left) and bottom view (right). This arrangement, that is consistent with the observed density, supports the catalytic SP domain C1r to reach and cleave the scissile bond of the adjacent C1s. (E) Modeling C1r CCP2-SP oriented inwards for putative auto-activation in side view (left) and bottom view (right), indicating that the observed density of C1-IgG16 is not consistent with an intra-complex auto-activation of C1r by the opposing C1r.
Supplementary Table S1
Experimental series 1
Antibody Location
Mean AUC (%) (1) SD (%) (2) N (3)
One way ANOVA, Dunnett's multiple comparisons test
WT IgG1-7D8 Control 100.0 9.2 3 Mean
difference
95% CI of difference
Adjusted p value (4)
IgG1 b12 Control 0.0 5.9 3
E233A Hinge 34.0 6.8 3 66 40.7 to 91.3 <0.0001
E233K Hinge 1.8 4.3 3 98.2 72.9 to 123 <0.0001
L234A Hinge 6.8 4.0 3 93.2 67.9 to 119 <0.0001
L235A Hinge 16.9 5.0 3 83.1 57.8 to 108 <0.0001
G236A Hinge 59.7 9.5 3 40.3 15 to 65.6 <0.0001
G236D Hinge 153.1 14.2 3 -53.1 -78.4 to -27.8 <0.0001
G236R Hinge 4.2 3.4 3 95.8 70.5 to 121 <0.0001
G237A Hinge 43.4 7.4 3 56.6 31.3 to 81.9 <0.0001
E269A Site 2 32.0 7.2 3 68 42.7 to 93.3 <0.0001
E269K Site 2 10.7 8.5 3 89.3 64 to 115 <0.0001
E294A Site 2 82.0 7.3 3 18 -7.25 to 43.3 0.3575
E294K Site 2 24.1 7.9 3 75.9 50.6 to 101 <0.0001
S298A Site 2 110.6 9.7 3 -10.6 -35.9 to 14.7 0.9629
S298K Site 2 14.1 7.0 3 85.9 60.6 to 111 <0.0001
Y300A Site 2 145.6 11.8 3 -45.6 -70.9 to -20.4 <0.0001
Y300D Site 2 207.2 13.0 3 -107 -133 to -81.9 <0.0001
Y300R Site 2 26.8 11.3 3 73.2 48 to 98.5 <0.0001
K322A Site 1 15.4 6.9 3 84.6 59.3 to 110 <0.0001
A327G Site 1 145.6 10.6 3 -45.6 -70.9 to -20.4 <0.0001
A327E Site 1 100.0 9.5 3 0 -25.3 to 25.3 0.9999
A327K Site 1 13.3 6.8 3 86.7 61.4 to 112 <0.0001
No Ab Control 3.8 6.1 3 96.2 70.9 to 121 <0.0001
Experimental series 2
Antibody Location Mean
AUC (%) (1)
SD (%) (2)
N
(3) One way ANOVA, Dunnett's multiple
comparisons test
WT IgG1-7D8 Control 100.0 10.6 6 Mean
difference
95% CI of difference
Adjusted p value (4)
IgG1 b12 Control 0.0 4.2 6
H268Q Site 2 75.4 7.3 3 24.6 6.39 to 42.7 0.0031
D270A Site 2 -0.7 3.0 3 101 82.5 to 119 <0.0001
N297Q Site 2 -0.4 2.6 3 100 82.2 to 119 <0.0001
K322A Site 1 -0.4 2.7 3 100 82.2 to 119 <0.0001
P329A Site 1 -2.0 2.9 3 102 83.9 to 120 <0.0001
P331A Site 1 12.9 6.7 3 87.1 68.9 to 105 <0.0001
L234A/L235A Hinge 3.8 4.8 3 96.2 78 to 114 <0.0001
K326A/E333A Site 1 223.7 11.6 3 -124 -142 to -105 <0.0001
Supplementary Table 1: Area under the curve (AUC) values for CDC of Raji cells normalized relative to the WT IgG1-7D8, which was set at 100% lysis. CDC data were collected in in two independent series of three experiments, and were normalized per series (top panel, bottom panel). Mean area under the curve (AUC) (1), standard deviation (SD) (2), number of replicates (N) (3), and multiplicity adjusted p-value of statistical analysis (4) are shown. One-way ANOVA was followed by Dunnett's Multiple Comparison Posthoc Test using GraphPad Prism 7.02. A p-value <0.05 indicates that the CDC induced by a mutant was different from that determined for wild-type IgG1-7D8.
References
33. J. L. Teeling et al., Characterization of new human CD20 monoclonal antibodies with
potent cytolytic activity against non-Hodgkin lymphomas. Blood. 104, 1793–1800
(2004).
34. K. D. White, M. B. Frank, S. Foundling, F. J. Waxman, Effect of immunoglobulin
variable region structure on C3b and C4b deposition. Mol. Immunol.33, 759–768
(1996).
35. X. Fan et al., Near-Atomic Resolution Structure Determination in Over-Focus with
Volta Phase Plate by Cs-corrected Cryo-EM. bioRxiv. 25, 1623–1630.e3 (2017).
36. X. Li et al., Electron counting and beam-induced motion correction enable
near-atomic-resolution single-particle cryo-EM. Nat. Methods. 10, 584–90 (2013).
37. D. N. Mastronarde, S. R. Held, Automated tilt series alignment and tomographic
reconstruction in IMOD. J. Struct. Biol.197, 102–113 (2017).
38. D. Castaño-Díez, M. Kudryashev, H. Stahlberg, Dynamo Catalogue: Geometrical tools
and data management for particle picking in subtomogram averaging of cryo-electron
tomograms. J. Struct. Biol.197, 135–144 (2017).
39. G. Tang et al., EMAN2: An extensible image processing suite for electron
40. A. Rohou, N. Grigorieff, CTFFIND4: Fast and accurate defocus estimation from
electron micrographs. J. Struct. Biol.192, 216–221 (2015).
41. S. H. W. Scheres, Semi-automated selection of cryo-EM particles in RELION-1.3. J.
Struct. Biol.189, 114–22 (2015).
42. S. H. W. Scheres, RELION: Implementation of a Bayesian approach to cryo-EM
structure determination. J. Struct. Biol.180, 519–530 (2012).
43. A. Punjani, J. L. Rubinstein, D. J. Fleet, M. A. Brubaker, cryoSPARC: algorithms for
rapid unsupervised cryo-EM structure determination. Nat. Methods. 14, 290–296
(2017).
44. E. F. Pettersen et al., UCSF Chimera—A Visualization System for Exploratory
Research and Analysis. J Comput Chem. 25, 1605–1612 (2004).
45. J. Kopp, T. Schwede, The SWISS-MODEL Repository of annotated three-dimensional
protein structure homology models. Nucleic Acids Res.32, D230-4 (2004).
46. I. Farabella et al., TEMPy: A Python library for assessment of three-dimensional
electron microscopy density fits. J. Appl. Crystallogr.48, 1314–1323 (2015).
47. S. J. Perkins, A. S. Nealis, B. J. Sutton, A. Feinstein, Solution structure of human and
mouse immunoglobulin M by synchrotron X-ray scattering and molecular graphics
modelling. A possible mechanism for complement activation. J. Mol. Biol.221, 1345–