Towards understanding the mechanisms of allostery: the investigation of the relationship between dynamics, structure and function in the model allosteric protein CheY
Leanna Rose McDonald
A dissertation submitted to the faculty of the University of North Carolina at Chapel Hill in partial fulfillment of the requirements for the degree of Doctor of Philosophy in the
Department of Biochemistry and Biophysics
Chapel Hill 2013
ii © 2013
iii ABSTRACT
LEANNA ROSE MCDONALD: Towards understanding the mechanisms of allostery: the investigation of the relationship between dynamics, structure and function in the model
allosteric protein CheY (Under the direction of Andrew Lee)
Allosteric proteins are extremely important in signaling, yet the mechanism(s) of the switch between inactive and active conformations is not clearly understood. It is now widely recognized that dynamics are important to consider for understanding allosteric protein function. Escherichia coli CheY, a response regulator protein from the two-component signal transduction system that regulates bacterial chemotaxis, is an ideal protein for the study of allosteric
mechanisms. Here, we report an NMR relaxation study of dynamics over multiple timescales at both backbone and side-chain sites upon an allosteric response to phosphorylation. By utilizing 15N CPMG relaxation dispersion experiments, we monitored the inherent dynamic switching
of unphosphorylated CheY. We show that unphosphorylated CheY does not undergo a two-state concerted switch between the inactive and active conformations.Interestingly, partial saturation of
Mg2+ enhances the intrinsic allosteric motions. Taken together with chemical shift perturbations, these
data indicate that the s-ms timescale motions underlying CheY allostery are segmental in nature.
iv
relationship between motions on the μs-ms and ps-ns timescales in CheY. Analysis of an activating mutant A113P yields a similar pattern of side-chain ps-ns dynamic changes as upon phosphorylation. This relationship between an activating mutant and an activating pattern of dynamic changes is further evidence for a distinct relationship between the dynamics on multiple timescales and the function of the protein. The allosteric mechanism utilized by CheY highlights the diversity of roles dynamics play in protein function and the complex mechanisms proteins utilize for allostery.
v
vi
ACKNOWLEDGEMENTS
This work would not have been possible without the support and encouragement from a large
number of people. First I would like to thank my advisor, Andrew Lee for giving me the opportunity
to train in his lab. His constant teaching and enthusiasm continuously developed me into a better
scientist. Additionally, the members of the Lee lab, past and present have been there over the years
offering their support, friendship, and providing an environment that allowed me to grow into the
scientist I am today. Josh, Matthew, Chad, Tony, Randy, Mary, Jun, Tina, and Paul each have made
significant contributions that have meant the world to me.
I would not be here had I not spent a summer working in Kevin Gardner’s lab as an
undergraduate. The spark lit that summer has only burned brighter. I also need to thank Barry Lentz
who not only allowed me to study in the biophysics program, but covered my stipend with the
biophysics training grant for two years.
I would like to thank my committee members, Drs. Sharon Campbell, Brian Kuhlman, Bob
Bourret and Ed Collins for their always insightful comments and suggestions at each year’s meeting.
A special thanks to Bob Bourret and his lab including Ruth Silversmith and Bob Immormino for
always being available to discuss CheY. Karl Koshlap and Greg Young were a tremendous help
throughout the years giving technical NMR help. Thank you to Qi Zhang and Jan Hermans for their
vii
Finally I would like to thank my family and friends who have been there along the way,
however incomprehensible this work is to them. My parents always pushed me to do my best and to
figure out my passion. Their unending encouragement gave me the courage to follow this road. And
for my husband, who moved across the country and has never blinked an eye at this crazy journey
viii
TABLE OF CONTENTS
ABSTRACT ... iii
ACKNOWLEDGEMENTS ... vi
LIST OF TABLES ... xii
LIST OF FIGURES ... xiii
LIST OF ABBREVIATIONS AND SYMBOLS ... xv
1 INTRODUCTION ... 1
1.1 Background ... 1
1.1.1 Overview of Protein Allostery ... 1
1.1.2 Dynamics as a basis for protein function ... 2
1.2 CheY as a Model System ... 4
1.2.1 Overview of CheY Function ... 4
1.2.2 Using CheY as a Model Allosteric Protein ... 7
1.3 Methods for Measuring Protein Dynamics ... 9
1.3.1 Spin Relaxation and Molecular Dynamics ... 9
1.3.2 Characterizing ps-ns backbone dynamics using 15N relaxation ... 10
1.3.3 Characterizing ps-ns side-chain dynamics using 2H relaxation ... 12
1.3.4 Characterizing μs-ms backbone dynamics using 15N relaxation dispersion ... 12
1.4 Overview of This Work ... 14
2 SEGMENTAL MOTIONS, NOT A TWO-STATE CONCERTED SWITCH UNDERLIE ALLOSTERY IN CHEY ... 16
2.1 Introduction ... 16
ix
2.2.1 Protein expression and purification ... 19
2.2.2 NMR Spectroscopy ... 20
2.2.3 Preparation of BeFx-bound CheY ... 21
2.2.4 15N CPMG Relaxation Dispersion ... 21
2.2.5 Determination of approximate Rex by relaxation dispersion ... 23
2.2.6 Binding affinity determination of Mg2+ ... 23
2.2.7 Binding affinity determination of FliM ... 24
2.3 Results... 24
2.3.1 Microsecond-millisecond motions are along the allosteric path... 24
2.3.2 Motions measured by relaxation dispersion do not result from a single conformational switch event ... 27
2.3.3 Removal of Mg2+ alters dynamics of unphosphorylated CheY ... 30
2.3.4 Physiological Mg2+ concentrations enhance allosteric dynamics ... 32
2.3.5 Key residues display linear chemical shifts in response to Mg2+ binding ... 35
2.4 Discussion ... 37
2.4.1 Allostery in CheY does not operate by a simple shift of a two-state equilibrium ... 38
2.4.2 Distal quartet of residues directs allosteric conformational change ... 39
2.4.3 A88 links Mg2+ binding to the allosteric quartet ... 42
2.4.4 Effects of Mg2+ on the allosteric dynamics ... 44
2.4.5 Evidence for segmental allosteric dynamics ... 45
2.4.6 Comparison to other systems ... 47
3 COLOCALIZATION OF FAST AND SLOW TIMESCALE DYNAMICS IN THE ALLOSTERIC SIGNALING PROTEIN CHEY... 49
3.1 Introduction ... 49
x
3.2.1 Protein expression and purification ... 51
3.2.2 Preparation of BeFx-bound CheY ... 52
3.2.3 NMR Spectroscopy ... 52
3.2.4 15N CPMG relaxation dispersion ... 53
3.2.5 15N backbone and 2H methyl relaxation... 53
3.2.6 Relaxation analysis ... 54
3.3 Results and discussion ... 55
3.3.1 μs-ms dynamics are dampened and shift toward the FliM binding interface upon phosphorylation of CheY ... 55
3.3.2 Ps-ns dynamics become both more rigid and more flexible upon phosphorylation of CheY ... 58
3.3.3 The largest changes in ps-ns side-chain dynamics are along the allosteric pathway ... 62
3.3.4 Small significant changes in ps-ns side-chain dynamics are in distal regions associated with CheY function ... 64
3.3.5 Correlation of fast and slow motions in CheY... 65
4 ACTIVATION MECHANISM OF ACTIVATING MUTANT A113P CORRELATES FAST AND SLOW DYNAMICS OF CHEY ... 69
4.1 Introduction ... 69
4.2 Materials and Methods ... 71
4.2.1 Protein Expression and Purification... 71
4.2.2 NMR Spectroscopy ... 72
4.2.3 15N CPMG relaxation dispersion ... 72
4.2.4 15N backbone and 2H methyl relaxation... 73
4.3 Results... 73
4.3.1 A113P CheY provides evidence for a two-state equilibrium in CheY ... 73
xi
4.4 Discussion and Conclusions ... 80
4.4.1 Reconciling segmental switching with the two-state shifted equilibrium in A113P ... 80
4.4.2 Activation by A113P and BeFx binding yield similar changes in ps-ns dynamics. ... 82
5 HYDROGEN EXCHANGE USED TO SHOW LONG RANGE INTERACTIONS IN CHEY ... 85
5.1 Introduction ... 85
5.1.1 Long Range Interactions in Allosteric Proteins ... 85
5.1.2 Hydrogen Exchange Theory for Local Free Energy Changes ... 86
5.1.3 Determining Long Range Thermodynamic Couplings with Hydrogen Exchange ... 87
5.1.4 Long Range Thermodynamic Couplings of CheY ... 89
5.2 Materials and Methods ... 90
5.2.1 Protein Expression and Purification... 90
5.2.2 NMR Spectroscopy ... 90
5.2.3 Hydrogen Exchange ... 90
5.3 Results and Discussion ... 91
5.3.1 Hydrogen exchange under standard conditions ... 91
5.3.2 pH dependence of hydrogen exchange in CheY ... 93
5.3.3 GdmCl dependence of hydrogen exchange in CheY ... 94
5.4 Conclusions... 97
6 SUMMARY AND FUTURE DIRECTIONS ... 98
6.1 Allosteric switch between inactive and active conformations ... 98
6.2 Relationship of fast timescale dynamics to CheY’s allosteric function ... 100
6.3 Utilization of preliminary hydrogen exchange results ... 101
xii
LIST OF TABLES
Table 2.1 Local fits of 15N CPMG relaxation dispersion for CheY in the presence of 10 mM Mg2+. ... 27 Table 2.2 Local fits of 15N CPMG relaxation dispersion for CheY in
xiii
LIST OF FIGURES
Figure 1.1 Allosteric conformational change by multiple mechanisms. ... 1
Figure 1.2 Common protein motions and NMR experiments to measure dynamics. ... 3
Figure 1.3 Crystal structure of active CheY. ... 5
Figure 1.4 Conformational change upon phosphorylation in CheY. ... 7
Figure 1.5 Order parameter comparison for backbone and side chains. ... 11
Figure 2.1 15N CPMG Relaxation dispersion data from unphosphorylated CheY in the presence of 10 mM Mg2+. ... 26
Figure 2.2 1H and 15N Chemical shift perturbations (CSPs) were used to determine the dissociation constant of Mg2+ with CheY in the presence of 50 mM NaPi at 15 °C. ... 28
Figure 2.3 15N CPMG Relaxation dispersion data from unphosphorylated CheY in the absence of Mg2+ and presence of 1 mM EDTA. ... 29
Figure 2.4 CSPs upon Mg2+ binding are compared to the distance from Mg2+. ... 31
Figure 2.5 Effect of Mg2+ concentration on Rex. ... 32
Figure 2.6 Approximate Rex for CheY mutant Y106W. ... 34
Figure 2.7 Comparison of the difference between Rex without Mg2+ present (1 mM EDTA) and addition of 1 mM Mg2+ for wild-type and Y106W CheY. ... 34
Figure 2.8 Chemical shift perturbations (CSP) from inactive to BeFx activated CheY. ... 36
Figure 2.9 Binding of FliM peptide to CheY. ... 37
Figure 2.10 Comparison of dihedral angles in crystal structures of CheY. ... 40
Figure 2.11 Cartoon model of the allosteric signaling mechanism in CheY. ... 45
Figure 3.1 Crystal structure of CheY displaying residues involved in the conformational switch. ... 50
Figure 3.2 15N CPMG relaxation dispersion of BeFx-bound CheY at 700 MHz. ... 55
Figure 3.3 Comparison of μs-ms motions between CheY-unP and CheY-P. ... 56
xiv
Figure 3.5 Changes in backbone order parameter upon phosphorylation of CheY. ... 59
Figure 3.6 Methyl side-chain order parameters of CheY-unP. ... 59
Figure 3.7 Difference in ps-ns motions between CheY-unP and CheY-P. ... 61
Figure 3.8 Largest changes in ps-ns dynamics localize to the region of allosteric conformational change. ... 63
Figure 4.1 Location of P113 compared to the site of phosphorylation. ... 70
Figure 4.2 Linear chemical shift perturbations of A113P and WT CheY. ... 74
Figure 4.3 Approximate Rex of A113P and WT CheY. ... 75
Figure 4.4 Crystal structures of A113P-unP and A113P-P. ... 77
Figure 4.5 Backbone ps-ns dynamics of A113P-unP. ... 77
Figure 4.6 Methyl side-chain ps-ns dynamics of A113P-unP order parameter values. ... 79
Figure 4.7 Methyl side-chain ps-ns dynamics of A113P-unP internal correlation time values. ... 80
Figure 4.8 Relative chemical shift of A113P-unP and A113P-P compared to WT. ... 81
Figure 4.9 Comparison of ΔS2axis for A113P-unP – WT-unP and WT-P – WT-unP. ... 82
Figure 5.1 Comparison of double mutant and semi-mutant cycles. ... 88
Figure 5.2 1H-15N NMR spectra of CheY undergoing hydrogen exchange. ... 91
Figure 5.3 Peak intensity change over time during hydrogen exchange. ... 92
Figure 5.4 Dependence of hydrogen exchange rate on pH in CheY. ... 93
xv
LIST OF ABBREVIATIONS AND SYMBOLS A active conformation
A113P-P phosphorylated A113P CheY; typically BeFx-bound CheY A113P-unP unphosphorylated A113P CheY
AIC Akiake information criteria BIC Bayesian information criteria
CheA Chemotaxis protein A; histidine kinase CheY Chemotaxis protein Y; response regulator
CheY-P phosphorylated CheY; typically BeFx-bound CheY CheY-unP unphosphorylated CheY
CheZ Chemotaxis protein Z; phosphatase χ1 first side-chain torsion angle χ2 measure of goodness of fit CSA chemical shift anisotropy CPMG Carr-Purcell-Meiboom-Gill DHFR dihydrofolate reductase
Dy quadrupolar transverse relaxation Dz quadrupolar longitudinal relaxation Δδ difference in chemical shift
FliM flagellar mtor protein; CheY’s target binding partner GdnHCl Guanidinium hydrochloride
HSQC heteronuclear single quantum coherence
HX hydrogen exchange
xvi μs-ms microsecond to millisecond MWC Monod-Wyman-Changeux NMR nuclear magnetic resonance NtrC nitrogen regulatory protein C NOE nuclear Overhauser enhancement PDB Protein Data Bank
ps-ns picosecond to nanosecond
R1 spin-lattice (longitudinal) relaxation R2 spin-spin (transverse) relaxation
Rex transverse relaxation due to conformational exchange R2,eff effective R2
R20 intrinsic R2 rms root mean square RR response regulator S2 order parameter
S2axis order parameter of the methyl symmetry axis τe effective internal correlation time
τe,axis effective internal correlation time of the methyl symmetry axis τcp time between consecutive refocusing pulses in a CPMG train τm rotational correlation time
CHAPTER 1
INTRODUCTION
1.1 Background
1.1.1 Overview of Protein Allostery
Figure 1.1. Allosteric conformational change by multiple mechanisms. The pathway for KNF and MWC allosteric conformational change is indicated by the orange and green arrows, respectively.
Reliable and efficient molecular signaling is an essential function for cellular survival. Signal propagation requires translation and transmission of a signal event into the correct response. In many cases, the signal event is allosteric: a signaling protein receives a signal at a distal effector site that is transmitted to a second site via long-range intramolecular communication. Allostery typically occurs by an initial perturbation to a protein such as ligand binding or chemical modification which usually causes a change in the conformation and leads to a change in function (e.g. catalytic efficiency or binding affinity) at a distal site.
2
allostery has been described by two competing theories in which both have been shown to be accurate descriptions in separate specific cases. In the Koshland-Nemethy-Filmer (KNF) model, a conformational change only occurs upon the initial perturbation in an induced-fit manner (Figure 1.1, orange arrow).1 Conversely, in the Monod-Wyman-Changeux (MWC) model, the protein exists as an equilibrium of conformations in which allosteric perturbation selects a new major conformation in a population shift manner (Figure 1.1, green arrow).2 Furthermore, the KNF model typically describes a sequential pathway between effector and allosteric sites while the MWC model is linked to a concerted conformational change. Recent studies of allosteric proteins have started to support mechanisms which have aspects of both the KNF and MWC model.3-5 This mixed mechanism has been described as an asynchronous population shift for trp RNA-binding attenuation protein (TRAP)3, a “molecular slide
bearing” which allows a range of conformational states in hemoglobin4, and conformational spread in the FliM ring of the flagellar motor.5
1.1.2 Dynamics as a basis for protein function
3
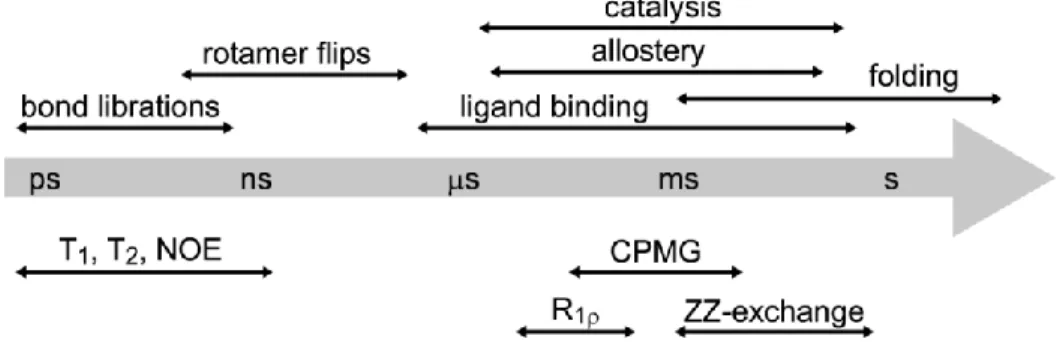
Figure 1.2. Common protein motions and NMR experiments to measure dynamics.
Proteins undergo dynamics over a range of timescales (Figure 1.2), ranging from faster than picoseconds to slower than a second. The motions over every timescale can contribute to a protein’s function. The fastest motions are bond vibrations and librations, and these dynamics are considered to have a large contribution to the entropy of the system.6-10 Motions on a slower timescale (microsecond-millisecond; μs-ms) are those involving
conformational change (e.g. caused by allosteric signaling), ligand binding, and catalysis.11, 12 The slowest motions are typically due to large scale conformational changes such as domain motions and folding/unfolding.
It has been shown that entropic changes to the protein measured by changes in motions on the ps-ns timescale can cause a change in the function of the protein.6, 13, 14 The thermodynamics of every process in a protein is made up of two components: enthalpic and entropic. While the enthalpic contribution is usually straightforward to calculate, the entropic contribution is a challenge and difficult to predict. However, conformational entropy can be measured by NMR techniques7-9 (described below) and has been shown to contribute to ligand binding for calmodulin6, catabolite activator protein14, and a pdz domain.13
4
proteins. For example, the conformations and dynamics of the enzyme dihydrofolate reductase (DHFR) have been well studied.15-18 Wright and coworkers have monitored the switching between the ground and excited state for every step in the catalytic cycle.15, 16 The conformational switching directly correlates with the kinetics measured by other methods. DHFR is only a single example of the numerous proteins that have dynamics on this timescale essential for their function. Specifically, a few allosteric proteins have studies utilizing NMR techniques to monitor dynamics at atomic level resolution including catabolite activator protein19, the KIX domain of the CREB binding protein20, and the PBX1
homeodomain21.
1.2 CheY as a Model System
1.2.1 Overview of CheY Function
5
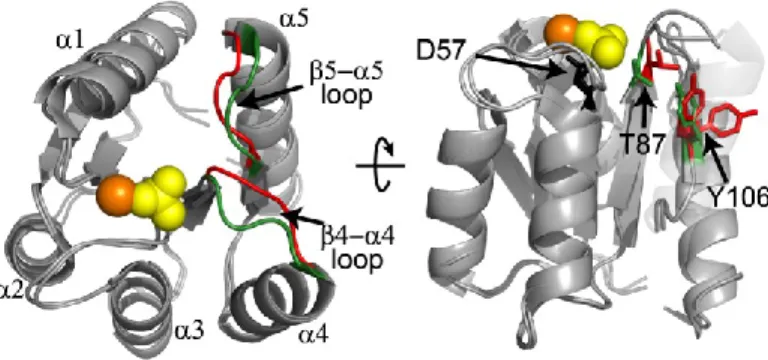
Figure 1.3. Crystal structure of active CheY. BeFx (phosphoryl mimic, yellow)-bound at the site of phosphorylation, D57 and FliM peptide (green)-bound CheY.
Two component systems are prevalent in bacteria and comprise an RR and a sensor kinase. The majority of RRs include both a receiver domain, which contains the site of phosphorylation, and an output domain which contains the target binding site or catalytic region.25, 26 CheY is a RR that is only a single domain homologous to the receiver domains. It is phosphorylated by the histidine kinase, CheA which induces a conformational change and enables CheY to bind the flagellar motor protein FliM.27 The binding of CheY to the flagellar motor causes conformational changes throughout the motor and results in a switch in the flagellar rotation from counterclockwise to clockwise.28
CheY is an important protein in the signaling of E. coli chemotaxis, which allows the bacteria to sense and respond to changes in the chemical environment.29 Through this
6
to continue counterclockwise rotation and therefore smooth swimming. The signaling cascade begins with a receptor sensing the external environment and causing an increase in phosphorylated CheA. CheA then phosphorylates CheY which binds the flagellar motor. The flagellar motor is composed of numerous proteins in a large complex. The portion protruding furthest in the intracellular direction is the C-ring, composed of 35 FliM, 140 FliN, and 25 FliG molecules. The main interaction of CheY is with FliM, but FliN has been shown to have lesser interactions.30 Binding of CheY to FliM is thought to disrupt FliM’s interaction with FliG and cause an important conformational transition to switch flagellar rotation.31 The ability of a cell to quickly signal to change direction is extremely important. It is for this reason that CheY has a rapid autodephosphorylation rate of 2.5 min-1.32 This means it is difficult to study the phosphorylated state and it has become common to utilize BeFx as a phosphoryl mimic.27, 33-35 Lastly, CheY can also be dephosphorylated by the phosphatase CheZ. For both phosphorylation and dephosphorylation, the presence of Mg2+ is required.36
Upon phosphorylation at D57, CheY undergoes a conformational change which allows binding to FliM.27 The largest regions of change in the backbone localize to the β4-α4 and β5-α5 loops (Figure 1.4). The β4-α4 loop moves in an “upward” manner to create space for the rotation of Y106 to an inward position. This rotation of Y106 is an extremely
important switch to the binding-competent conformation since Y106 sterically hinders the binding of FliM when in the “out” position. It has been proposed that the β4-α4 loop motions are coupled with rotation of Y106 to enable the conformational switch.37, 38 A second
7
number of changes in side-chain positioning and rotation noted by comparing the respective crystal structures including K109, F14, E89, W58, and others.
Figure 1.4. Conformational change upon phosphorylation in CheY. Overlay of apo-CheY (red)
and phosphoryl mimic BeFx-bound CheY (green).
1.2.2 Using CheY as a Model Allosteric Protein
8
Other than the comparison to NtrC, currently the allosteric mechanism in CheY is understood through inspections of its conformation by x-ray crystallography and mutational and biochemical characterization. CheY is thought to exist in a pre-existing equilibrium in the unphosphorylated state between the binding-incompetent (inactive; I) and binding competent (active; A) conformations. The ability of unphosphorylated CheY to reach the active conformation is supported by CheY’s ability to bind FliM in the absence of
9
1.3 Methods for Measuring Protein Dynamics
1.3.1 Spin Relaxation and Molecular Dynamics
Fundamental to nuclear magnetic resonance (NMR) spectroscopy is the perturbation of a nuclear spin away from the ground state by a radio frequency pulse. Subsequently, the nuclear spin seeks to return to equilibrium. The rate of spontaneous transition back to the ground state is very slow and therefore these transitions rely on external stimulation. It is this key fact that connects spin relaxation to molecular dynamics; motions at specific frequency are responsible for the relaxation of excited spin states.
The NMR-active nuclei for which spin relaxation is typically measured in biomolecules are 15N, 13C and 2H. For these, there are two main mechanisms by which relaxation is induced: dipole-dipole interactions and chemical shift anisotropy (CSA). The dipole-dipole mechanism results from the reorientation of a bond vector in relation to the static magnetic field. If the reorientation is at the appropriate frequency, relaxation will occur. The second mechanism, CSA, results from the fluctuations in the spatially oriented shielding of a nuclei. Both mechanisms have contributions from overall molecular tumbling and/or local fluctuations of a molecule.
In this work, we measure 15N and 2H relaxation rates, which are for the measure of backbone and methyl side-chain protein dynamics, respectively. For the backbone, spin-lattice (longitudinal) relaxation (R1), spin-spin (transverse) relaxation (R2) with the addition of the 1H-15N nuclear Overhauser enhancement (NOE) are measured utilizing a heteronuclear single quantum coherence (HSQC) type experiment. Similarly, for the side-chains, we
10
The connection between spin relaxation and molecular motions are clear and their relationship is described by the spectral density function, J(ω). The spectral density function describes the probability to excite transitions at a certain frequency, ω, or more precisely, the density of fluctuation for that ω for a given bond vector. If we assume a rigid molecule tumbling isotropically, the spectral density is expressed as
( ) , (1.1)
where τm is the characteristic global tumbling time for the molecule. The faster a protein tumbles in solution, the wider the frequency range available to relax the excited nucleus. Since we know molecules are not completely rigid, we must use a more complex spectral density function and the most common is the Lipari-Szabo “model free” formalism.46, 47 Model-free only assumes that τm >> τe, in which τe is the effective internal correlation time, and the internal and global motions are independent of one another. The model-free spectral density is
( ) ( ( ) ) (1.2)
where S2 is the amplitude of local fluctuations called the order parameter. The value of S2 can vary between 0, no spatial preference and 1, completely rigid. This function can be modified to account for transverse relaxation due to chemical exchange (Rex) and internal motions occurring on two different timescales (S2f and S2s, fast and slow, respectively).
1.3.2 Characterizing ps-ns backbone dynamics using 15N relaxation
Motions of the protein backbone on the ps-ns timescale are monitored by measuring 15N relaxation rates (Figure 1.2) which account for the 15N-1H amide bond vector. As
11
measured. The three 15N relaxation parameters (R1, R2, and {1H}-15N NOE) can be written in terms of the spectral density function:
[ ( ) ( ) ( )] ( )
[ ( ) ( ) ( ) ( ) ( )]
[ ( ) ( )] (1.3)
( ⁄ ) [ ( ) ( )]
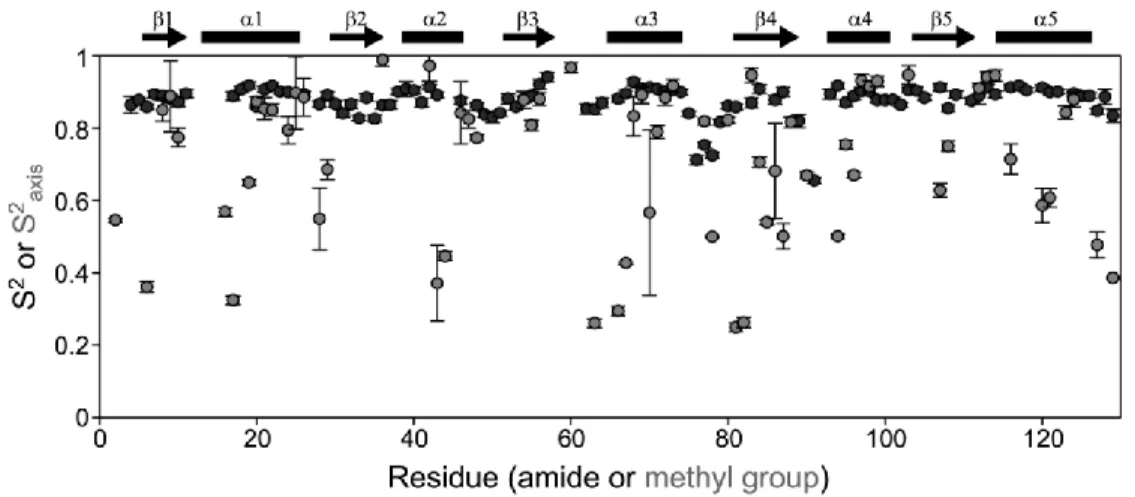
where 〈 ⁄ 〉 and which are the strength of the dipole interaction and a scaling factor related to including the contribution of CSA, respectively; γx is the gyromagnetic ratio for x, is the N-H bond distance, H0 is the strength of the static magnetic field, and Δσ is the anisotropy of the 15N chemical shift tensor. Backbone dynamics parameters are calculated by a search for a minimal difference between experimental and theoretical relaxation values. The backbone is generally very rigid with S2 values between 0.8 and 0.9 with lower values often observed in long loops or termini (Figure 1.5, black circles).
12
(1.4) 1.3.3 Characterizing ps-ns side-chain dynamics using 2H relaxation
To measure dynamics of side-chain methyl groups, 2H relaxation of CH2D groups are made. Dz (longitudinal) and Dy (transverse) relaxation rates are given by
(
[ ( ) ( )])
(
[ ( ) ( ) ( )]),
where e2qQ is the quadrupolar coupling constant. Measurement of the Dy and Dz relaxation rates is possible for the lone 2H of the 13CH2D isotopomer. Knowledge of these rates allow dynamics parameters of the methyl symmetry axis to be obtained: S2axis and τe,axis. The meaning of these parameters and the fitting is the same as for the backbone. These
experiments are only able to characterize terminal methyl groups and therefore, are limited in which amino acids can be measured. In contrast to the backbone, side-chains have a much larger range of order parameter values (Figure 1.5, grey circles) and are very sensitive to perturbation of the protein.
1.3.4 Characterizing μs-ms backbone dynamics using 15N relaxation dispersion
The previous experiments characterize motions on the ps-ns timescale, however slower motions are often critical for protein function. The R2 relaxation is a combination of the intrinsic relaxation rate and the relaxation due to exchange:
. (1.5)
13
exchange on the μs-ms timescale by utilizing HSQC-based experiments. By varying the spacing between 180° pulses (τcp) in the CPMG pulse train, we are to monitor the effect on peak intensity by the dephasing of nuclear magnetization during this period caused by chemical exchange. For a given τcp, the effective R2 (R2,eff) can be calculated by
where I and I0 are the peak intensity with and without the CPMG period, respectively and T is the total time of the relaxation period which is kept constant.
In the simplest case, exchange occurs between two states:
←
→ . (1.6)
Assuming this simple case, R2,eff is dependent on τcp according to the Carver-Richards equation to relate Rex to the kinetic and thermodynamic properties of the chemical exchange:
( ⁄ ) (
[ ( ) ( )])
[ ( ) ⁄ ]
√ [ ( )
⁄ ] ⁄ (1.7)
( )
( )
where kex is the exchange rate ( ), pA (pB) is the population of state A (B),
( ) is the intrinsic R2 of A (B), and Δω is the chemical shift difference between A and B.
14
( ⁄ ) ( ⁄ )
( ⁄ )[ ( ⁄ ) ( ⁄ )] (1.8)
It is important to remember that the Carver-Richards equation and the fast approximation assume the simple case of two site exchange. For more complicated cases, it is simpler to use the Bloch-McConnell equations for fitting to exchange parameters. In principle these
experiments can be applied to any NMR active nuclei, here we solely use 15N relaxation dispersion experiments. For the more complicated case of 3+ state exchange, it is necessary to collect additional experiments for accurate fitting.
1.4 Overview of This Work
In this work, we utilize CheY as a model allosteric protein to increase understanding of the allosteric mechanisms proteins use. While allosteric signaling mechanisms have been studied for decades, there is a lack of information about the molecular dynamics associated with the signaling event. Here we aim to close that gap by studying CheY on a range of timescales while utilizing the immense structural and biochemical information already available for the protein.
15
CHAPTER 2
SEGMENTAL MOTIONS, NOT A TWO-STATE CONCERTED SWITCH UNDERLIE ALLOSTERY IN CHEYA
2.1 Introduction
Allosteric conformational change is critical for the function of many proteins. At the present time, it is not generally understood how allosteric conformational changes are executed or how many different execution strategies exist. As a simpler alternative to defining precise conformational change trajectories, there has been intense focus directed at the “selected fit” versus “induced fit” paradigms49-53, as well as at concerted vs. propagated conformational changes.54, 55 The pairing of selected fit with a concerted conformational change – that is, a simple “switch” – has been particularly popular. It is widely recognized that dynamics are central to these processes, yet there are few experiments that have been carried out to directly assess some of the basic assumptions of allostery. Hence there is a need for experimental dynamics data on the timescale of conformational equilibria in allosteric proteins.
Receiver domains from response regulator (RR) proteins have been studied extensively and, because of their small size, have become favored as models for
understanding conformational allostery. RRs, along with sensor kinases, comprise the two-component system ubiquitous in prokaryotes. RRs usually consist of an input receiver domain that is activated by phosphorylation, and an output domain that transmits the signal
A Published as: McDonald, L. R., Boyer, J. A. & Lee, A. L. (2012). Segmental Motions, Not a Two-State
17
into various activities such as DNA binding.25, 26 Accordingly, the ability of the receiver domain to undergo a well-defined conformational change is a vital component of RR
function.27, 56 The chemotaxis protein Y (CheY) from Escherichia coli is a RR that regulates chemotactic flagellar rotation.22, 23 Because it lacks an output domain, the CheY receiver domain must both accept a phosphoryl group and directly activate its downstream effector; in response to phosphorylation at D5724, which requires the presence of Mg2+36, CheY
undergoes a conformational change that enables it to directly bind the flagellar motor switch protein FliM at a surface distal to D57. CheY binding to FliM promotes a change in the flagellar rotation from counterclockwise to clockwise.28 Unphosphorylated CheY also interacts with FliM, though with considerably reduced affinity.41, 57
As is common in allosteric signaling molecules, CheY samples an active conformation (“A”, FliM binding competent) and an inactive conformation (“I”, FliM binding incompetent). In the I conformation, FliM binding is sterically hindered by the location of Y106 in a solvent exposed or “out” position (Figure 2.1A). Upon activation by phosphorylation, Y106 (~11 Å away from the phosphoaspartate) rotates to the “in”, buried position, relieving the hindrance. T87 hydrogen bonds with the phosphoryl group and has been shown to be an important link for Y106 rotation.27, 58 Motion of the β4-α4 loop, consisting of residues 88-91, facilitates burial of Y10637, 38, leading to the possibility that residues in the loop (in addition to T87) may be involved in the signaling. Together with small changes in the β5-α5 loop and side-chain motions of K109 and F14, the I and A conformations differ mainly in the Y106 rotation and the location of the β4-α4 loop.27
18
conformations, in line with the Monod-Wyman-Changeux (MWC) model of allostery. The following findings provide evidence of an I-to-A state conformational equilibrium: (1) in the absence of phosphorylation, CheY still has the ability to stimulate clockwise flagellar
rotation;41 (2) in the crystal structure of unphosphorylated, Mg2+-free CheY, both “out” and “in” conformations of the Y106 side chain were observed;42 (3) binding of FliM, CheA, and CheZ peptides to CheY affect its ability to phosphorylate and can be explained by a ligand-induced shift of the I-to-A equilibrium;43 (4) NMR studies of the receiver domains of Spo0F and NtrC showed that in regions where structural changes upon phosphorylation were observed, there was enhanced transverse relaxation due to conformational exchange on the μs-ms time scale;39, 59 and (5) mutant NtrC proteins revealed a correlation between
activity/inactivity and a two-state equilibrium between active and inactive conformations.39, 40 While these data are consistent with a state switch of RRs, direct detection of a two-state dynamic process between active and inactive conformations has been elusive.
Complicating the simple idea of a pre-existing equilibrium between I and A conformations are several crystal structures of CheY that show intermediate
conformations.37, 44, 45 Additionally, molecular dynamics simulations indicated that Y106 rotation and the formation of a hydrogen bond between T87 and the phosphoryl group are independent of one another.38 These studies showed that CheY is not restricted to the two end states and taken together suggest that it can be trapped in metastable states that presumably are sampled along the allosteric conformational change trajectory. It is unknown, however, whether such trapped states are functionally relevant or are merely artifacts from
19
In order to further understand the allosteric switch CheY undergoes upon phosphorylation, we investigated the conformational equilibrium that occurs in the
unphosphorylated protein. NMR relaxation dispersion was used to measure the dynamics of CheY switching to test for consistency with a two-state model. We found that a physiological level of Mg2+ likely plays a critical role in promoting allosteric conformational changes. Nevertheless, whether Mg2+ is present or absent, unphosphorylated CheY appears not to undergo two-state concerted switching between I and A conformations. Rather, the data are more suggestive of a model in which CheY switches in a non-concerted, segmental fashion. Local sites may occupy their active conformations at different times utilizing a previously undescribed signaling network consisting of A88 with T87 and the quartet of W58, M85, E89, and Y106.
2.2 Materials and Methods
2.2.1 Protein expression and purification
E. coli CheY DNA (provided by Dr. Bob Bourret, University of North Carolina at
20
(32-36 hours if 2H2O used) at 20 °C. The cells were harvested by centrifugation, resuspended in buffer A (25 mM Tris, 10 mM MgCl2, pH 8.0), and stored at -20 °C until needed.
Resuspended cells underwent three freeze/thaw cycles and sonication. The lysate was then centrifuged at 6000 rpm and dialyzed overnight into buffer A at 4 °C. The protein was purified on a Q Sepharose Fast Flow column equilibrated with buffer A. CheY eluted approximately halfway along a gradient of buffer B (buffer A with the addition of 1.5 M NaCl) from 10 to 55% buffer B over 135 mL. The eluent was passed over either a 50 or G-75 gel-filtration column equilibrated with NMR buffer (50 mM NaPi, 0.02% NaN3, pH 7.0 and an appropriate amount of MgCl2 and/or EDTA). Pure CheY was concentrated to between 1.2 and 3 mM and stored at 4 °C. Concentrations were determined using the extinction coefficient of 10.3 cm-1/mM60 and 14.3 cm-1/mM for wild-type and Y106W CheY, respectively.
2.2.2 NMR Spectroscopy
21
titration with Mg2+. All NMR data were processed using NMRPipe62 and visualized with NMRDraw and NMRView.63
2.2.3 Preparation of BeFx-bound CheY
NMR samples of BeFx-bound CheY were prepared with high enough concentrations of BeCl2 and NaF to ensure saturation of CheY and in an ideal ratio for a BeF3- complex. The samples were prepared by first combining all components of a typical unphosphorylated CheY sample (e.g. 1 mM CheY protein, 10 mM MgCl2, 10% D2O). Then BeCl2 and lastly NaF were added to a final concentration of 4 mM and 25 mM, respectively. The samples were then left at room temperature overnight and centrifuged briefly before transferring to an NMR tube.
2.2.4 15N CPMG Relaxation Dispersion
Relaxation dispersion experiments were carried out using relaxation-compensated CPMG experiments.64 Most experiments were collected with a 40 ms total CPMG period and one with 20 ms. 12 or 13 τcp values with 2 duplicates and a reference experiment were
22
By fitting the dependence of R2,eff on 1/τcp, the exchange rate (kex), populations (pI, pA), and chemical shifts (Δω) were determined. Data from two and three field strengths were fit simultaneously for 1 mM EDTA and 10 mM Mg2+, respectively, using the in-house program exrate2.0. Errors were estimated by Monte Carlo simulation.
In the limit of fast exchange, equation 2.3 can be used to fit dispersion curves.48 Residues were also fit to this equation to assess appropriateness of the Carver-Richards equation. For many of the slower residues, the simplified fast equation did not give the same fit as the Carver-Richards equation and therefore we decided the latter was needed to
distinguish the best parameters.
Fitting all of the residues together to the same kex and pI or “group fitting” was done in the same manner as previously described.17, 65 In order to justify group fitting, χ2group/ χ2local ≤ 2 where χ2local is the χ2 when a residue is locally fit and χ2group is the χ2 of the same residue when group fit. If necessary, the residue with the highest ratio is removed and the group fitting is attempted again. For CheY, the attempt to group fit resulted in elimination of all residues partly due to the high quality of data.
After all fitting was complete, two residues (G39 in 10 mM Mg2+ and D13 in 1 mM EDTA) were determined to have errors that were too large to be accurately fit. Visual inspection revealed both of the peaks to be extremely broad in the 1H-15N HSQC. Therefore, these residues undergo motions but are unable to be fit due to high error in the intensity measurements. These residues were removed from any further quantitative interpretation of the data.
23
data. These preliminary fits yielded individual three-state parameters that were diverse. Nevertheless, using an F-test (αcritical = 0.05), three residues (A36, T87, and E89) in 10 mM Mg2+ fit better to a three-state model than a two-state model. In 1mM EDTA, no residues showed improvement with a three-state fit. Additionally, group fitting to a three-state model did not provide significant statistical improvement. This suggests that CheY is not
functioning as a three-state concerted switch.
The sign of Δω was determined from comparison of peak positions in the HSQC and HMQC spectra.66
2.2.5 Determination of approximate Rex by relaxation dispersion
An estimate of Rex can be obtained by using a very low and a very high 1/τcp, as long as the rate of exchange is less than ~5000 s-1. We used the same experimental set-up as used for measuring full relaxation dispersion curves (as described above) except only two τcp values, 10.0 ms and 0.556 ms were employed. A 40 ms total relaxation time (T) was used and all Rex estimates were made at 15 °C. Rex was calculated from the peak intensities for each plane using
(2.1)
in which I is the peak intensity for the given τcp value.
2.2.6 Binding affinity determination of Mg2+
24
buffer exchanged into NMR Buffer with 1 mM EDTA and then buffer exchanged into NMR buffer without EDTA or Mg2+. Residues were only included in the analysis if the change in chemical shift between the highest and lowest Mg2+ concentrations was greater than one standard deviation above the average. Therefore, 10 and 9 residues were used for the Kd calculation of wild-type and Y106W CheY, respectively. Residues were individually fit assuming a single binding site, and the reported Kd is the average. Error was estimated from Monte Carlo simulations. We measured the wild-type Kd to be 1.5 ± 0.3 mM which is near to other reported values of 1.0 ± 0.2 mM67 and 0.45 ± 0.03 mM.36 The binding affinity of Mg2+ to the CheY mutant Y106W was measured in the same manner and was also found to be 1.5 ± 0.3 mM.
2.2.7 Binding affinity determination of FliM
Binding of CheY to the FliM peptide (MGDSILSQAEIDALLN) was measured by fluorescence similar to the procedure previously described.43 CheY in NMR buffer at 10 μM was titrated with concentrated FliM peptide in NMR buffer. Phosphorylated CheY was measured using CheY in the presence of 10 mM MgCl2 and approximately 50 mM Phosphoramidate. All binding experiments were performed at 15 °C.
2.3 Results
2.3.1 Microsecond-millisecond motions are along the allosteric path
25
relaxation dispersion experiments to measure motions on this timescale.48 These experiments elucidate processes on the s-ms timescale that contribute to broadening (or “width”) of NMR peaks. Specifically, the NMR line width is proportional to the transverse relaxation rate, R2, which is comprised of an “intrinsic” rate, R2, and a rate that arises from
conformational exchange processes on the s-ms timescale, Rex:
. (2.2)
The CPMG relaxation dispersion experiment measures the suppression of Rex contributions to R2 as a function of spacing between 180 pulses in the CPMG train, cp.64 For a two-state exchange process in the limit of fast exchange on the NMR timescale,
( ) ( ) [
( )
] , (2.3)
where pI and pA are populations of the major and minor states, is the difference in
chemical shift between the two states, and kex is the rate of exchange between I and A (= k1 + k-1). A longer expression (the Carver-Richards equation) exists for the general case.48 A particular residue’s Rex value is considered to be non-zero (i.e. affected by conformational
exchange) if Rex > 2 s-1, as described in the Materials and Methods.
26
Y106 and V107 (Figure 2.1A). This was not surprising since all substantial conformational differences between the I and A states are limited to this region.27 There were no non-zero
Rex values elsewhere in the protein,
detected either by CPMG relaxation dispersion or by model-free analysis of T1, T2, and {1H}-15N NOE data.
Therefore, at a qualitative level, these data are consistent with motion corresponding to the I-to-A transition.
Figure 2.1. 15N CPMG Relaxation
dispersion data from unphosphorylated CheY in the presence of 10 mM Mg2+. (A) Structure of unphosphorylated CheY using 3CHY with the side-chain orientation of D57 and Mg2+ location from 2CHE. Residues with non-zero Rex values at 10 mM Mg2+ are displayed as blue spheres. Black indicates residues that are too broad to be measured. Highlighted in yellow are Y106 and the site of phosphorylation, D57. For Y106, the “in” rotamer indicates active and “out” indicates inactive CheY. (B) Raw CPMG dispersion curves are displayed for 6 example residues at 700 MHz (blue), 600 MHz (red) and 500 MHz (green). Lines are local fits to the Carver-Richards equation with parameters given in Table 1. (C) Δω values from local fits of relaxation dispersion are plotted against Δδ using the difference between
unphosphorylated CheY and BeFx-bound CheY both with 10 mM Mg2+. Δδ was determined using
,
where to get the final Δδ value we made an additional adjustment. Since
unphosphorylated CheY is not completely inactive and BeFx-bound CheY is not
27
Table 2.1. Local fits of 15N CPMG relaxation dispersion for CheY in the presence of 10 mM Mg2+.
Residue kex (s-1) Δω (ppm) pI R2° (s -1)
500 MHz
R2° (s-1)
600 MHz
R2° (s-1)
700 MHz χ
2
12 1220 ± 50 1.5 ± 0.1 0.94 ± 0.01 13.3 ± 0.3 13.9 ± 0.2 14.6 ± 0.1 4.0 36 1910 ± 300 0.52 ± 0.04 0.91 ± 0.02 13.1 ± 0.2 13.2 ± 0.1 14.1 ± 0.1 2.6 38 1370 ± 70 1.7 ± 0.1 0.95 ± 0.01 14.0 ± 0.4 14.3 ± 0.2 15.1 ± 0.2 46 62 2060 ± 180 2.7 ± 0.1 0.99 ± 0.01 12.0 ± 0.1 12.2 ± 0.1 13.1 ± 0.1 0.75 64 3620 ± 460 6.0 ± 0.6 0.99 ± 0.01 13.7 ± 0.5 13.0 ± 0.6 13.8 ± 0.7 5.3 86 2100 ± 330 3.6 ± 0.2 0.99 ± 0.01 15.1 ± 0.3 15.5 ± 0.2 16.9 ± 0.2 13 87 1370 ± 180 1.8 ± 0.2 0.98 ± 0.01 15.3 ± 0.4 14.8 ± 0.3 16.6 ± 0.2 3.6 88 1230 ± 280 1.4 ± 0.4 0.91 ± 0.04 20.1 ± 1 20.2 ± 0.9 21.0 ± 0.8 14 89 246 ± 31 3.2 ± 0.5 0.99 ± 0.01 14.5 ± 0.3 15.8 ± 0.2 17.5 ± 0.1 2.9 106 3100 ± 410 2.0 ± 0.1 0.99 ± 0.01 16.4 ± 0.2 17.1 ± 0.2 18.5 ± 0.2 4.5 107 2840 ± 380 4.2 ± 0.4 0.99 ± 0.01 17.6 ± 0.3 17.7 ± 0.3 19.3 ± 0.4 5.5
2.3.2 Motions measured by relaxation dispersion do not result from a single conformational
switch event
28
Figure 2.2. 1H and 15N Chemical shift perturbations (CSPs) were used to determine the dissociation constant of Mg2+ with CheY in the presence of 50 mM NaPi at 15 °C. (A) The 10 residues (11, 17, 21, 36, 38, 64, 86, 87, 88, 107) considered for analysis are plotted with their
individual fit. CSPs were calculated using √ ( ) . (B) An example residue, 17, displays a perturbation due to the Mg2+ binding.
Yet another test for two-state behavior is to compare the dispersion-based differences in chemical shifts to known differences in chemical shifts for two defined structural states. Accordingly, we compared Δω from the local fits of relaxation dispersions to Δδ from the chemical shift perturbations between unphosphorylated and BeFx-bound (phosphoryl mimic33) CheY. A poor correlation between Δω and Δδ was obtained (Figure 2.1C), further indicating that the I-to-A transition cannot be described by a simple two-state transition.
29
Figure 2.3. 15N CPMG Relaxation
dispersion data from unphosphorylated CheY in the absence of Mg2+ and presence of 1 mM EDTA. (A) Similar to Figure 2.1, residues with non-zero Rex
30
Table 2.2. Local fits of 15N CPMG relaxation dispersion for CheY in the presence of 1 mM EDTA
2.3.3 Removal of Mg2+ alters dynamics of unphosphorylated CheY
Another possible source of non-zero Rex values in CheY and other RRs is the
reversible binding of Mg2+. A divalent metal ion is necessary for all RR phosphorylation and dephosphorylation.36 In the experiments described in the previous section, near physiological concentrations of Mg2+ (10 mM) were used to characterize CheY in an environment similar to inside of cells and to have consistency with previous biochemical and NMR work on CheY.61, 68 Because the binding affinity of Mg2+ to CheY is 1.5 ± 0.3 mM under our
conditions (determined by NMR 1H-15N HSQC peak shifts, Figure 2.2), at 10 mM Mg2+ and 1 mM CheY, 86% of CheY is bound by the ion. Thus, if the Mg2+ binding kinetics are on the appropriate timescale, the binding of Mg2+ and associated side-chain rearrangements could be detected by relaxation dispersion and this could complicate the interpretation in terms of conformational exchange.
To separate motions associated with Mg2+ binding and release from those intrinsic to CheY, we carried out relaxation dispersion experiments without Mg2+ present (i.e., with 1 Residue kex (s-1) Δω (ppm) pI R2° (s
-1)
600 MHz
R2° (s-1)
700 MHz χ
2
18 288 ± 57 3.9 ± 0.7 0.99 ± 0.01 15.7 ± 0.3 17.0 ± 0.3 2.9 19 180 ± 30 5.7 ± 1 0.96 ± 0.01 16.1 ± 0.7 17.4 ± 0.9 7.6 36 2400 ± 500 0.6 ± 0.1 0.86 ± 0.04 13.3 ± 0.2 14.1 ± 0.3 2.6 38 2360 ± 640 3.6 ± 0.4 0.99 ± 0.01 14.0 ± 0.5 15.8 ± 0.7 4.3 62 1820 ± 520 3.7 ± 0.4 0.99 ± 0.01 13.4 ± 0.4 13.8 ± 0.7 11
64 96 ± 16 9.4 ± 1 0.80 ± 0.04 20.0 ± 1 22.2 ± 2 13
31
mM ethylenediaminetetraacetic acid, EDTA). In the absence of Mg2+, 13 residues displayed non-zero Rex values for CheY, compared to 11 when Mg2+ is present at 10 mM. These residues are localized to the FliM binding interface or the active site (Figure 2.3A) just as when Mg2+ is present (Figure 2.1A). The locally fit parameters, when assuming a two-state mechanism, are diverse (Figure 2.3B and Table 2.2). In comparison with dynamics in the presence of Mg2+, many of the same residues display significant dispersion, including T87 and V107. The locally fit parameters of the common residues differ significantly between the Mg2+-free and Mg2+-present conditions (Tables 2.1 and 2.2). Additionally, Δω and Δδ do not correlate (Figure 2.3C), as was the case with Mg2+ (Figure 2.1C). Therefore, even without the potentially complicating effects of Mg2+, CheY appears not to undergo two-state switching.
.
Figure 2.4. CSPs upon Mg2+ binding are compared to the distance from Mg2+. The distance indicated by the black line is from the Mg2+ ion bound to CheY (location from 2CHE) to the backbone Cα of the specified residue. The CSP indicated by blue bars was calculated with the same equation as figure 2.2 using ΔHN and ΔN between CheY in the absence of Mg2+ (i.e. 1 mM EDTA) and CheY in the presence of 75 mM Mg2+.
32
general are small in regions of allosteric conformational change (Figure 2.4), suggesting no significant structural rearrangements. In addition, the crystal structure of Salmonella
typhimurium CheY70 (which differs by 3 amino acids from E. coli) and the NMR structure of E. coli CheY61, both with Mg2+ present, have no indication of any large structural
rearrangement. For these reasons, the different CheY dynamics observed with or without Mg2+ do not appear to be the direct result of Mg2+-induced conformational change.
Figure 2.5. Effect of Mg2+ concentration on Rex. Rex is approximated by the change in R2,eff of two CPMG relaxation dispersion planes. Approximate Rex is shown for CheY in the presence of 1 mM EDTA (blue), 1 mM Mg2+ (red), 10 mM Mg2+ (green), and 75 mM Mg2+ (black) for all residues with non-zero Rex values at 1 mM Mg2+. Residues G39 and A88 are broadened away at 1 mM Mg2+ presumably from exchange, indicated by *. Also, there are no data for Y106 at 1 mM Mg2+ and V108 at 1 mM EDTA because of peak overlap.
2.3.4 Physiological Mg2+ concentrations enhance allosteric dynamics
33
dispersion measurements. Overall, the dependence of Rex on the concentration of Mg2+ is immediately apparent: Rex in the presence of no Mg2+ or very high concentration of Mg2+ (75 mM) is relatively low, and Rex at intermediate levels of Mg2+ (1 mM) is very high (Figure 2.5). Furthermore, peak broadening was evident in many residues at intermediate Mg2+ concentrations, implying increased motion. While high Rex levels at intermediate concentrations of Mg2+ are expected for residues in close proximity to the bound ion
(assuming appropriate line-broadening kinetics), high Rex levels are not expected at residues distal to Mg2+ that are not structurally affected by the ion, such as on the FliM binding interface. Yet, Rex at V107 is quite pronounced (28 s-1) at 1 mM Mg2+. We note that Mg2+ binding induces a small chemical shift change of 0.52 ppm for the amide nitrogen of V107 (Figure 2.4), especially compared to the large chemical shift change of 8.6 ppm brought about by binding of BeFx. Furthermore, A88 experiences extreme line broadening at intermediate concentrations of Mg2+. The dispersion experienced at this position is larger than expected when compared to neighboring residues. Thus, there is something particular about partial Mg2+ saturation that increases conformational dynamics at A88 and even further at the FliM binding interface more than 10 Å away.
34
Figure 2.6. Approximate Rex for CheY mutant Y106W. Shown in blue is approximate Rex in the absence of Mg2+ (1 mM EDTA) and in red is in the presence of 1 mM Mg2+. Rex is approximated in the same manner as Figure 2.5. Additionally, residues are the same as in Figure 2.5 with two additional residues, L68 and K109, that have Rex > 2 s-1 for Y106W but not wild-type CheY. Furthermore, E89 is not displayed because of overlap in the Y106W spectra and L66 is displayed even though it was not in the wild-type because of overlap in the wild-type spectra.
Figure 2.7. Comparison of the difference between Rex without Mg2+ present (1 mM EDTA) and addition of 1 mM Mg2+ for wild-type and Y106W CheY. The change in approximate Rex upon addition of Mg2+ (ΔR
35
Mg2+ to wild-type (Figure 2.6). In comparing the quantitative effect Mg2+ has on wild-type and Y106W CheY, we notice a significant difference. Residues that are close to the Mg2+ binding site are extremely similar in their Rex dependence on Mg2+ for wild-type and Y106W (Figure 2.7, shaded yellow). However, residues that are far from the bound Mg2+ ion and are involved in the allosteric transition depend differently on Mg2+ for wild-type and Y106W (Figure 2.7, shaded green). Since the effect due to Mg2+ is the same for wild-type and Y106W CheY at residues near to the bound ion, the difference in Rex far from Mg2+ must be due to a change in the I-to-A transition. Therefore, enhanced Rex at intermediate
concentrations of Mg2+ are not merely caused by Mg2+ binding and release but due to a change in the motions associated with the I-to-A transition.
Importantly, the difference in Rex far from Mg2+ is due to a change in the I-to-A transition without significant changes to the structure of the ground state (see above), even though phosphorylation – which occurs at nearly the same location as Mg2+ binding – induces a large structural change. The Mg2+ concentration’s effect on the I-to-A transition is likely biologically relevant since Rex is largest at intermediate concentrations of Mg2+ (1 mM); this concentration is close to the Kd for Mg2+ and CheY (1.5 mM), and also close to the concentration of Mg2+ in E. coli (~1-2 mM Mg2+72).
2.3.5 Key residues display linear chemical shifts in response to Mg2+ binding
We observed that, for Y106, V107, and E89, the NH chemical shifts move along a line for various states of CheY, which include apo, BeFx-bound, inactive mutant T87I CheY73, and activated mutant A113P CheY74 (Figures 2.8A, 2.8B, and 2.8C). Linear
36
Figure 2.8. Chemical shift perturbations (CSP) from inactive to BeFx activated CheY. Overlaid 1H-15N HSQCs are shown with peaks highlighted for (A) E89, (B) Y106, and (C) V107 from various conditions and mutants of CheY: inactivating mutant T87I with 10 mM Mg2+ (green), wild-type with 1 mM EDTA (blue), wild-type with 10 mM Mg2+ (red), activating mutant A113P with 10 mM Mg2+ (orange), BeFx-bound wild-type with 10 mM Mg2+ (purple) and BeFx-bound A113P with 10 mM Mg2+ (pink). (D) To display all residues, CSP is normalized according to inactivating mutant T87I with 10mM Mg2+ (green) and BeFx-bound wild-type CheY (purple). Each circle represents the normalized CSP of each residue of wild-type CheY in the presence of 10 mM Mg2+ (red) and 1mM EDTA (blue).
Residues are only shown if √ ( ) was greater than 0.20 where ΔHN and ΔN are between T87I and wild-type BeFx-bound CheY. If ppm or ppm, the chemical shifts are considered within error in that dimension and the residues were removed. Therefore, while V107 appears linear, it is not shown in (D) since the proton shift is < 0.06 ppm.
receiver domain of the NtrC RR.39 To test whether linear shifts were observed throughout CheY, we plotted all Mg2+-induced CSPs on a normalized vector scale (Figure 2.8D). If Mg2+ shifts this equilibrium, all chemical shifts should fall along the dotted line from inactive mutant T87I to BeFx-bound wild-type CheY. However, with a few exceptions, the CSPs distribute essentially randomly, with no apparent preferred “direction”. Thus, it appears that, overall, Mg2+ binding elicits either a new conformational state(s) that has only subtle
37
Interestingly, additional residues that fall near the line (Figure 2.8D, M85, A97 and A98) lie in the pocket surrounding W58. These residues, along with Y106 and E89, may experience a shift in conformation due to the presence of Mg2+ (discussed below).
Figure 2.9. Binding of FliM peptide to CheY. Intrinsic fluorescence was monitored upon addition of FliM under conditions of no Mg2+ (red), 10 mM Mg2+ (black) and 10 mM Mg2+ with 50 mM small molecule phosphodonor, phosphoramidate (green).
2.4 Discussion
For half a century now, allosteric conformational change has been revealed to be an extremely successful mechanism for regulating protein function. Yet, key specific questions regarding allostery have yet to be answered. Is the conformational change concerted? Are there structural intermediates? What are those intermediates? What is the dynamic process that allows conversion between the end conformations and how is it triggered? In summary, we still have a poor understanding of how allosteric conformational changes actually happen. By conducting in-depth NMR experiments on the small allosteric protein CheY, we hoped to gain new insights into the mechanism(s) of allostery. CheY is an excellent system for
38
rich complement of residues with μs-ms motion at residues that connect the physically separated upstream and downstream effector sites.
2.4.1 Allostery in CheY does not operate by a simple shift of a two-state equilibrium
From previous crystallographic, NMR, and functional data39, 40, 59, 75, the evidence suggests that receiver domains primarily adopt two conformations and hence allostery is achieved by shifting a pre-existing dynamic equilibrium between these two states, consistent with the MWC model of allostery. Based on this previous work on NtrC, FixJ, and Spo0F, and our initial observation here of Rex in the allosteric network of residues, the simplest expectation would be that CheY undergoes a concerted switch between I (inactive) and A (active) conformations. Here, we show using NMR relaxation dispersion that intrinsic allostery in CheY does not appear to operate by a simple shift of a two-state equilibrium. This conclusion rests, in part, on the ability of relaxation dispersion experiments to accurately identify conformational exchange rates and populations.
39
case, if the observed Rex values result only from unphosphorylated CheY switching
concertedly to an intermediate state, one would still expect kex and populations to be uniform, yet they are not.
2.4.2 Distal quartet of residues directs allosteric conformational change
40
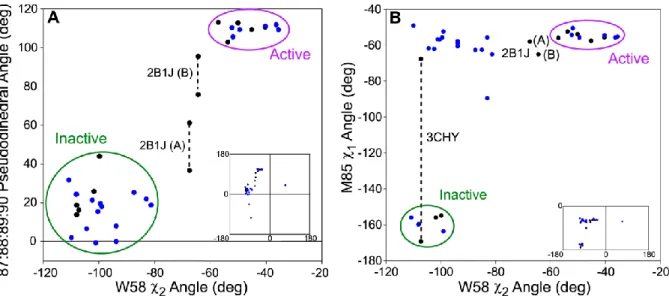
Figure 2.10. Comparison of dihedral angles in crystal structures of CheY. (A) Comparison of the 87:88:89:90 pseudodihedral angle with the rotation of W58 and (B) comparison of M85 χ1 angle with the rotation of W58. The pseudodihedral angle was measured using Cα coordinates. In black are wild-type CheY crystal structures (1FQW, 1F4V, 2B1J, 1JBE, 3CHY, 2CHE, and 1C4W) and in blue are mutant or CheA-bound CheY crystal structures (only single site mutations and >2.5 Å resolution, full list is provided in Table 2.3). Insets are the full range of angles occupied while large plots are zoomed on the majority of crystal structures.
While E89, Y106, and V107 have the most linear chemical shifts, a few residues are nearly linear (M85, A97, and A98) while all others show no semblance of linearity. M85, A97, and A98 have not been discussed previously as part of the allosteric mechanism. Yet, these residues line the pocket occupied by W58 and are proximal to the β4-α4 loop and Y106. Examination of CheY in its inactive (3CHY42), active (1FQW27), and intermediate conformations (2B1J44) reveals an extended set of conformational interactions. Upon
activation, the hydroxyl of Y106 hydrogen bonds to the backbone carbonyl of E89, which is allowed by movement of the β4-α4 loop. What appears to further stabilize this interaction is a large movement of the E89 side chain towards the side chain of W58, resulting in
hydrophobic contacts between the methylene groups of E89 and the tryptophan indole. Interestingly, superimposition of inactive and active CheY structures shows that the
41
only to FliM peptide) shows the indole at an intermediate angle. Although tryptophan at position 58 is not conserved amongst RRs, the receiver domain from PhoB displays a similar rotation of ~60° upon binding BeFx.77, 78 When analyzing a range of crystal structures, we find that the angle of the W58 indole correlates with the pseudodihedral angle 87:88:89:90 (Figure 2.10A). This pseudodihedral angle has been used to indicate the location of the β4-α4 loop44. In order to contact E89, W58 increases its distance from M85, which is associated with W58 in the inactive conformation. Thus, M85 and E89 appear to be in competition for W58, with E89 making contact only in the active conformation. In further support of this extended mechanism, we note that in 3CHY, M85 was found to occupy two conformations (similar to Y106), of which only one is adopted in the intermediate and active conformations and the other is adopted in other crystal structures of the inactive state (Figure 2.10B).
Additional crystal structures reveal that M85 often occupies the “active” rotamer even though W58 has not rotated to the active state (Figure 2.10B). This indicates that W58 is not as robustly coupled to M85 as the β4-α4 loop. However, one should be cautioned not to overinterpret the lack of coupling between M85 and W58; since the two M85 side-chain conformations have similar electron density, this leads to the possibility that the crystal structures did not accurately account for multiple conformations. We also note that the amide of W58 could not be assigned, which is consistent with its indole sampling at least two conformations prior to full activation. We propose here that the quartet of W58, M85, E89, and Y106 are coupled, as a key component of the allosteric signaling process from
42
Table 2.3. List of crystal structures and angle measurements used for Figure 2.10.
PDB Code Mutation and/or
ligand bound Pseudodihedral 87:88:89:90 (deg)
M85 Chi1
(deg) W58 Chi2 (deg)
1JBE (A)37 WT 18.7 -159.6 -108
1JBE (B) WT 13.8 -159.6 -108
3CHY (A)42 WT 16.2 -67.7 -107.2
3CHY (B) WT 16.2 -169.3 -107.2
2CHE70 WT Mg2+S. typhimurium 25.8 -155.9 -101.8
1C4W79 Phosphono - WT 43.9 -154.9 -99.8
1F4V (A)34 WT BeF3-, FliM & Mg2+ 112.8 -54 -50.13
1F4V (B) WT BeF3-, FliM & Mg2+ 102.9 -52.4 -53.8
1F4V (C) WT BeF3-, FliM & Mg2+ 113.1 -56 -57.2
1FQW (A)27 WT BeF
3- & Mn2+ 109.3 -57.6 -45.22
1FQW (B) WT BeF3- & Mn2+ 110.6 -55.6 -40.35
2B1J (A-A)44 WT FliM & Mg2+ 61.2 -58 -67.5
2B1J (A-B) WT FliM & Mg2+ 36.6 -58 -67.5
2B1J (B-A) WT FliM & Mg2+ 95.5 -65.1 -64.4
2B1J (B-B) WT FliM & Mg2+ 75.8 -65.1 -64.4
1D4Z80 I95V 24.3 -159.9 -108.1
5CHY71 Y106W & Ca2+ 31.7 -155.9 -110.8
1EHC (A)81 D13K 18 -163.6 -99
1EHC (B) D13K 18 -52.4 -99
3OO1 (A) A113P & Mg2+ 19.5 -55.8 -99.5
3OO1 (B) A113P & Mg2+ 7.95 -57.8 -93.8
1E6M82 D57A 18.8 -65.1 -81.3
2ID7 (A)83 Phosphono - T87I 21.9 -89.5 -83
2ID7 (B) Phosphono - T87I 21.9 -55.8 -83
1VLZ (A)73 T87I 21.3 -62.1 -102.4
1VLZ (B) T87I 2.03 -49.1 -109.9
1E6L82 D13A 40.3 -62 69.8
1E6K82 D12A -105.9 -62.6 -85
3OO0 (A-A) A113P SO4 & Mn2+ 110.3 -54.3 -52.3
3OO0 (A-B) A113P SO4 & Mn2+ -0.05 -60.6 -93.8
3OO0 (A-C) A113P SO4 & Mn2+ -45.1 -58.8 -93.8
3OO0 (B) A113P SO4 & Mn2+ 109.3 -55.8 -49.5
3OLV (A) A88V BeF3- & Mg2+ 105.6 -50.6 -51.9
3OLV (B-A) A88V BeF3- & Mg2+ 109.2 -55.3 -35.6
3OLV (B-B) A88V BeF3- & Mg2+ 109.3 -55.3 -35.6
3MYY (A) A113P BeF3- & Mn2+ 111.1 -54.5 -40.3
3MYY (B) A113P BeF3- & Mn2+ 111.8 -55.8 -36.4
1FFG (A)84 WT CheA & Mn2+ 15.4 -56.9 -100.4
1FFG (C) WT CheA & Mn2+ -0.7 -56.8 -101.1
1FFS (A) WT CheA, PO4 & Mn2+ 25.3 -62.7 -87.4
1FFS (C) WT CheA, PO4 & Mn2+ 6.5 -61.8 -104.4
2.4.3 A88 links Mg2+ binding to the allosteric quartet
43
unclear whether additional residues play a crucial role and which residues may sense Mg2+. A88, in addition to T87, also hydrogen bonds with the phosphoryl group via its backbone amide. Perhaps most importantly, from the relaxation dispersion data in 10 mM Mg2+, A88 fit to parameters unlike any other residue. While most residues fit to populations (pI) of 0.98-0.99, A88 fit to 0.91. Furthermore, its dispersion curve visually resembles residues 12 and 38, which are near to the bound Mg2+ ion, more than the allosteric residues 87, 89, 106, and 107 (Figure 2.1B). Careful inspection of the fit to A88 indicates that its R2° values are anomalously high and the quality of the fits is significantly lower than the other residues (Table 2.1). Thus, we suspect that in addition to the motion that gives rise to the main part of A88’s dispersion curve, there is a separate, faster motion on the μs timescale. Only A88 appears to have this more complex combination of motions. Furthermore, A88 experiences line broadening severely affected by the concentration of Mg2+. At 1 mM Mg2+, A88 is completely broadened away in the 1H-15N HSQC. Given its behavior at different Mg2+ concentrations, A88 may be especially sensitive to Mg2+ binding and release.
We therefore hypothesize that A88 acts as a crucial monitor of ion binding and/or phosphorylation at the active site. It is important to note that, even though they are adjacent, residues 86-89 have different exchange parameters. Therefore, at face value these residues appear largely independent. Nevertheless, because these residues lie within the allosteric pathway and all show motion on the μs-ms timescale, we suggest that in addition to T87, A88 provides a linkage to E89, and that the recruitment of W58 by E89 represents a key step in switching the β4-α4 loop. Given these considerations, we propose that the allosteric