AJSLP
Research Article
Perceptually Salient Sound Distortions and Apraxia
of Speech: A Performance Continuum
Katarina L. Haley,aAdam Jacks,aJessica D. Richardson,band Julie L. Wambaughc,d
Purpose:We sought to characterize articulatory distortions in apraxia of speech and aphasia with phonemic paraphasia and to evaluate the diagnostic validity of error frequency of distortion and distorted substitution in differentiating between these disorders.
Method:Study participants were 66 people with speech sound production difficulties after left-hemisphere stroke or trauma. They were divided into 2 groups on the basis of word syllable duration, which served as an external criterion for speaking rate in multisyllabic words and an index of likely speech diagnosis. Narrow phonetic transcriptions were completed for audio-recorded clinical motor speech evaluations, using 29 diacritic marks.
Results:Partial voicing and altered vowel tongue placement were common in both groups, and changes in consonant manner and place were also observed. The group with longer word syllable duration produced significantly more distortion and distorted-substitution errors than did the group with shorter word syllable duration, but variations were distributed on a performance continuum that overlapped substantially between groups.
Conclusions:Segment distortions in focal left-hemisphere lesions can be captured with a customized set of diacritic marks. Frequencies of distortions and distorted substitutions are valid diagnostic criteria for apraxia of speech, but further development of quantitative criteria and dynamic performance profiles is necessary for clinical utility.
This special issue contains selected papers from the March 2016 Conference on Motor Speech held in Newport Beach, CA.
S
egmental speech sound errors are common sequelae of left-hemisphere focal lesions and often affect speech output for people with aphasia. Diverse qualities are observed, some of which are considered im-portant for differential diagnosis between apraxia of speech (AOS) and aphasia accompanied by phonemic paraphasia (APP).1Because AOS is conceptually defined as a phonetic-motor speech disorder, it is expected to influence listeners’ perception of not only phonemic variation but also finer subphonemic detail and suprasegmental qualities, such as rate, stress, and rhythm. APP, on the other hand, is thought to affect a phonemic-linguistic level of processing, andconsequently its effects would be primarily, and possibly ex-clusively, reflected at a phonemic level of analysis. For these reasons, the presence of phonetic distortions and ab-normal temporal prosody are linked theoretically only to AOS and have particular status for differential diagnosis between the two disorders.
Despite the relatively straightforward distinction on the basis of a traditional theoretical account, the practical differential diagnosis between AOS and APP is often un-certain and sometimes controversial. The primary reason it has been difficult, in practical applications, to differenti-ate people with AOS from those with APP is that the diagnoses are made exclusively on the basis of syndrome characterization—and there is no agreed-upon gold-standard test for verification (Ballard et al., 2016; Haley, Jacks, de
1The termphonemic paraphasiadesignates errors that listeners
perceive as phonemically different from attempted segments and not otherwise compromised in phonetic quality. Because the term refers to a perceptually defined behavior rather than a syndrome or disorder category, it cannot logically be contrasted with AOS. For diagnostic purposes, we have instead recommended the categoryaphasia with phonemic paraphasiaas a reasonable clinical differentiation (Cunningham, Haley, & Jacks, 2016; Haley, Jacks, & Cunningham, 2013). Here, and in our previous publications, we define AOS and APP as mutually exclusive diagnostic categories that are both relevant to left-hemisphere lesions but cannot co-occur.
aDivision of Speech and Hearing Sciences, Department of Allied
Health Sciences, University of North Carolina, Chapel Hill
bDepartment of Speech and Hearing Sciences, University of
New Mexico, Albuquerque
cDepartment of Communication Sciences and Disorders, University
of Utah School of Medicine, Salt Lake City
dVA Salt Lake City Health Care System, UT
Correspondence to Katarina L. Haley: [email protected] Editor: Nancy Solomon
Associate Editor: Christopher Dromey Received June 15, 2016
Revision received September 13, 2016 Accepted December 12, 2016
https://doi.org/10.1044/2017_AJSLP-16-0103
Riesthal, Abou-Khalil, & Roth, 2012; Miller & Wambaugh, 2017). Consequently, diagnostic sensitivity and specificity cannot be evaluated, and differences in diagnostic impres-sion cannot be explained or reconciled. The AOS syndrome checklist consists of speech qualities that are only broadly defined and often shared with APP. Though not possible to verify, diagnostic accuracy is logically contingent upon the diagnostician’s ability to detect, recognize, and interpret core speech qualities through auditory analysis. These judg-ments can be far from straightforward. Although experi-enced clinicians report recognizing AOS and APP as distinct diagnostic categories, when applied to individual cases their subjective impressions can vary widely (Haley et al., 2012). Unsupported by quantitative documentation or consensus, the value of clinically assigned diagnoses is therefore limited.
To improve diagnostic validity and reliability, it is necessary to develop operational definitions of speech qualities that are logically and empirically linked to the syndrome definitions, measure these well-defined qualities, and interpret them on the basis of quantitative guidelines. In this study, we consider how such strategies apply to the core criterion of perceptually salient segmental sound dis-tortions and distorted substitutions.
Defining Segment Distortions
and Distorted Substitutions
To justify a diagnosis of AOS, clinicians are advised to determine that the speech output is characterized by seg-ment distortions and, in particular, distorted segseg-ment sub-stitutions (Ballard et al., 2015; Duffy, 2013; McNeil, Robin, & Schmidt, 2009). Segment distortions give the impression that there is something phonetically unusual or incorrect about the sound production, whereas distorted substitutions are recognized as phoneme errors that are also phonetically distorted. There are many potential ways in which a seg-ment can be phonetically distorted, and it is not at all clear what kind of distortion errors the clinician should listen for. It is also not clear just how frequent these distortions and distorted substitutions should be to justify a diagnosis of AOS rather than APP.
Whereas broad phonetic transcription forces the lis-tener to apply a phonemic level of analysis and ignore vari-ations within phonemic categories, the addition of diacritic marks through narrow phonetic transcription can be a suit-able tool for quantifying and documenting distortion errors in AOS. The method is basically a collection of coding cate-gories, so its precision, like the syndrome itself, depends on the degree to which those categories are relevant to the target population, explicitly defined, and accurately identified. Very little work has been done to customize and operationalize transcription procedures capable of capturing the distortion errors that clinicians are supposed to recognize.
The acoustic and physiologic literature has supplied diverse examples of articulatory imprecision in both time and space (Blumstein, Cooper, Zurif, & Caramazza, 1977; Haley, 2004; Haley, Ohde, & Wertz, 2000; Harmes et al., 1984; Itoh, Sasanuma, & Ushijima, 1979; Kent & Rosenbek,
1983; Ziegler & Hoole, 1989), primarily for speakers with AOS but also, to a limited extent, for speakers with APP. For the most part, it is not known whether the distortion errors that are demonstrated via instrumentation also give an auditory perceptual impression of distortion or whether they affect speech perception more implicitly or possibly not at all. The only way to learn what sound distortions phonetically trained listeners do hear is to examine what they code when they analyze clinically representative speech samples auditorily.
A handful of studies have applied the method of nar-row phonetic transcription to understand distortion errors in AOS and APP. The most frequent distortion errors documented in this small body of research include conso-nant and vowel prolongation, partial consoconso-nant voicing, and atypical vowel tongue-body position (Haley, Bays, & Ohde, 2001; Odell, McNeil, Rosenbek, & Hunter, 1990, 1991). Despite a presumably detailed coding system, other studies have unfortunately not reported which diacritic marks were used, instead collapsing all categories in the reporting of distortion-error frequency (Canter, Trost, & Burns, 1985; Miller, 1995). Because the diacritic marks available to transcribers limit the type of distortion that can be detected, it is very possible that preliminary obser-vations concerning distortion type were caused by the ob-servation system rather than the analyzed samples. The exceptionally small sample sizes further limit the external validity of these preliminary observations.
We recently analyzed speech samples from 14 indi-viduals with speech sound production errors after stroke or traumatic brain injury (Cunningham et al., 2016) and one speaker recovering from traumatic brain injury (Haley, Shafer, Harmon, & Jacks, 2016) by using a comprehen-sive set of diacritic marks from an educational resource for narrow phonetic transcription (Shriberg & Kent, 2013). Although the results were consistent with previously reported distortion of length, partial consonant voicing, and tongue-body position for vowels, we also observed other types of imprecise production covered in the broader set of diacritic marks, including partial rhoticity and subphonemic devia-tions in consonant manner and place of articulation. In the present study, we extended the exploration to a consider-ably larger participant sample. A primary objective was to develop an empirical basis for a concise and well-defined transcription system customized to speakers with AOS and APP and suitable for application in large-scale studies.
substitutions are considered important criteria for diagnosing AOS in almost any contemporary diagnostic checklist (Duffy, 2013; McNeil et al., 2009; Strand, Duffy, Clark, & Josephs, 2014), a disorder-based grouping conducted today would ensure higher frequencies of distortion and distorted substitution in the AOS group than in the APP compari-son group diagnosed on the basis of the relative absence of these features. A demonstrated group difference would be of no particular interest, because it would be expected even if frequency of distortion or distorted substitution had no significance to the syndrome differentiation.
Because earlier studies were conducted when distor-tion errors were not recognized as a core diagnostic criterion, they may provide some insight concerning basic diagnostic validity. Small group comparisons have shown a higher fre-quency of distortion errors in speakers who met other cri-teria for AOS than in a comparison group with phonemic paraphasia (Canter et al., 1985; Odell et al., 1991). How-ever, because the sample sizes were small and other in-vestigations reported no group differences in distortion frequency across similar groups (Miller, 1995), further re-search is clearly warranted.
To avoid the circularity problem, diagnostic valida-tion quesvalida-tions may be reframed as determining whether those who meet one diagnostic criterion generally also meet one or more other diagnostic criteria. In the case of AOS, the suprasegmental domain is a reasonable choice for an external grouping variable. Slow speech with sound prolon-gations and pauses are considered diagnostic criteria for AOS (Ballard et al., 2015; Duffy, 2013; McNeil et al., 2009). Because these features are particularly evident in multi-syllabic words (Collins, Rosenbek, & Wertz, 1983; Haley & Overton, 2001; Kent & Rosenbek, 1983), analysis of phrases or narratives may not be necessary. We have pre-viously used a quantitative metric of average syllable duration in multisyllabic words to divide participants into two operationally defined comparison groups (Cunningham et al., 2016; Haley et al., 2013) and then evaluated aspects of speech-segment production. Applying the same strategy to the present study, our assumption is that both syllable duration and distortion frequency are central to a diagnosis of AOS but not to a diagnosis of APP. We thus expect a higher frequency of perceptually salient distortions and dis-torted substitutions in participants with long syllable dura-tions than in those with short syllable duradura-tions.
If performance were categorical and differentiation between AOS and APP dichotomous, we would expect a bimodal frequency distribution with no or few distortion errors for APP, many distortion errors for AOS, and no intermediate distortion frequencies. In a preliminary study of 14 participants (Cunningham et al., 2016), this was not our observation. Instead, we found considerable varia-tion within each diagnostic category and a performance continuum from very few to many distortion errors, in-dicating that variations were dispersed on a continuum rather than categorically. Despite this continuity, there was minimal overlap between our two operationally de-fined participant groups. If supported in a larger sample,
these results would indicate that norm-referenced distortion or distorted substitution cutoff values could be highly infor-mative for differential diagnosis between AOS and APP.
Purpose
The first aim of this study was to characterize the most common distortion types after left-hemisphere stroke or trauma. By using a large participant sample, we hoped to restrict a comprehensive set of possible diacritic marks to a more manageable set for use in future research. The second aim was to determine whether distortion is a useful contributing criterion for differentiating between AOS and APP. To address this aim, we asked whether participants with longer syllable duration in multisyllabic words (indi-cating a likely diagnosis of AOS) produced more frequent distortion and distorted-substitution errors than those with shorter syllable duration. Because our objective was to help develop quantitative procedures for clinical diagnosis, the resulting frequency distributions were inspected to deter-mine whether values were dispersed categorically or on a continuum and to what degree they overlapped across the operationally defined diagnostic categories.
Method
Participants
to score above 10% and below 95% to be included. They were also required to present with no more than minimal dysarthria, on the basis of clinical impressions of at least two of the authors. When diagnosed or suspected, the type was always restricted to unilateral upper motor-neuron dysarthria.
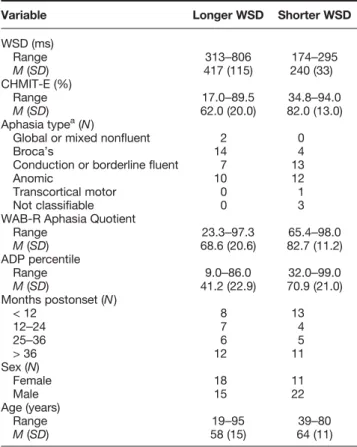
Because some participants were enrolled in other studies and the speech samples were recorded over a pe-riod of several years, assessment procedures varied slightly. For 39 participants, we used the Western Aphasia Battery– Revised (Kertesz, 2007) to diagnose aphasia type and severity; for the other 27, we used the Aphasia Diagnostic Profiles (Helm-Estabrooks, 1992). The most common apha-sia type was anomic aphaapha-sia, followed by conduction or borderline fluent aphasia and Broca’s aphasia.
The data were obtained through narrow transcription coding of a nonstandardized motor speech evaluation, similar to those used in typical clinical evaluations for diag-nosing AOS (Duffy, 2013; Wertz, LaPointe, & Rosenbek,
1984). As is customary, participants were asked to repeat each item after a clinician model. The response to each item was recorded as a separate audio file, using custom software controlled by the clinician. The full protocol in-cluded sentences as well as serial repetition of multisyllabic words (Haley et al., 2012, 2016). However, for the purpose of this study, we analyzed only single-word productions (see Appendix A). For each speaker, the analysis included six to 10 multisyllabic words, four to five disyllabic words, and 20 monosyllabic words, most of which were symmetric (beginning and ending with the same consonant). Variations in the number of words were due to slight modifications of the elicitation protocol during the course of the study.
Word Syllable Duration for Group Assignment
Our grouping criterion was the mean syllable dura-tion in multisyllabic words—the word syllable duration (WSD). It was calculated for the six to 10 multisyllabic words from the motor speech evaluation (see Appendix A). We included only utterances produced with three or more syllables, but allowed an unlimited number of segmental errors. If a production was self-corrected or otherwise repeated, we analyzed the first production that had the cor-rect number of syllables. If no attempt had the corcor-rect number of syllables, we analyzed the first production that was produced with the closest number of syllables. Word duration was measured acoustically by placing markers at the beginning and end of the word in linked spectrographic and waveform analyses. This duration was divided by the number of syllables produced to yield the mean syllable duration for each word, thus including both articulation time and intersyllabic pauses. The WSD for each partici-pant was then expressed as the mean duration across all multisyllabic words produced by that speaker.
Group assignment was based on WSD greater (lon-ger WSD) or less (shorter WSD) than 300 ms. This spe-cific cutoff was selected somewhat arbitrarily, because it approximated 2SDs above the mean in a control group of healthy speakers (Haley et al., 2012) and criteria used in our previous studies (Cunningham et al., 2016; Haley et al., 2013), and because it effectively divided the participant sample into two equal halves with 33 participants in each. A second observer measured the WSD independently for 30% of the sample. Interobserver reliability, expressed as the Pearson correlation coefficient, was .93. As shown in Table 1, WSD ranged from 313 to 806 ms in the longer WSD group and from 174 to 295 ms in the shorter WSD group.
Narrow Phonetic Transcription
Transcription Procedure
All single words from the motor speech evaluation were transcribed phonetically by the same primary tran-scriber. This transcriber was an undergraduate senior stu-dent who had recently completed a course in broad and narrow phonetic transcription for communication disorders and an additional 50 hours of practice transcribing single Table 1.Assessment scores and demographics for the two
participant groups.
Variable Longer WSD Shorter WSD
WSD (ms)
Range 313–806 174–295
M(SD) 417 (115) 240 (33)
CHMIT-E (%)
Range 17.0–89.5 34.8–94.0
M(SD) 62.0 (20.0) 82.0 (13.0)
Aphasia typea(N)
Global or mixed nonfluent 2 0
Broca’s 14 4
Conduction or borderline fluent 7 13
Anomic 10 12
Transcortical motor 0 1
Not classifiable 0 3
WAB-R Aphasia Quotient
Range 23.3–97.3 65.4–98.0
M(SD) 68.6 (20.6) 82.7 (11.2)
ADP percentile
Range 9.0–86.0 32.0–99.0
M(SD) 41.2 (22.9) 70.9 (21.0)
Months postonset (N)
< 12 8 13
12–24 7 4
25–36 6 5
> 36 12 11
Sex (N)
Female 18 11
Male 15 22
Age (years)
Range 19–95 39–80
M(SD) 58 (15) 64 (11)
WSD = word syllable duration; CHMIT-E = Word intelligibility score from the Chapel Hill Multilingual Intelligibility Test for English; WAB-R = Western Aphasia Battery–Revised; ADP = Aphasia Diagnostic Profiles.
a
words and narratives produced by people with AOS and APP. The student had also completed weekly training ses-sions and readings during a semester-long independent study course, learning about principles for clinical tran-scription and comparing his perceptions to those of three other transcribers. We chose this transcriber due to his having recently completed training on a comprehensive transcription system, availability to complete all speech samples, and lack of potential perceptual expectations, because he had no clinical experience diagnosing AOS. As in the analysis for the WSD, when participants self-corrected or repeated their productions, the transcribers coded the first attempt that had the correct number of sylla-bles or, if no attempts had the correct number of syllasylla-bles, the first attempt that had the closest number of syllables. The transcription was completed in Klattese (i.e., computer-readable phonetic characters; Vitevitch & Luce, 2004) using a computer interface (Boersma & Weenink, 2011) and 29 dia-critic marks to indicate distortion, on the basis of defini-tions provided by Shriberg and Kent (2013). A list of the selected diacritic marks is provided in Appendix B. Inter-observer reliability was estimated on the basis of the pro-portion of segments transcribed as nonlength distortions. Scores for the primary transcriber were compared to those for two independent secondary coders. For a second-year graduate student in speech-language pathology, who tran-scribed 54% of the sample, the Pearson correlation coeffi-cient with the primary transcriber was .71; and for a junior undergraduate student who had completed similar train-ing as the primary observer and transcribed 20% of the sam-ple, the correlation coefficient was .76.
Frequency of Distortions and Distorted Substitutions
Because the transcribers were instructed to use dia-critic marks only when they perceived a subphonemic vari-ation that was not a typical allophonic varivari-ation, we used a simple frequency count of diacritic marks to indicate the distortion rate. To be specific, the frequency of distortions was expressed as the percentage of all segments for which one or more diacritic marks was used. A distorted substitu-tion was defined as the substitusubstitu-tion or addisubstitu-tion of a target phoneme plus the transcription of one or more diacritic marks for the same segment. Distortions and distorted sub-stitutions, accordingly, were not mutually exclusive in our coding system. Instead, distorted substitutions were consid-ered a subcategory of the larger distortion error category.
Results
Distortion Types
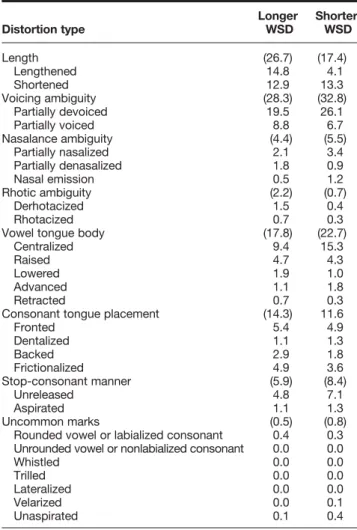
Our first aim was to characterize the types of distor-tion errors to be expected in a representative clinical sam-ple for which differential diagnosis between AOS and APP would be desirable. Table 2 shows the percentage of use for each diacritic mark relative to all diacritic marks. For illustration purposes, we report results separately for the longer WSD and shorter WSD groups (the reported
percentages add up to 100 for each group). A higher percent-age of distortions in the longer WSD group, predictably, in-volved segment prolongation. The relative error-type distribution within each group was otherwise very similar. Distortion of length and voicing were the most common categories, together accounting for more than 50% of dis-tortions in both groups. When vowel tongue-body and consonant tongue-position distortions were added, more than 80% of all distortions were covered. Several other dis-tortion types, such as lip rounding and whistled, trilled, or lateralized production manner, were rarely or never coded.
Diagnostic Validity
Our second aim was to examine the diagnostic valid-ity of segment distortions and distorted substitutions by comparing the frequency across two groups formed on the basis of a different speech criterion for differentiating be-tween AOS and APP. To further avoid circularity, length distortions were excluded from these comparisons. The Table 2.Percent use for each diacritic mark relative to all diacritic marks used within each participant group.
Distortion type
Longer WSD
Shorter WSD
Length (26.7) (17.4)
Lengthened 14.8 4.1
Shortened 12.9 13.3
Voicing ambiguity (28.3) (32.8)
Partially devoiced 19.5 26.1
Partially voiced 8.8 6.7
Nasalance ambiguity (4.4) (5.5)
Partially nasalized 2.1 3.4
Partially denasalized 1.8 0.9
Nasal emission 0.5 1.2
Rhotic ambiguity (2.2) (0.7)
Derhotacized 1.5 0.4
Rhotacized 0.7 0.3
Vowel tongue body (17.8) (22.7)
Centralized 9.4 15.3
Raised 4.7 4.3
Lowered 1.9 1.0
Advanced 1.1 1.8
Retracted 0.7 0.3
Consonant tongue placement (14.3) 11.6
Fronted 5.4 4.9
Dentalized 1.1 1.3
Backed 2.9 1.8
Frictionalized 4.9 3.6
Stop-consonant manner (5.9) (8.4)
Unreleased 4.8 7.1
Aspirated 1.1 1.3
Uncommon marks (0.5) (0.8)
Rounded vowel or labialized consonant 0.4 0.3 Unrounded vowel or nonlabialized consonant 0.0 0.0
Whistled 0.0 0.0
Trilled 0.0 0.0
Lateralized 0.0 0.0
Velarized 0.0 0.1
Unaspirated 0.1 0.4
results, shown in Table 3, indicate that the percentage of words with nonlength distortions and distorted substitu-tions was significantly higher in the longer WSD group than in the shorter WSD group. In light of the group differences for the Chapel Hill Multilingual Intelligibility Test for English (see Table 1), we also computed the per-centage of words transcribed with full phonemic accuracy. This accuracy metric ranged from 15% to 100% of the words and was lower in the longer WSD group (M= 56.7%, SD= 21.7%) than in the shorter WSD group (M= 77.3%, SD= 18.9%),t(64) = 4.148,p= .001.
Having demonstrated significant group differences, we turned our attention to the diagnostic implications for individual cases, as is necessary in clinical practice. Figure 1 shows frequencies of nonlength distortions and distorted substitutions for each participant plotted as a function of mean WSD. The operationalized, and somewhat arbi-trarily selected, cutoff for group assignment at 300 ms is illustrated by a vertical line. Inspection of this figure indi-cates that variations along they-axis were on a continuum for distortions (3% to 31% of all segments) as well as dis-torted substitutions (0% to 8% of segments). There was no evidence of a categorical distinction for either measure, and there was substantial overlap between the groups. The distribution of WSD values on thex-axis also formed a continuum between 171.7 and 805.7 ms, with no separation between clusters of long versus short syllable durations at 300 ms or elsewhere.
Discussion
Group Differences and Performance Continua
The results showed that distortion errors are present in people who have had a stroke or brain injury and exhibit speech sound errors, and that the frequency of distortion errors is significantly higher in participants who produce multisyllabic words slowly than in those who produce them at typical rates. These findings support the basic diagnos-tic validity of distortions and distorted substitutions as cri-teria that contribute to the differentiation between the two behaviorally defined syndromes of AOS and APP. The results can be contrasted with our previous study on error variability in AOS, where we used the mean syllable dura-tion in multisyllabic words to construct similar comparison groups and found no statistical difference (Haley et al., 2013). On the basis of those results, we concluded that diagnostic validity for error variability was lacking and recommendedthat it be removed as a diagnostic criterion for differentiat-ing between AOS and APP.
Despite the global diagnostic validity of distortion frequency, the present study showed not only a performance continuum, as we had previously demonstrated (Cunningham et al., 2016), but also substantial performance overlap be-tween the two participant groups. These results indicate that improved diagnostic practices must extend beyond the development of procedural specifications and explicit cut-off criteria. Multidimensional continuity dimensions should be explored and expressed in quantitative terms. Clinical implications of such initiatives may include expansion of current diagnostic categories beyond the boundaries of prototypical syndrome descriptions.
A continuum of performance was also observed for WSD, indicating that quantitative cutoffs are needed for this diagnostic criterion as well. Our operational differenti-ation between longer and shorter WSD, though guided by results from speakers without neurologic impairment, was selected arbitrarily. Interactions among diagnostic criteria should be explored, as should their relationship to recovery. We recently documented different recovery tra-jectories for speaking rate and fluency than for distortion frequency in a speaker with relatively pure AOS, and also observed a dynamic, and at least partially intentional, trade-off between accuracy and rate (Haley et al., 2016). Exami-nation of how dynamic performance profiles change over time is a logical extension of the performance continua we observed in the present study.
Table 3.Percent segments with nonlength distortions and distorted substitutions for the two participant groups.
Segments
Longer WSD
Shorter WSD
ttest
t(64) p
Distorted 16.6 (4.9) 11.5 (5.8) 3.834 .0003
Distorted + substituted 2.5 (2.4) 0.7 (1.0) 4.043 .0001
Note. WSD = word syllable duration.
The observed frequency of distorted substitutions was very low for all participants, particularly when we ex-cluded diacritic marks for prolongation and shortening. This observation was somewhat surprising in light of the prominence given to this feature in diagnostic guidelines. A likely explanation is that it is difficult to perceive combi-nations of phonemic and subphonemic errors in an ana-lytic manner, given the categorical bias of human speech perception. Some distortions, such as segment prolonga-tions, may be simpler to detect in the context of phonemic substitutions because they vary within a dimension that is external to the judgment of phonemic accuracy. To bet-ter understand these coding challenges, future large-scale studies should detail the types of distorted substitutions that transcribers report. In addition, it is important to dif-ferentiate analytic perception of substitutions and distortions in the same consonant or vowel segments from the impres-sion that both phonemic and phonetic errors are present in the speech sample as a whole. Though the latter is not an example of distorted substitutions, the current distorted-substitution criterion may in practice be interpreted this way, and this practice may or may not be useful.
Our use of a heterogeneous participant sample sup-ports application to a typical population of people who have had left-hemisphere stroke and traumatic brain injury. Caution should, however, be used in generalizing results to earlier stages of recovery, because most of our partici-pants were more than 2 years postonset. Extension of this research to speech samples during the first 6 months of recovery is particularly important, due to diagnostic impli-cations for intervention and prognosis. Potential participants with very mild and very severe impairment of speech pro-duction were not enrolled in this study. Nevertheless, there was extensive variability in severity, and also a significant difference between our participant groups in perceived phonemic accuracy. These differences must be considered in the interpretation of results. To account for severity differences statistically or through more closely matched comparison groups, it will be necessary to sample from a considerably larger clinical population than we were able to access. At the same time, syndrome-related differences in severity may have practical application for clinical diag-nosis and assessment, and should be further defined and characterized.
Customizing and Simplifying Narrow
Phonetic Transcription
We used 29 diacritic marks to cast a broad net and ensure sensitivity to distortion types we may not have an-ticipated. The results show that several of those marks can be eliminated in future studies because they were never, or almost never, used. These include whistled, trilled, later-alized, velarized, and unaspirated productions. Also, dia-critic marks for lip rounding were, predictably, rarely coded in our audio-recorded speech samples. The most frequent distortion types were those reported in previous studies, including segment length, consonant voicing, and vowel
tongue position (Haley et al., 2001; Odell et al., 1990, 1991). In addition, consonant tongue placement was observed relatively frequently in the form of fronted/dentalized, backed, and frictionalized production. The transcriber expressed particular appreciation for the frictionalized mark and suggested that its scope be broadened, in future applications, to include“weak”articulation without an obvious frication component.
In addition to eliminating rarely used distortions, the number of diacritic marks can be reduced by merging conceptually similar categories. For example, marks for variations in tongue position can be combined for conso-nant and vowel targets, and specific place-of-articulation codes, such as dentalized, may be included within these simpler tongue-position categories (e.g., fronted). Because the selection of partial voicing versus devoicing, nasalized versus denasalized, and rhotacized versus derhotacized depends on what phoneme the listener chooses to assign, these variations may instead be expressed through diacritic marks for voicing, nasalance, and rhotic ambiguity. As we expand this research to increasingly larger samples, we anticipate that a reduction in the number of distortion cat-egories by more than half will positively influence coding reliability and efficiency. The ultimate goal is to identify through this exploration an even simpler, yet meaningful, index of the distortion criteria that are intended to be use-ful for differential diagnosis.
The results were inherently limited by the phonetic content of the speech sample. Whereas we refrained from constraining the set of diacritic marks to avoid biasing the results, the speech sample was not similarly unbiased. For convenience and clinical applicability, we relied on a stan-dard motor speech evaluation protocol that was relatively brief and not phonetically balanced. It is possible that a larger and more diverse test protocol would have yielded dif-ferent results and better represented the speakers’abilities.
Future Directions
There is no doubt that the speech-repetition task of a motor speech evaluation engages interactive motor, per-ceptual, and language networks in the left hemisphere. What is not known is how focal brain lesions interfere with these interacting networks and to what extent modality-specific diagnostic categories result. The observation that both segmental distortions and multisyllabic syllable dura-tions are distributed as a continuum of performance rather than a categorical dichotomy indicate that our conceptu-alization of AOS and APP may need to be further devel-oped. To incorporate multidimensional continua within a syndrome account of diagnoses, it is important to explain the full range of performance and, therefore, study the diversity of individuals with speech-production difficulties who are seen in a clinic rather than those who meet exist-ing diagnostic criteria.
us understand what kinds of distortions and distorted sub-stitutions are present in speakers who are diagnosed with AOS by experienced clinicians. This lack of knowledge is also important and should be addressed. In this pursuit, we caution strongly against relying on individual diagnosticians or informal agreement among diagnosticians as proxy for a diagnostic gold standard. Most important, the clinical pur-pose of differential diagnosis should be remembered. To the people who live with these disorders, the label matters only if it drives intervention choices and predicts the potential for recovery and successful living. For these reasons, we suggest prioritizing research on categorical or profile-related differ-ences in prognosis and treatment responsivity.
Acknowledgments
This project was supported by National Institute on Deaf-ness and Other Communication Disorders Grants R03DC011881 (awarded to Adam Jacks) and R03DC006163 (awarded to Katarina L. Haley). We gratefully acknowledge the contributions of Jordan Jarrett, Michael Smith, and Leigh Wallmeyer for conducting the narrow phonetic transcription and Tyson Harmon for helping with the speech-intelligibility testing.
References
Ballard, K. J., Azizi, L., Duffy, J. R., McNeil, M. R., Halaki, M., O’Dwyer, N., . . . Robin, D. A.(2016). A predictive model for diagnosing stroke-related apraxia of speech.Neuropsychologia,
81,129–139.
Ballard, K. J., Wambaugh, J. L., Duffy, J. R., Layfield, C., Maas, E., Mauszycki, S., & McNeil, M. R.(2015). Treatment for acquired apraxia of speech: A systematic review of interven-tion research between 2004 and 2012.American Journal of
Speech-Language Pathology, 24,316–337.
Blumstein, S. E., Cooper, W. E., Zurif, E. B., & Caramazza, A.
(1977). The perception and production of voice-onset time in aphasia.Neuropsychologia, 15,371–383.
Boersma, P., & Weenink, D.(2011). Praat: Doing phonetics by computer (Version 5.2.45) [Computer software]. Retrieved from http://www.praat.org
Canter, G. J., Trost, J. E., & Burns, M. S.(1985). Contrasting speech patterns in apraxia of speech and phonemic paraphasia.
Brain and Language, 24,204–222.
Collins, M., Rosenbek, J. C., & Wertz, R. T.(1983). Spectrographic analysis of vowel and word duration in apraxia of speech.
Journal of Speech and Hearing Research, 26,224–230.
Cunningham, K. T., Haley, K. L., & Jacks, A.(2016). Speech sound distortions in aphasia and apraxia of speech: Reliability and diagnostic significance.Aphasiology, 30,396–413.
Duffy, J. R.(2013).Motor speech disorders: Substrates, differential
diagnosis, and management(3rd ed.). St. Louis, MO: Elsevier
Mosby.
Haley, K.(2004). Vowel duration as a cue to postvocalic stop voic-ing in aphasia and apraxia of speech,Aphasiology, 18,443–456.
Haley, K. L., Bays, G. L., & Ohde, R. N.(2001). Phonetic proper-ties of aphasic-apraxic speech: A modified narrow transcription analysis.Aphasiology, 15,1125–1142.
Haley, K. L., Jacks, A., & Cunningham, K. T.(2013). Error vari-ability and the differentiation between apraxia of speech and aphasia with phonemic paraphasia.Journal of Speech, Language,
and Hearing Research, 56,891–905.
Haley, K. L., Jacks, A., de Riesthal, M., Abou-Khalil, R., & Roth, H. L.(2012). Toward a quantitative basis for assessment and diagnosis of apraxia of speech.Journal of Speech, Language,
and Hearing Research, 55,S1502–S1517.
Haley, K. L., Ohde, R. N., & Wertz, R. T.(2000). Precision of fricative production in aphasia and apraxia of speech: A perceptual and acoustic study.Aphasiology, 14,619–634.
Haley, K. L., & Overton, H. B.(2001). Word length and vowel duration in apraxia of speech: The use of relative measures.
Brain and Language, 79,397–406.
Haley, K. L., Roth, H., Grindstaff, E., & Jacks, A.(2011). Computer-mediated assessment of intelligibility in aphasia and apraxia of speech.Aphasiology, 25,1600–1620.
Haley, K. L., Shafer, J. N., Harmon, T. G., & Jacks, A.(2016). Recovering with acquired apraxia of speech: The first 2 years.
American Journal of Speech-Language Pathology, 25,S687–S696.
Harmes, S., Daniloff, R. G., Hoffman, P. R., Lewis, J., Kramer, M. B., & Absher, R.(1984). Temporal and articulatory con-trol of fricative articulation by speakers with Broca’s
apha-sia.Journal of Phonetics, 12,367–385.
Helm-Estabrooks, N.(1992).Aphasia Diagnostic Profiles. Austin, TX: Pro-Ed.
Itoh, M., Sasanuma, S., & Ushijima, T.(1979). Velar movements during speech in a patient with apraxia of speech.Brain and
Language, 7,227–239.
Kent, R. D., & Rosenbek, J. C.(1983). Acoustic patterns of apraxia of speech.Journal of Speech and Hearing Research,
26,231–249.
Kertesz, A.(2007).The Western Aphasia Battery–Revised.New York: Grune & Stration.
McNeil, M. R., Robin, D. A., & Schmidt, R. A.(2009). Apraxia of speech: Definition, differentiation, and treatment. In. M. R.
McNeil (Ed.),Clinical management of sensorimotor speech
dis-orders(2nd ed.; pp. 249–268). New York, NY: Thieme.
Miller, N.(1995). Pronunciation errors in acquired speech disor-ders: The errors of our ways.International Journal of Language
& Communication Disorders, 30,346–361.
Miller, N., & Wambaugh, J.(2017). Acquired apraxia of speech. In I. Papathanasiou & P. Coppens, (Eds.),Aphasia and related
neurogenic communication disorders(2nd ed.; pp. 493–526).
Burlington, MA: Jones & Bartlett Learning.
Odell, K., McNeil, M. R., Rosenbek, J. C., & Hunter, L.(1990). Perceptual characteristics of consonant production by apraxic speakers.Journal of Speech and Hearing Disorders, 55,345–359.
Odell, K., McNeil, M. R., Rosenbek, J. C., & Hunter, L.(1991). Perceptual characteristics of vowel and prosody production in apraxic, aphasic, and dysarthric speakers.Journal of Speech
and Hearing Research, 34,67–80.
Shriberg, L. D., & Kent, R. D.(2013).Clinical phonetics(4th ed.). Boston, MA: Pearson.
Strand, E. A., Duffy, J. R., Clark, H. M., & Josephs, K.(2014). The Apraxia of Speech Rating Scale: A tool for diagnosis and description of apraxia of speech.Journal of Communication
Disorders, 51,43–50.
Vitevitch, M. S., & Luce, P. A.(2004). A web-based interface to calculate phonotactic probability for words and nonwords in English.Behavior Research Methods, Instruments, &
Com-puters, 36,481–487.
Wertz, R. T., LaPointe, L. L., & Rosenbek, J. C.(1984).Apraxia
of speech in adults: The disorder and its management. Orlando,
FL: Grune & Stratton.
Appendix A
Target Words Used in the Motor Speech Evaluation
Monosyllabic words Disyllabic words Multisyllabic words
mom, judge snowman gingerbread
peep, bib thicker volcano
nine, tot/tote jabber stethoscope
dad, shush zipper spaghetti
coke/kick, gag flatter thickening
fife, sis jabbering
zoos, church zippering
lull, roar flattering
zip, thick harmonica
jab, flat constitution
television
Appendix B
Distortion Categories (Diacritic Marks) for Coding Distorted Segments
1. Centralized vowel
2. Retracted tongue body
3. Advanced tongue body
4. Raised tongue body
5. Lowered tongue body
6. Fronted consonant
7. Backed consonant
8. Dentalized
9. Velarized
10. Lateralized
11. Rhotacized
12. Derhotacized
13. Frictionalized
14. Partially voiced
15. Partially devoiced
16. Aspirated
17. Unaspirated
18. Unreleased
19. Partially nasalized
20. Nasal emission
21. Partially denasalized
22. Rounded vowel
23. Unrounded vowel
24. Labialized (rounded) consonant
25. Nonlabialized (unrounded) consonant
26. Whistled
27. Trilled
28. Lengthened